RunwiseFX Support Resistance Pivot with Alert
- Indicadores
- Versión: 1.6
- Actualizado: 17 noviembre 2021
- Activaciones: 5

Descripción
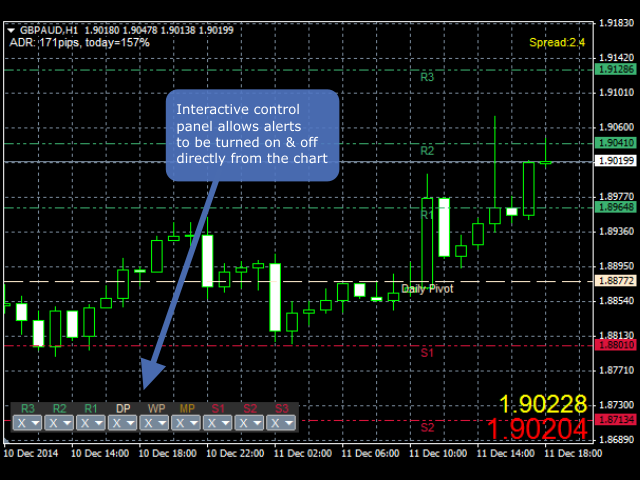
El producto dibuja líneas en el gráfico para mostrar el soporte diario, la resistencia y el pivote, además del pivote semanal y mensual. Se puede establecer una alerta cuando el precio alcanza una de las líneas o el precio cierra por encima/por debajo de ella. Esto puede ser útil tanto para entrar como para salir. Las alertas pueden controlarse de forma interactiva directamente desde el gráfico.
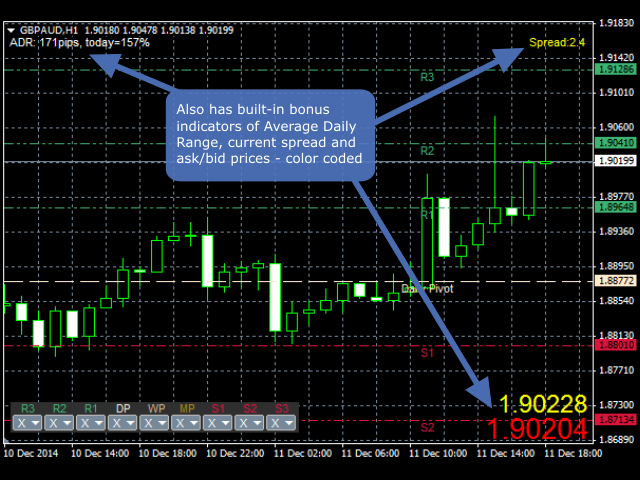
El producto también incluye indicadores adicionales de Average Daily Range (o Average True Range - configurable), spread actual y precios ask/bid en texto grande, codificados por colores según los cambios de precio.
Utilización
Los pivotes y los soportes/resistencias son precios importantes para considerar la entrada si la vela anterior ha cerrado por encima/por debajo de la línea, o en términos de salida, si el precio ha alcanzado la línea. La razón es que el precio puede muy bien "rebotar" en la línea y empezar a moverse en la dirección opuesta. Las alertas le permiten actuar cuando se alcanzan/cierran las líneas sin tener que vigilar continuamente el gráfico.
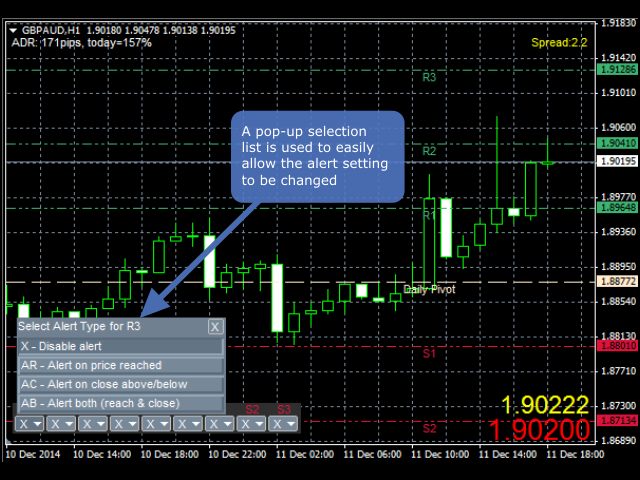
Las alertas pueden activarse y desactivarse por línea simplemente haciendo clic en la opción del panel de control del indicador. Un cuadro de selección emergente le permite establecer la alerta que necesita.
Para que la alerta funcione, debe dejar el gráfico abierto con el indicador colocado en él. La alerta puede configurarse como emergente, reproducción de sonido de archivo wav, correo electrónico o notificación.
El Average Daily Range (ADR) incluido le muestra cuántos pips se mueve normalmente el par de divisas en un día y cuánto ha hecho ya hoy en porcentaje. Debe evitar abrir una nueva operación si se acerca o ha superado el 100%. Además, si el ADR se acerca al 100%, entonces es más probable que se produzca un "rebote" desde una de las líneas de soporte/resistencia.
Un indicador de diferencial adicional mostrará el diferencial actual, que puede configurarse para que cambie de color si el diferencial ha subido demasiado. También se pueden mostrar los precios actuales de compra/venta en texto grande. Los precios se colorearán en verde si han subido, en rojo si han bajado o en amarillo si se han mantenido igual. Los indicadores son opcionales y totalmente configurables.
Entradas del indicador
| Variable | Descripción |
|---|---|
| Main_showSupportResistance | Si es true, se muestran las líneas de soporte/resistencia en el gráfico |
| Main_showDailyPivot | Si es true, la línea de pivote diario se muestra en el gráfico |
| Principal_mostrarPivoteSemanal | Si es true, entonces la línea de pivote semanal se muestra en el gráfico. |
| Main_showMonthlyPivot | Si es true, entonces la línea de pivote mensual se muestra en el gráfico |
| Main_showAverageRange | Si es true, entonces se muestra el Rango Promedio Diario (ADR) |
| Main_averageRangeMode | Cambia de ADR a ATR (Average True Range) |
| Main_averageRangeCorner | Esquina del gráfico donde se muestra el ADR |
| Main_averageRangeX | Posición X del ADR |
| Main_averageRangeY | Posición Y del ADR |
| Main_averageDailyRangeDays | Días utilizados para ADR |
| Main_averageTrueRangeDays | Días utilizados para ATR |
| Estilo_de_líneaParaPivotes | Estilo de línea para líneas pivote |
| Estilo_líneaForSuppRes | Estilo de línea para líneas de soporte/resistencia |
| Color_soporte | Color de las líneas de soporte |
| Color_resistencia | Color de las líneas de resistencia |
| Color_diario | Color del pivote diario |
| Color_weekly | Color del pivote semanal |
| Color_mensual | Color del pivote mensual |
| Esquina_caja | La esquina del gráfico en la que se muestra el panel de control de la alerta. Por defecto es abajo a la izquierda. |
| Caja_X | Coordenada X en la que se muestra el panel de control de la alerta. |
| Caja_Y | Coordenada Y en la que se muestra el panel de control de la alerta. |
NO so good,when you restart the MT4,all alerts setup are failed...