RCCMA Custom Moving Average for RCC MT4
- Indicadores
-
Yutaka Okamoto
 I specialize in developing high-quality indicators for both MT5 and MT4 platforms.
With a strong background in programming and a keen eye for market analysis,
I strive to create innovative and effective tools that help traders make informed decisions and achieve success in their trading journey. - Versión: 1.0
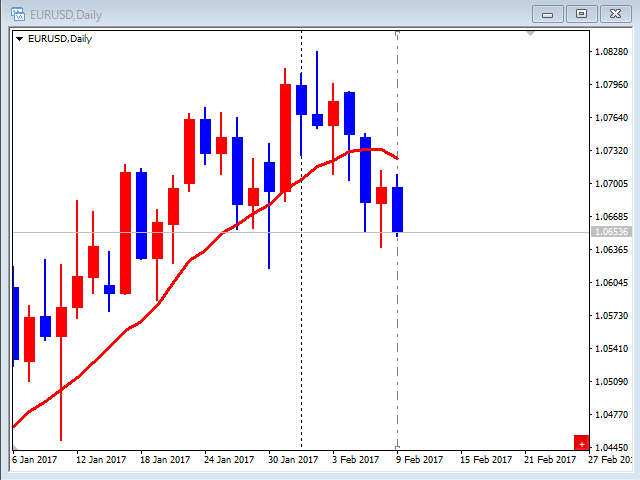
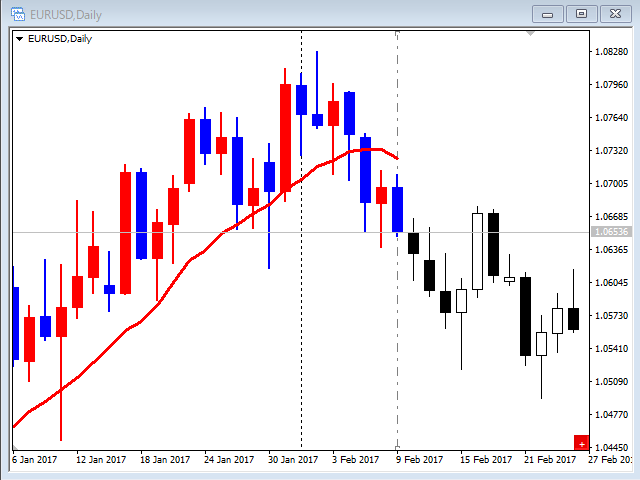
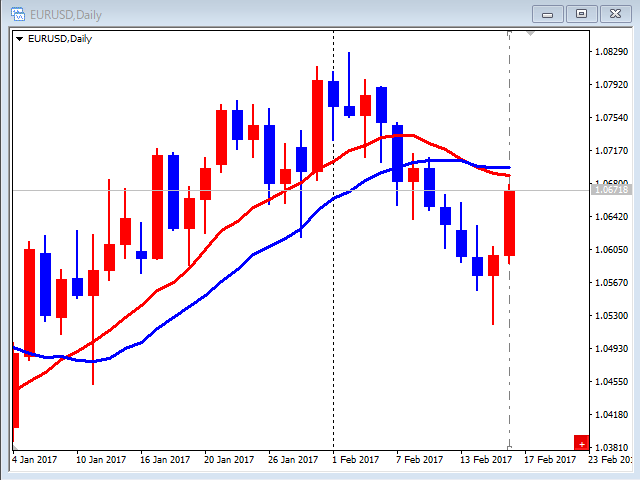
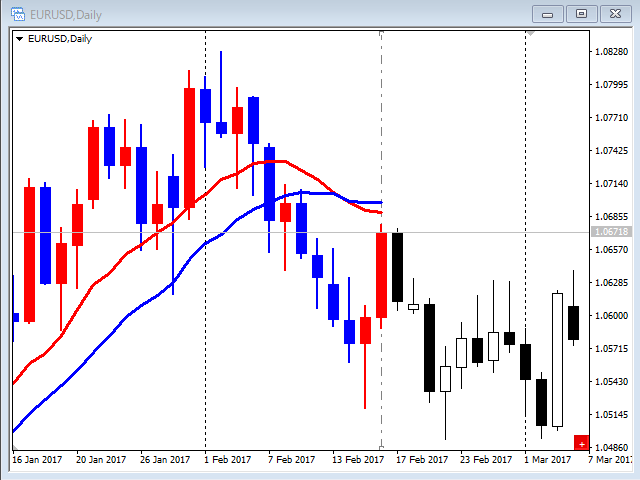
RCCMA es un indicador general de media móvil que funciona con ReviewCandleChart.
El original es "Custom Moving Average" proporcionado por MetaQuotes Software Corp. Basado en ese código fuente, he correspondido a ReviewCandleChart.
Ventajas
- Cuando ReviewCandleChart está activado, no se mostrará ninguna línea a la derecha de la línea de referencia vertical.
- Cuando ReviewCandleChart está en ON y se pulsa una tecla como "Z" o "X" A continuación, se dibuja la MA.
- Cuando ReviewCandleChart está en OFF, se realiza el mismo dibujo que la "Media Móvil Personalizada" original.
Consejos de uso
El producto ha demostrado su eficacia junto con ReviewCandleChart.
Parámetros del indicador
- Periodo - [13]
- Desplazamiento - [0]
- Método - [Suavizado]
- Simple
- Exponencial
- Suavizado
- Lineal ponderado
Desarrollador
Yutaka Okamoto, programador profesional.
El usuario no ha dejado ningún comentario para su valoración