Mira cómo descargar robots gratis
¡Búscanos en Telegram!
Pon "Me gusta" y sigue las noticias
Pon "Me gusta" y sigue las noticias
¿Es interesante este script?
Deje un enlace a él, ¡qué los demás también lo valoren!
Deje un enlace a él, ¡qué los demás también lo valoren!
¿Le ha gustado el script?
Evalúe su trabajo en el terminal MetaTrader 5
Evalúe su trabajo en el terminal MetaTrader 5
- Visualizaciones:
- 19626
- Ranking:
- Publicado:
-
¿Necesita un robot o indicador basado en este código? Solicítelo en la bolsa freelance Pasar a la bolsa
Author:
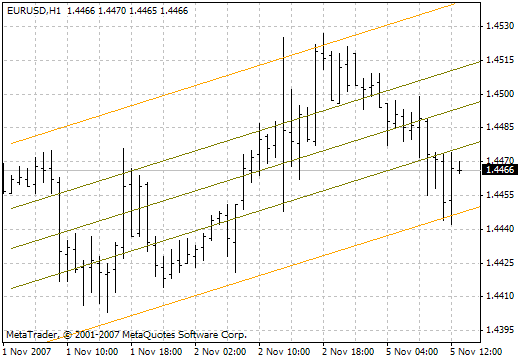
The Standard Deviation Channel is plotted on the basis of the Linear Regression Trend, representing a usual trendline drawn between two points on the price chart using the method of least squares. More...

The Standard Deviation Channel is plotted on the basis of the Linear Regression Trend, representing a usual trendline drawn between two points on the price chart using the method of least squares. More...

Traducción del ruso realizada por MetaQuotes Ltd
Artículo original: https://www.mql5.com/ru/code/7576
 Pivot-2
Another version of determining the pivot point of the next day.
 ADXm
ADXm
The ADXm indicator, unlike the traditional one, allows to see the positive and negative waves of the trend. The method for working with this indicator is the same as with the traditional one.
 StochasticOnPriceVSwma
A version of the Stochastic located right in the price window.
 Three Line Break
Three-Line Break charts. This method has been described by Steve Nison in the book "Japanese Candlestick Charting Techniques". "Three-Line Break" combines the qualities of the "tic-tac-toe" charts and the standard line charts or bars.