Pon "Me gusta" y sigue las noticias
Deje un enlace a él, ¡qué los demás también lo valoren!
Evalúe su trabajo en el terminal MetaTrader 5

3rd Generation Moving Average - indicador para MetaTrader 4

- Visualizaciones:
- 23350
- Ranking:
- Publicado:
- Actualizado:
-
 Está perdiendo oportunidades comerciales:
- Aplicaciones de trading gratuitas
- 8 000+ señales para copiar
- Noticias económicas para analizar los mercados financieros
Registro EntradaUsted acepta la política del sitio web y las condiciones de uso
Si no tiene cuenta de usuario, regístrese -
 ¿Necesita un robot o indicador basado en este código? Solicítelo en la bolsa freelance
Pasar a la bolsa
¿Necesita un robot o indicador basado en este código? Solicítelo en la bolsa freelance
Pasar a la bolsa
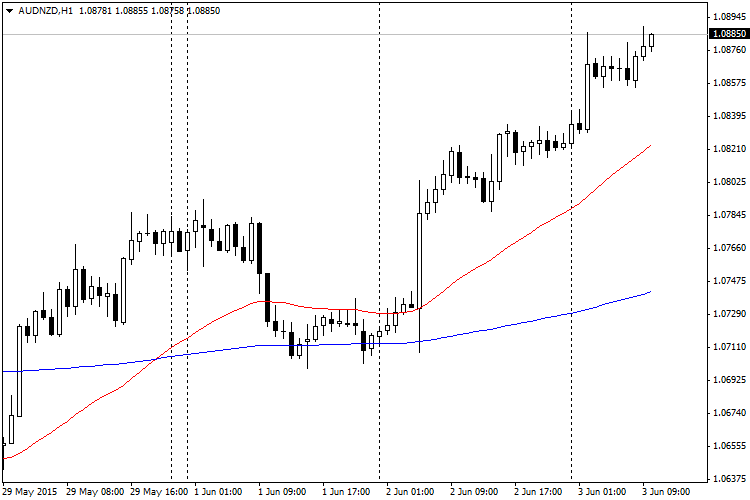
The advanced version of the standard Moving Average indicator, which uses quite a simple procedure on decreasing temporal lag based on the increase of the Moving Average period. The method was firstly described by Manfred G. Dürschner in his article Gleitende Durchschnitte 3.0 (in German). The presented implementation uses λ = 2, which provides the best possible reduction of the lag. Higher λ increases similarity with the classic moving average.
Input Parameters:
- MA_Period (default = 50) — period of the resulting 3rd generation moving average.
- MA_Method (default = 1) — moving average method (0 — SMA, 1 — EMA, 2 — SMMA, 3 — LWMA).
- MA_Applied_Price (default = 5) — price type to calculate the moving average (0 — PRICE_CLOSE, 1 — PRICE_OPEN, 2 — PRICE_HIGH, 3 — PRICE_LOW, 4 — PRICE_MEDIAN, 5 — PRICE_TYPICAL, 6 — PRICE_WEIGHTED).
As you see, the 3rd Generation Moving Average (red line) offers slightly less lag than the conventional EMA (blue line) and reacts to the price changes faster. Unfortunately, it still has some delay and can give false signals. This indicator can be used just like a standard moving average - to determine the direction of the current trend.
Traducción del ruso realizada por MetaQuotes Ltd
Artículo original: https://www.mql5.com/ru/code/13139
 Forex Fraus Slogger
The Expert Advisor is based on the operation of its predecessor — Forex Fraus (for M1), but using the Envelopes indicator.
VR Moving Average
The classic Moving Average indicator with a color change depending on the direction.
Coppock
The Coppock indicator shows long-term opportunities for buying or selling.
Aroon Up and Down
The Aroon Up and Down indicator detects the local tops and bottoms on the chart.