JET Volume Flow PRO
- Indicators
-
JETINVEST
 Jet Invest develops indicators and trading tools for MetaTrader 4 and 5: order flow, volume, market structure and market overview panels for B3 (WIN, WDO and Brazilian stocks), US indices and forex.
- Version: 1.0
- Activations: 5
Buying and selling volume flow, with arrows, alerts and a multi-timeframe panel, on your MetaTrader 5 chart.
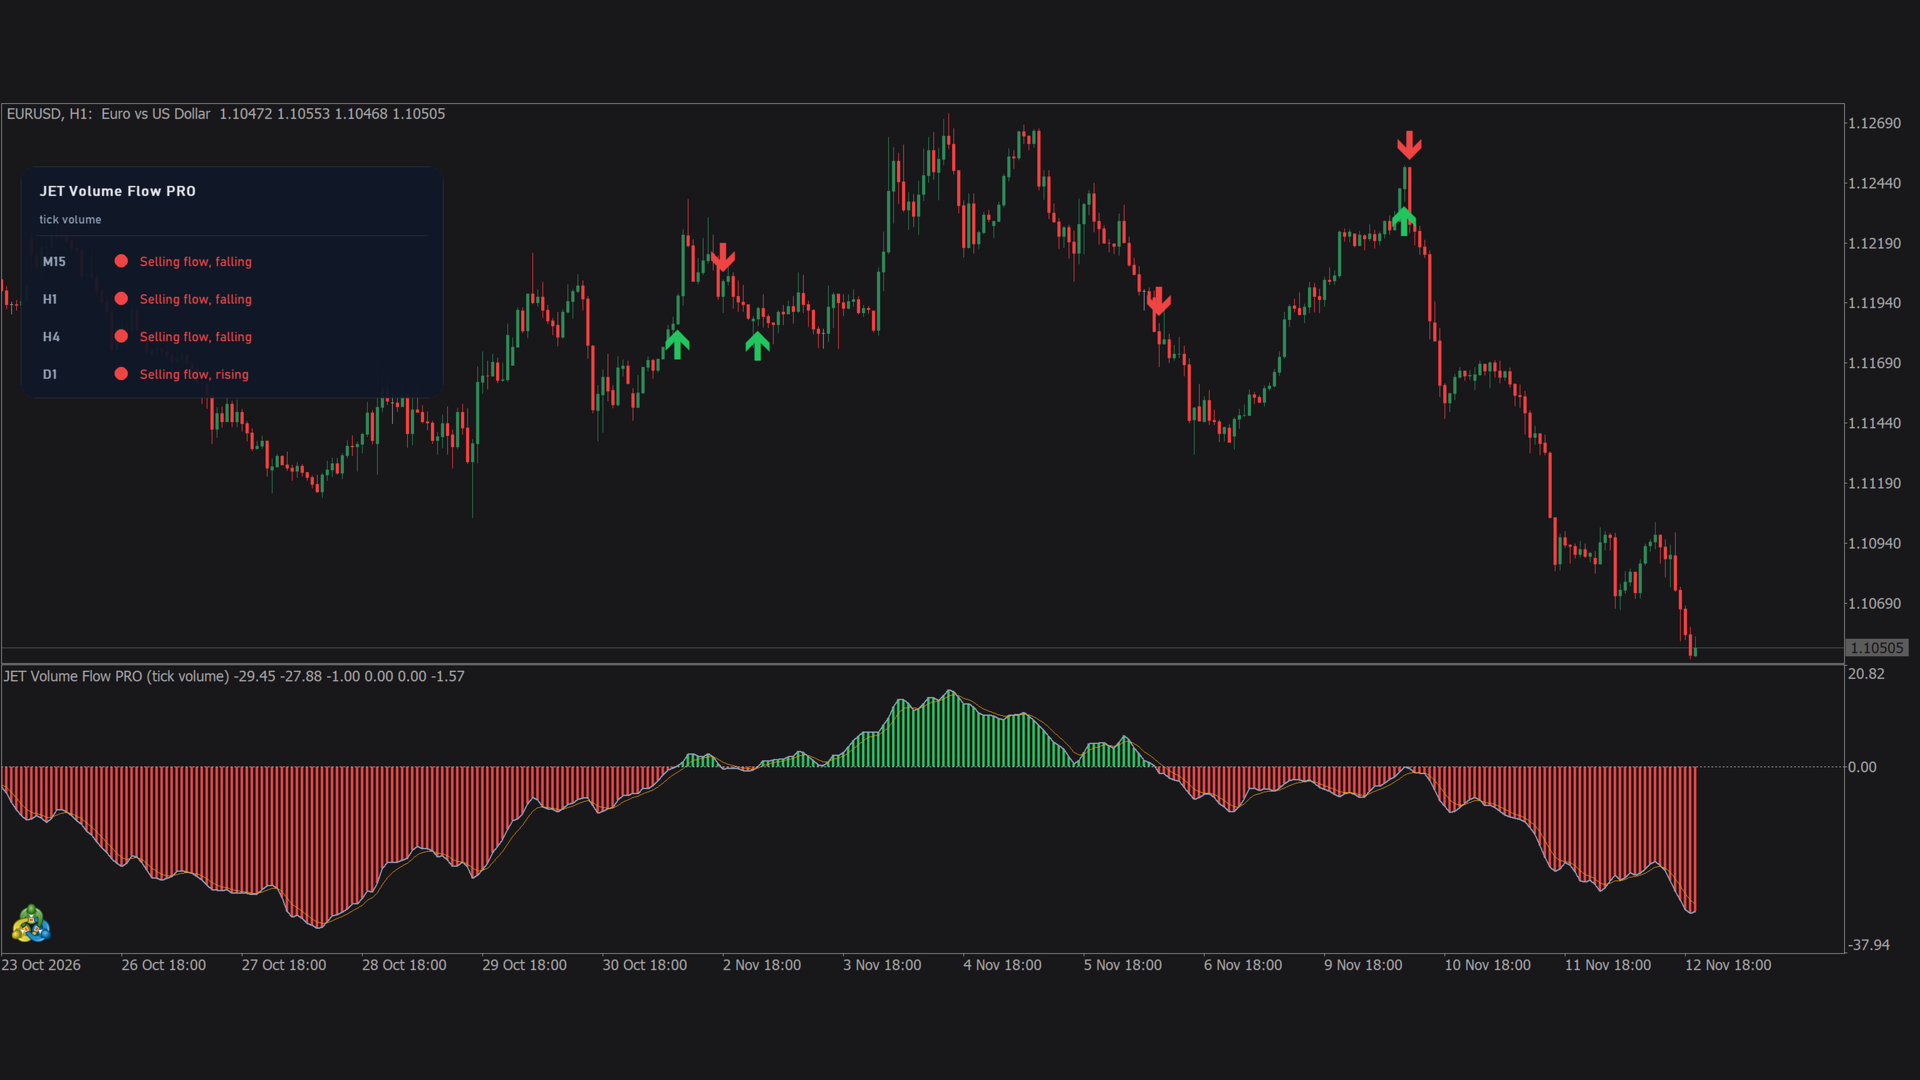
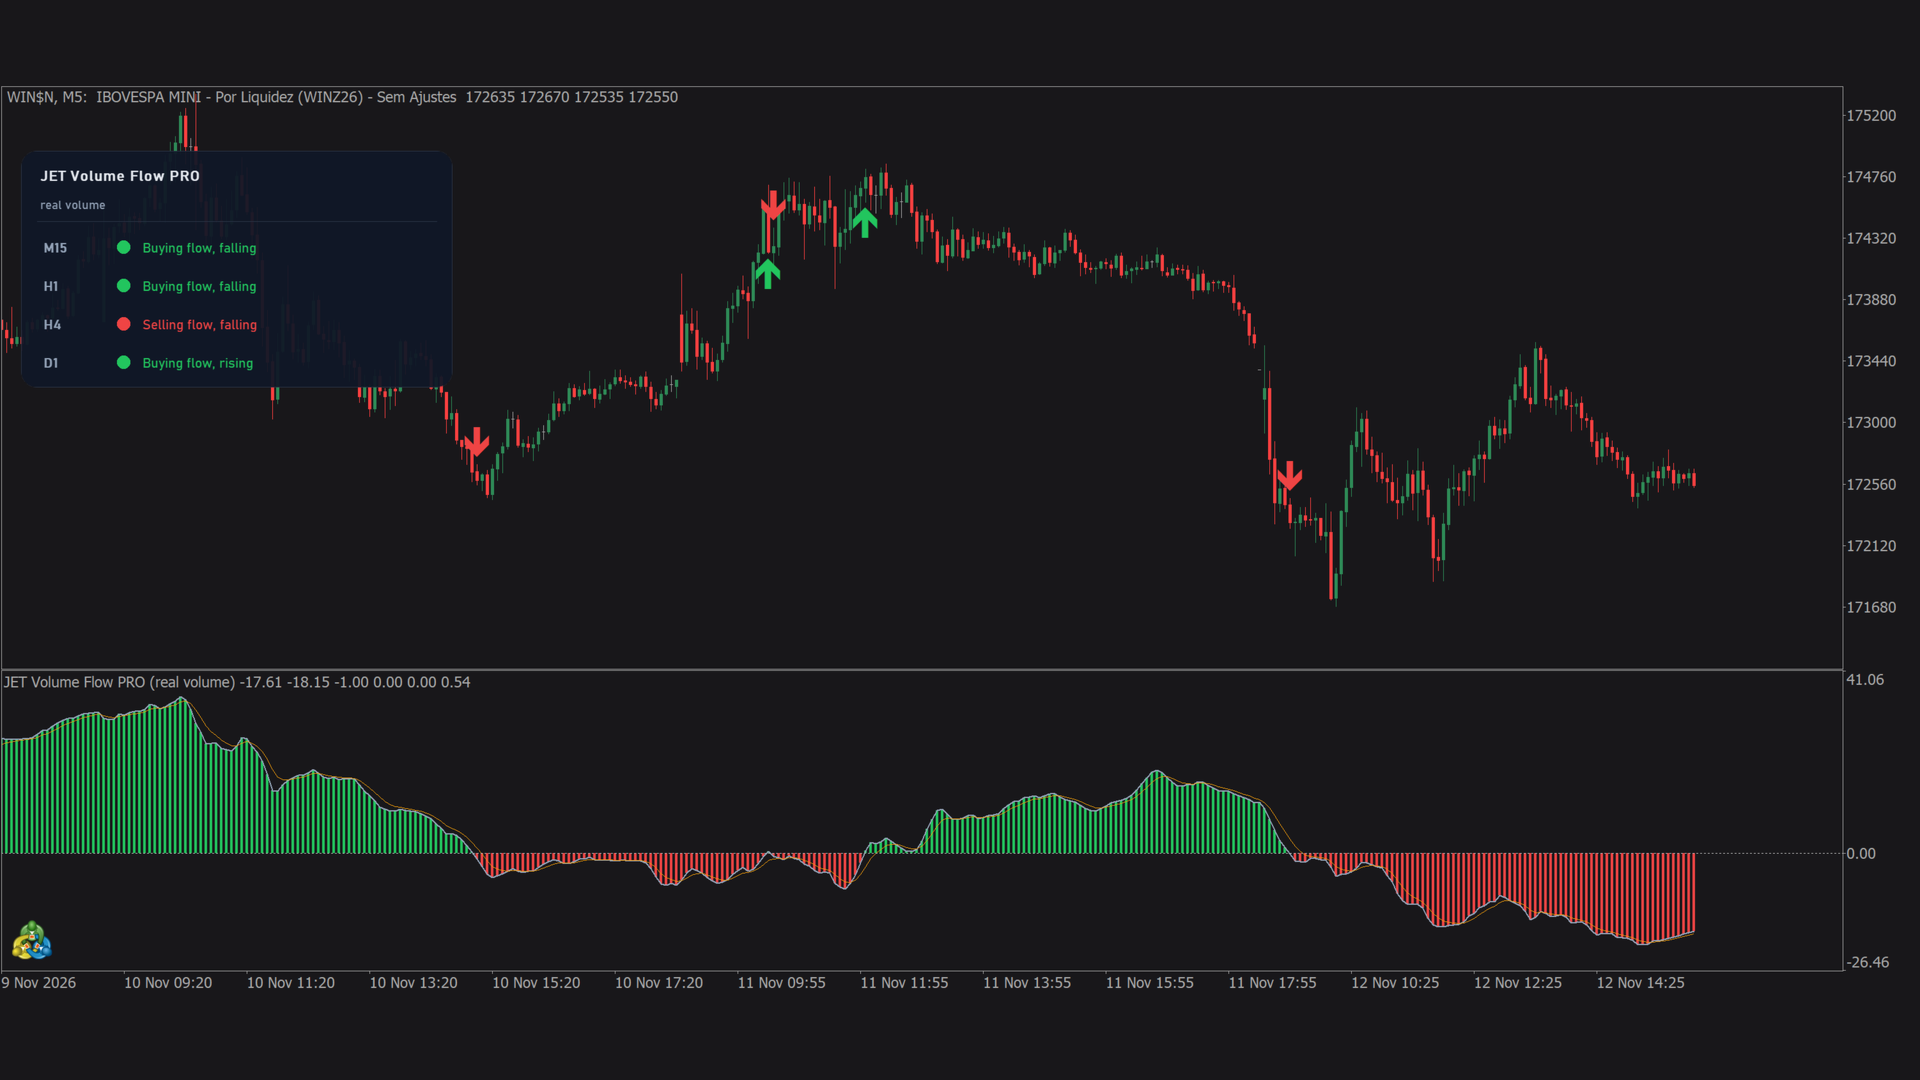
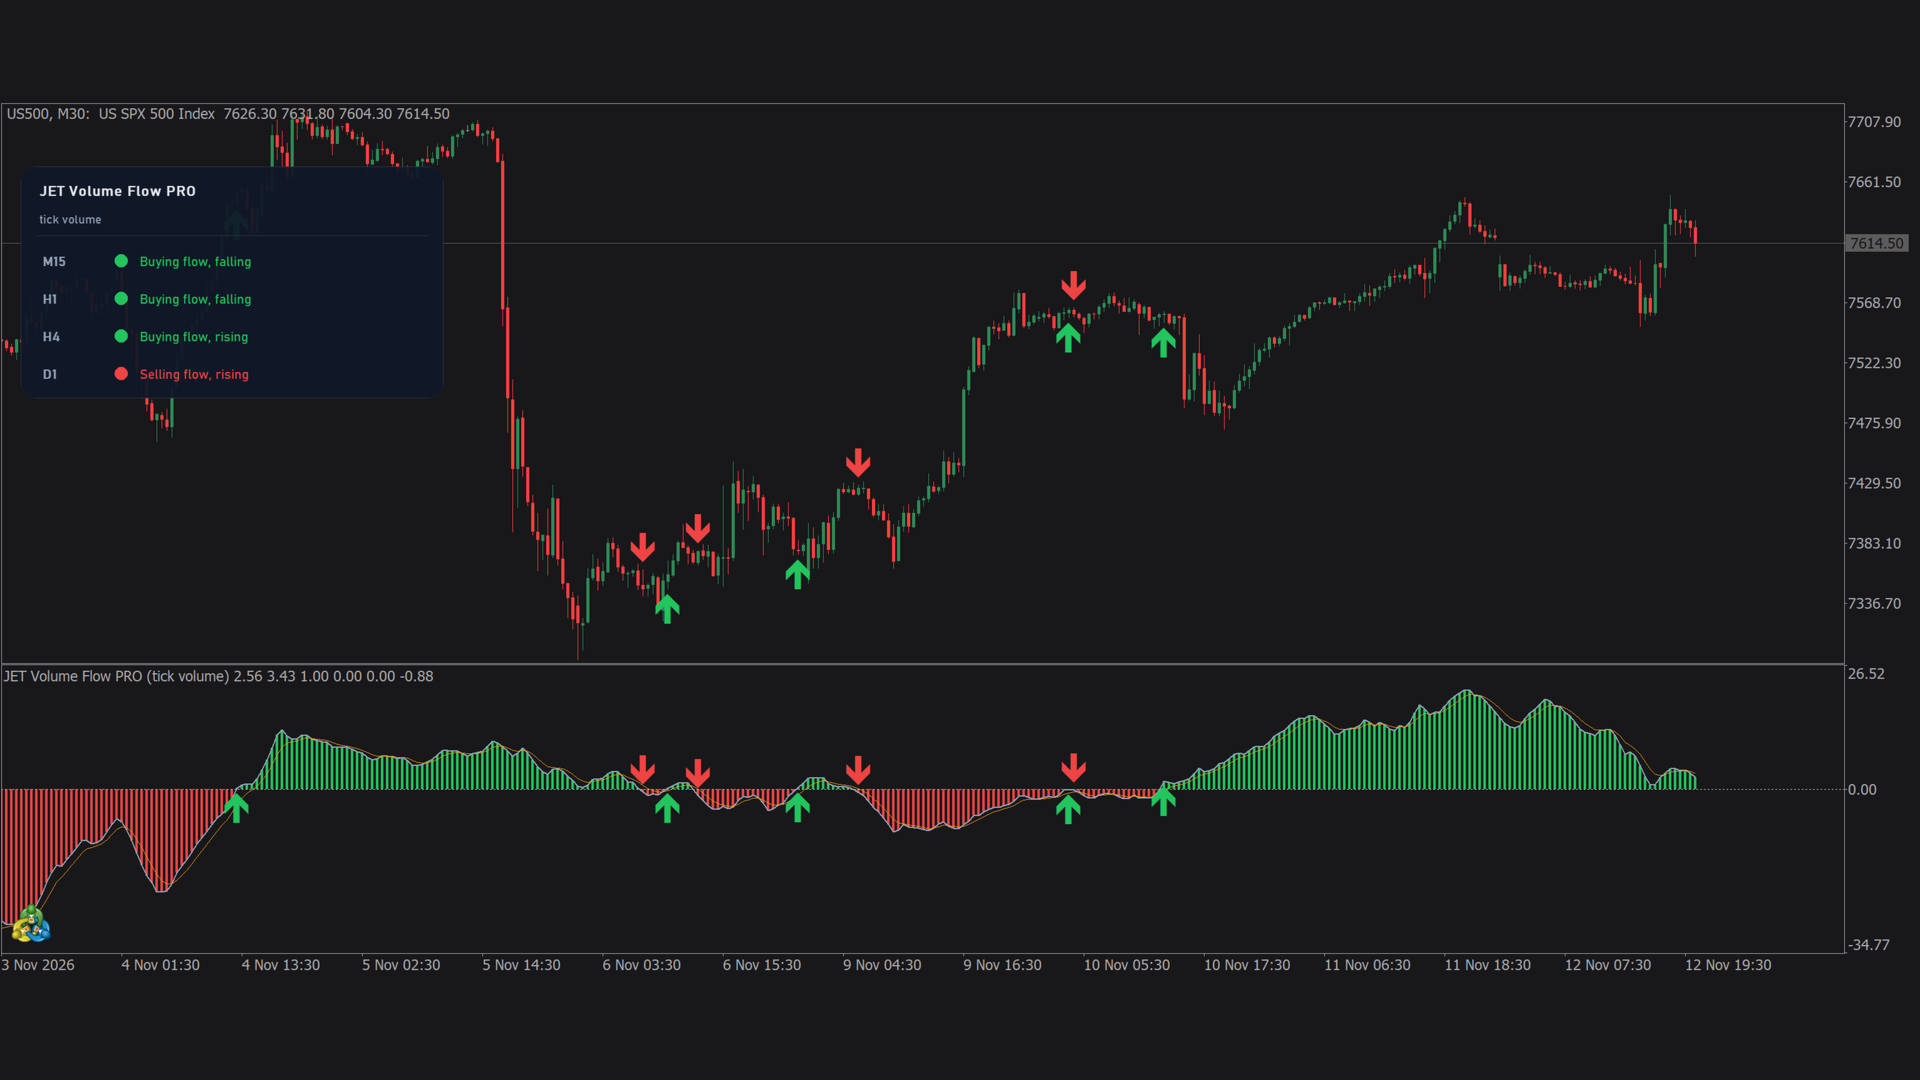
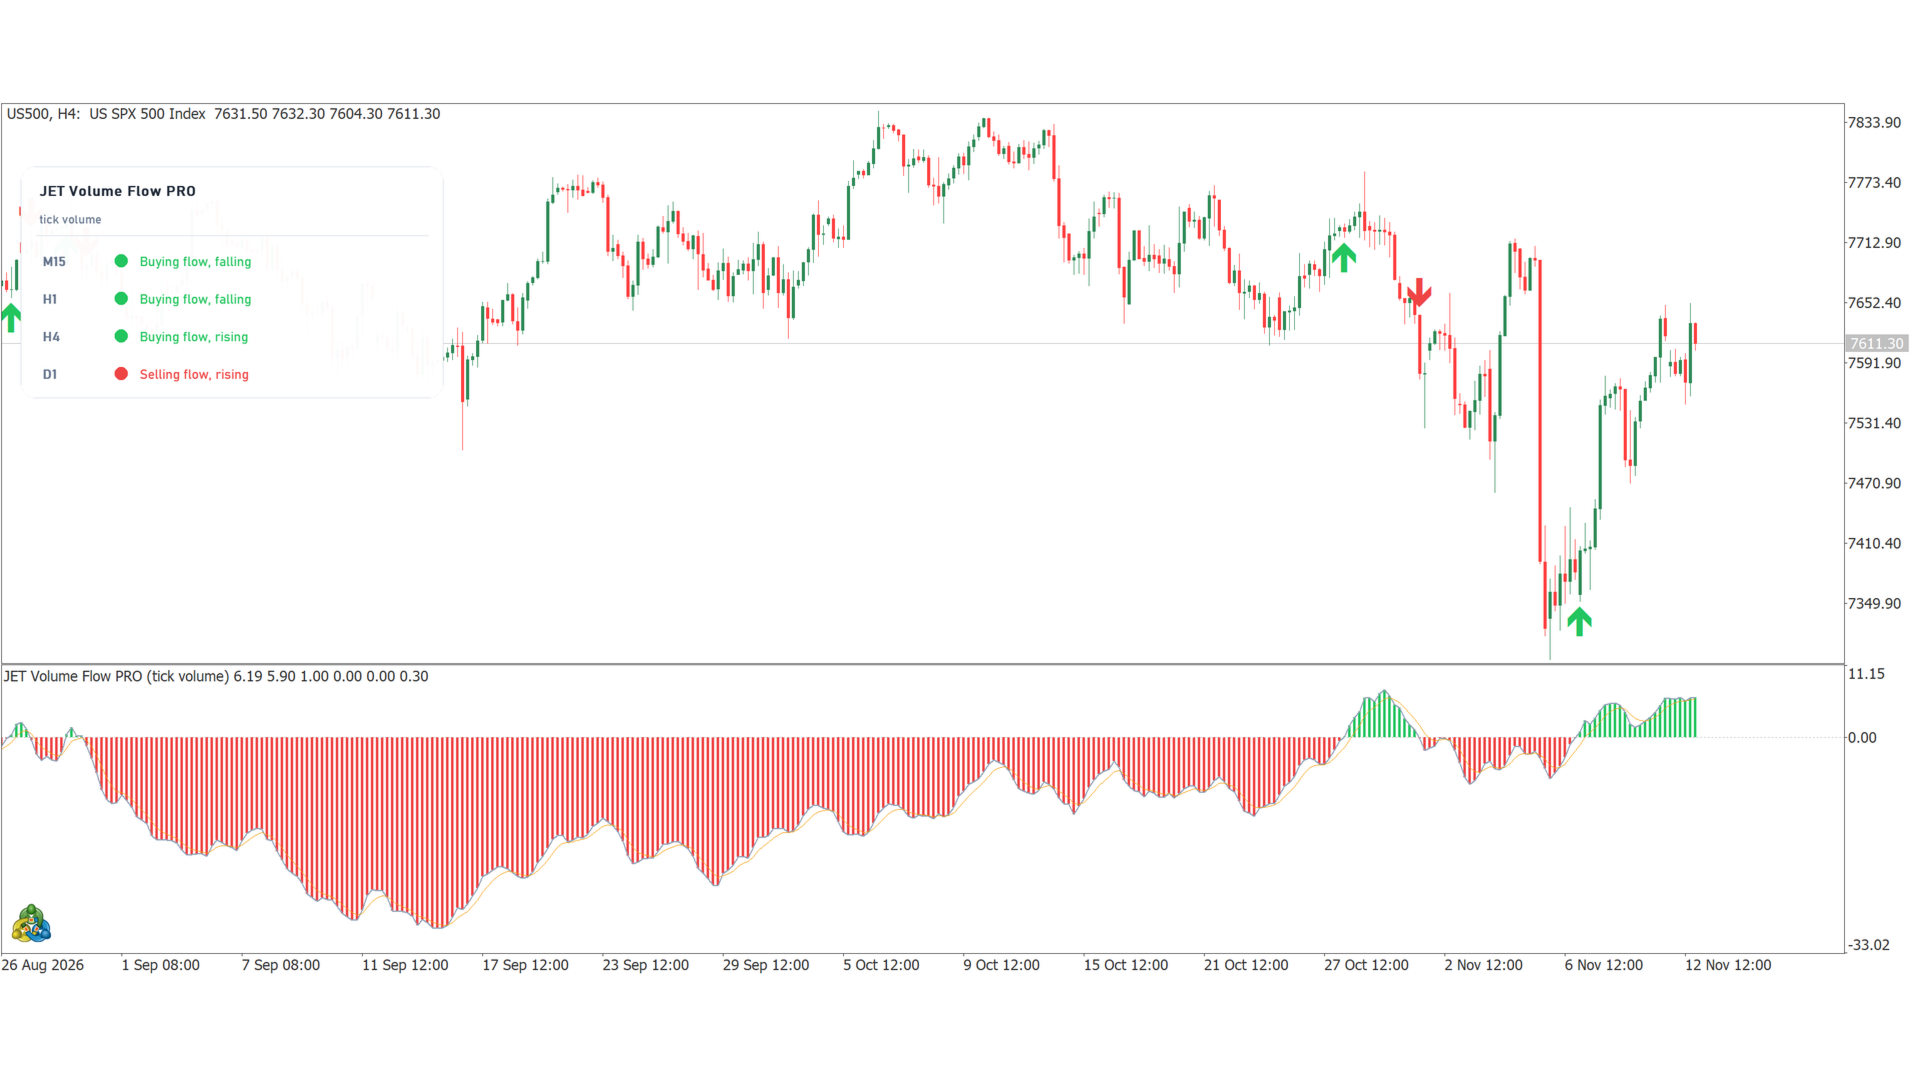
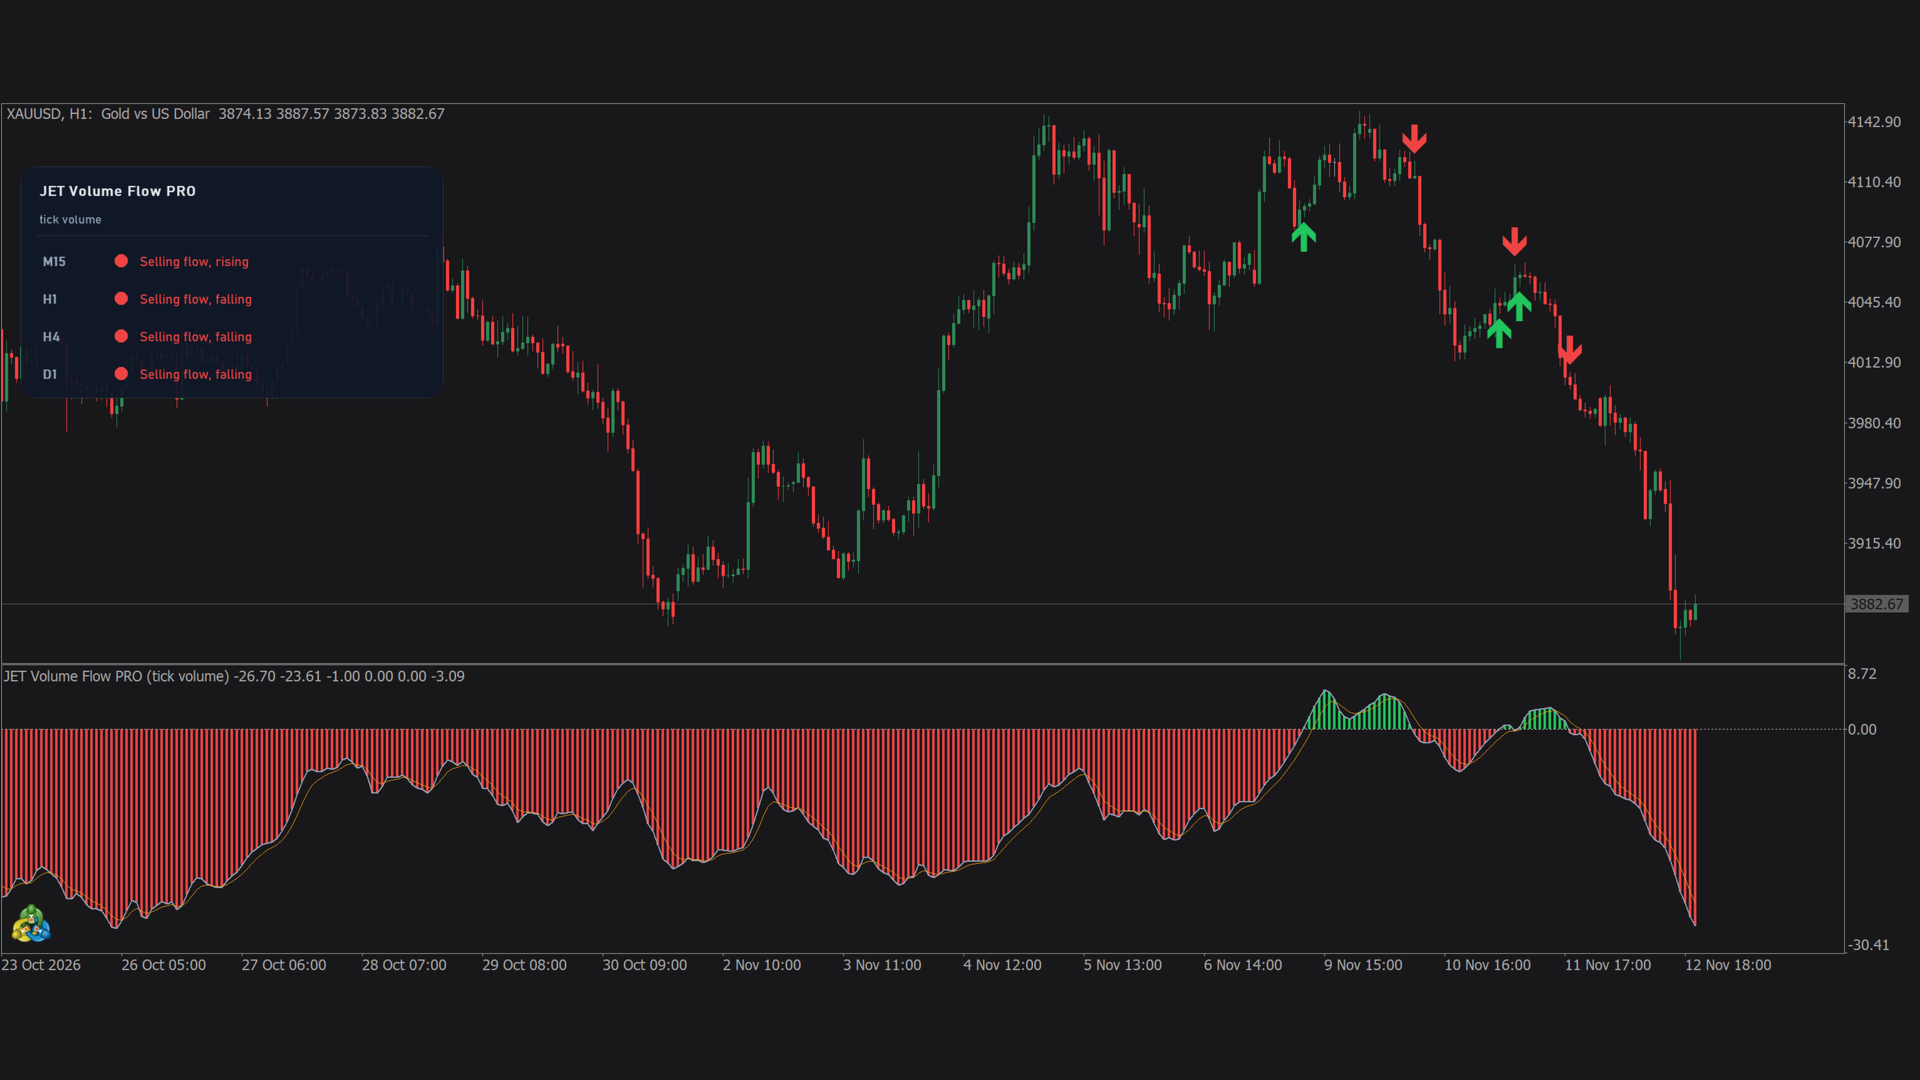
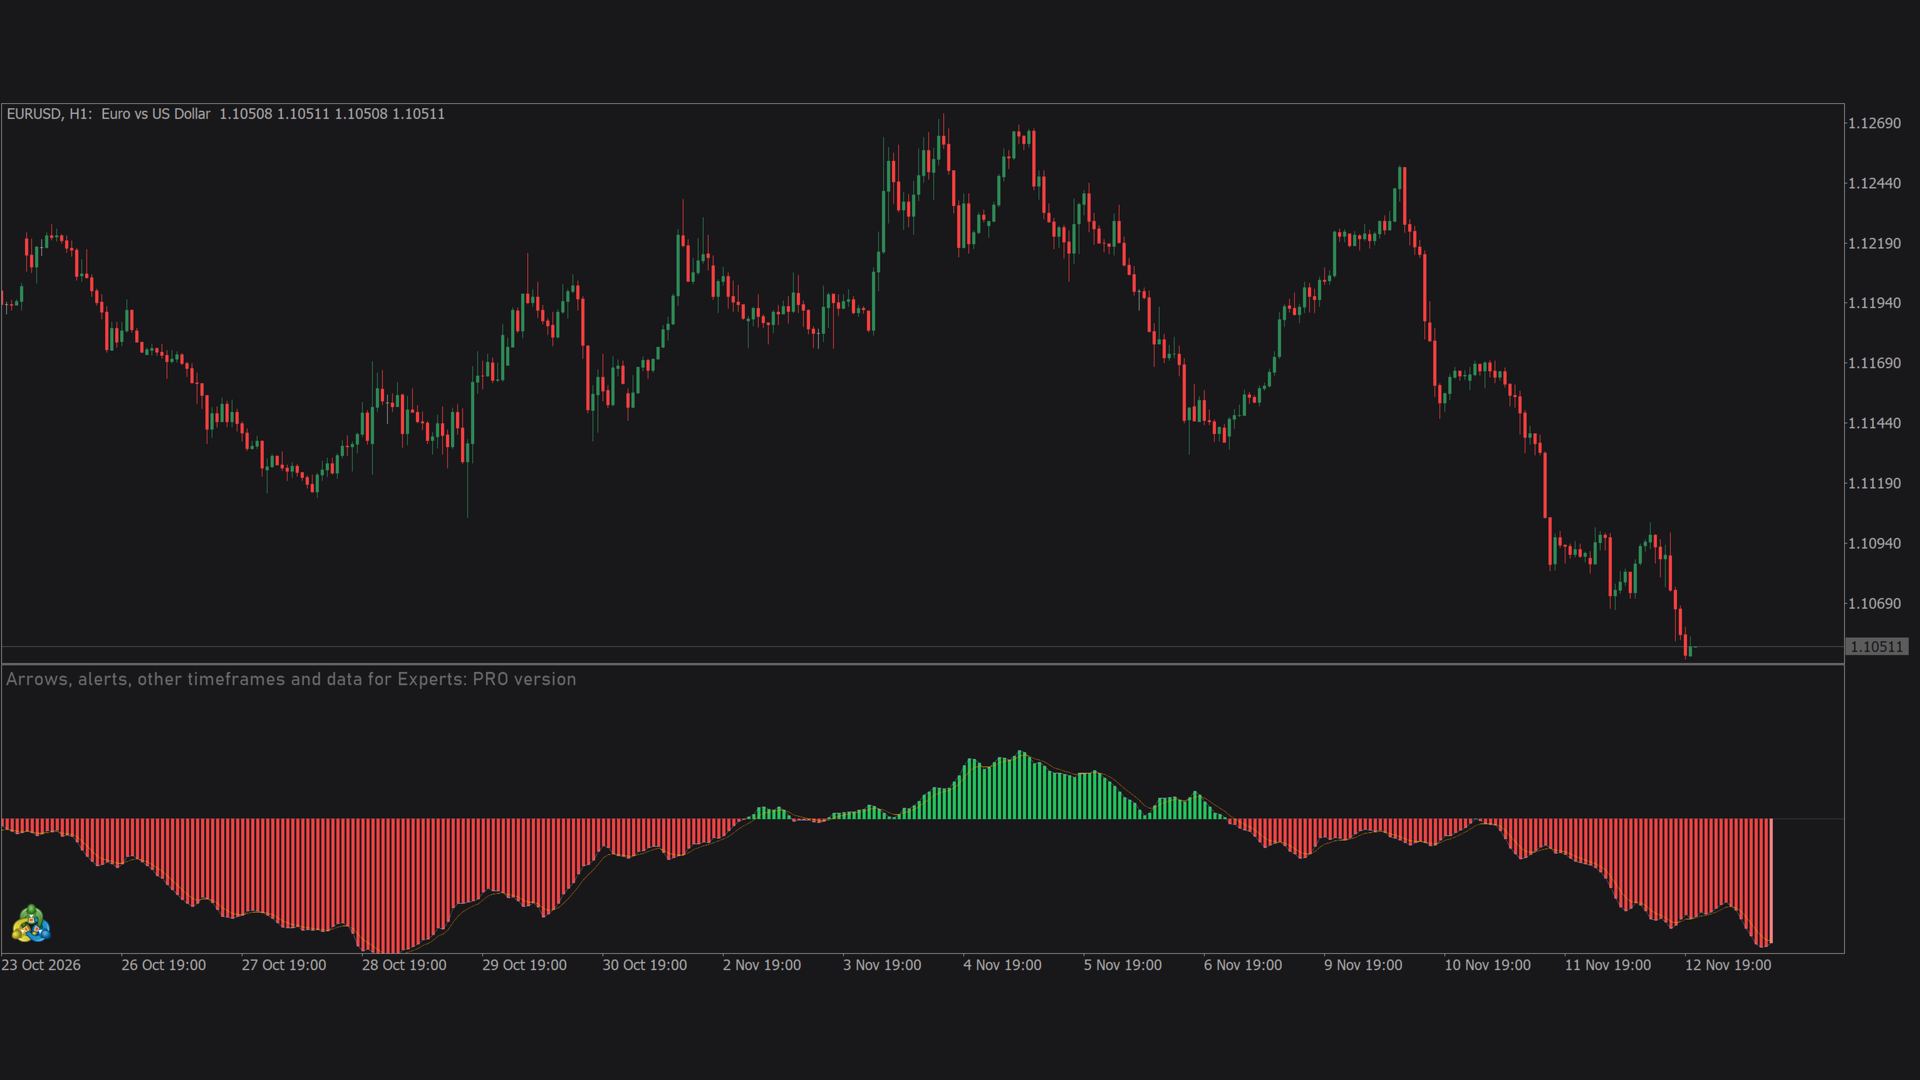
JET Volume Flow PRO shows, in a separate window, how much of the recent volume went into rising bars and how much into falling bars. Above zero, the flow is buying (green histogram); below zero, it is selling (red histogram). Very small price moves are ignored and unusually large volume spikes are capped, so a single bar does not dominate the reading. A signal line follows the flow, and the indicator marks on the chart when the flow turns to buying or selling, or crosses its signal line.
Signals are evaluated on the closed bar and do not repaint: in the Strategy Tester, the values of closed bars never changed. The forming bar keeps updating until it closes. It is an indicator only: it never opens, closes or changes orders.
What you see
- Flow line with a histogram: green for buying flow, red for selling flow.
- Signal line (orange) and zero line.
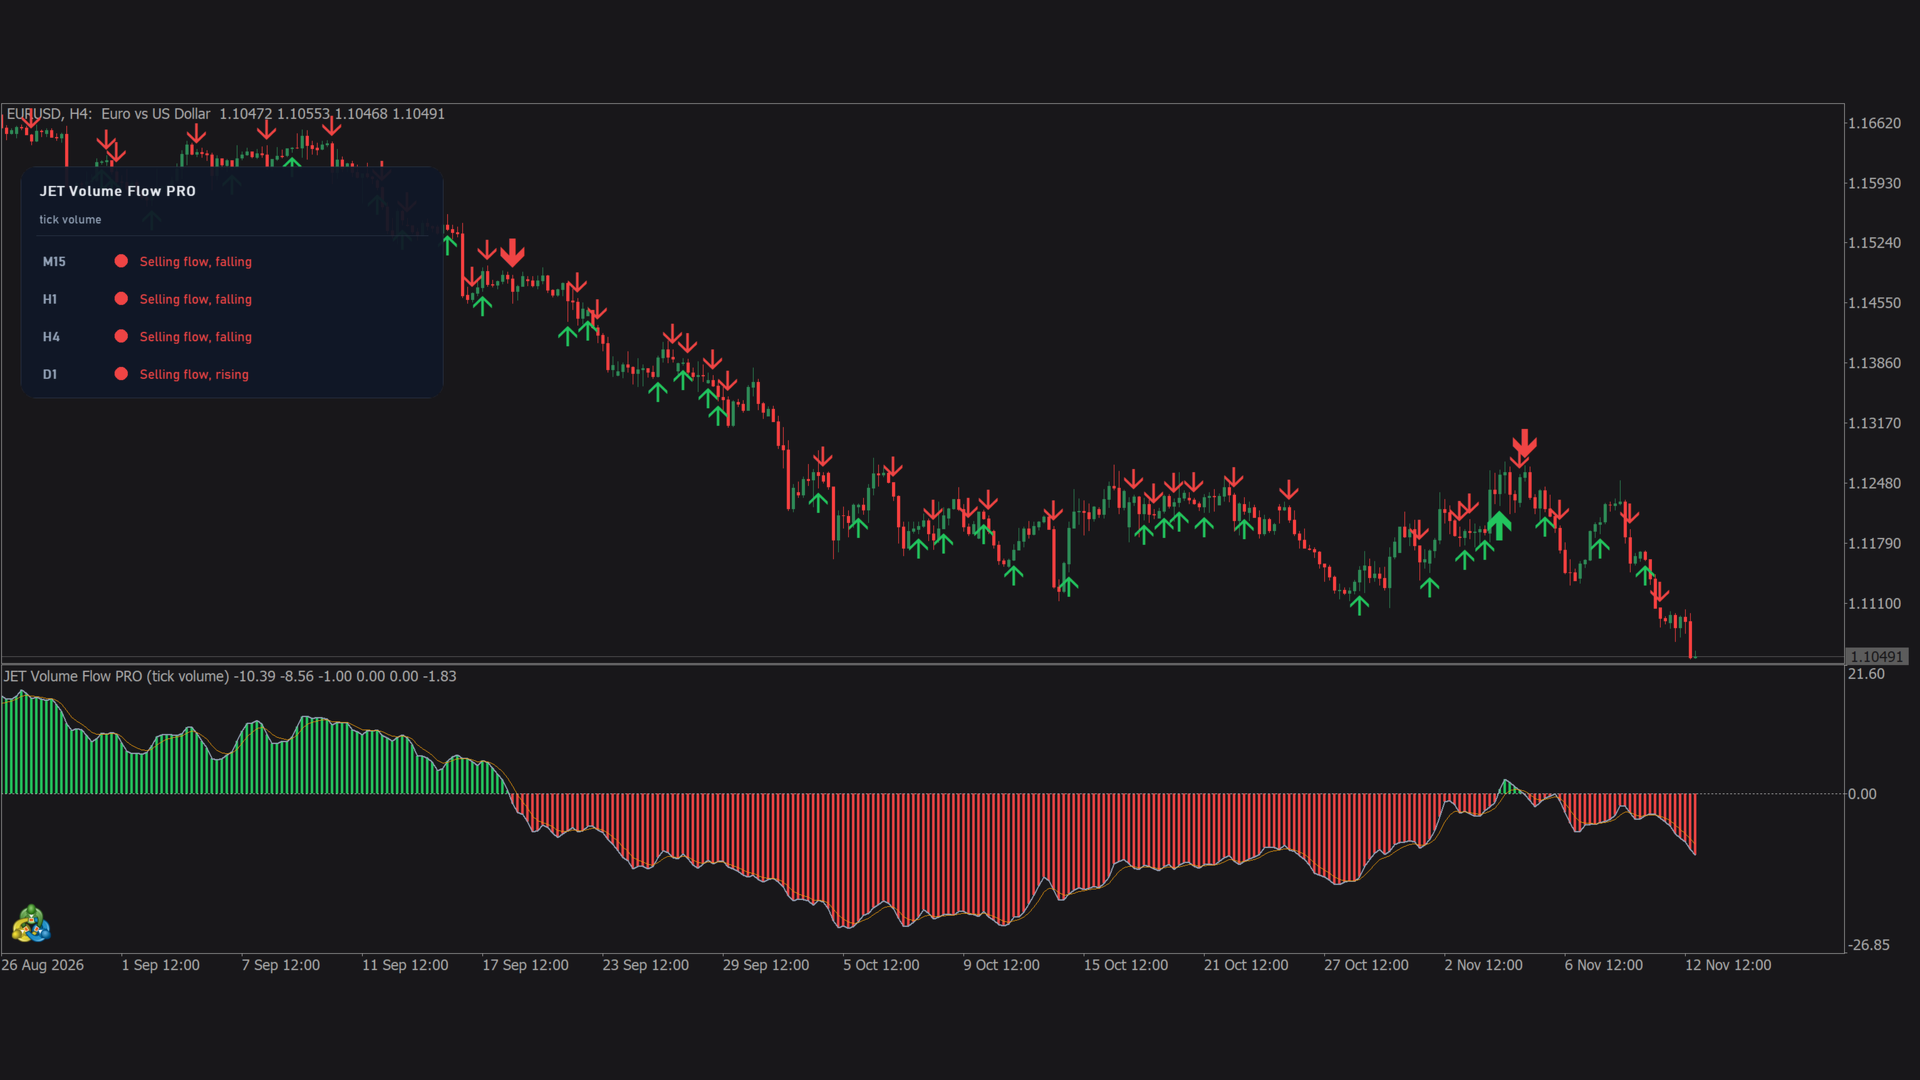
- Arrows on the main chart (default): green below the bar when the flow turns to buying, red above the bar when it turns to selling; smaller arrows for signal line crossings. Option: show them also in the subwindow.
- Signals: zero line crossing (default), signal line crossing, or both.
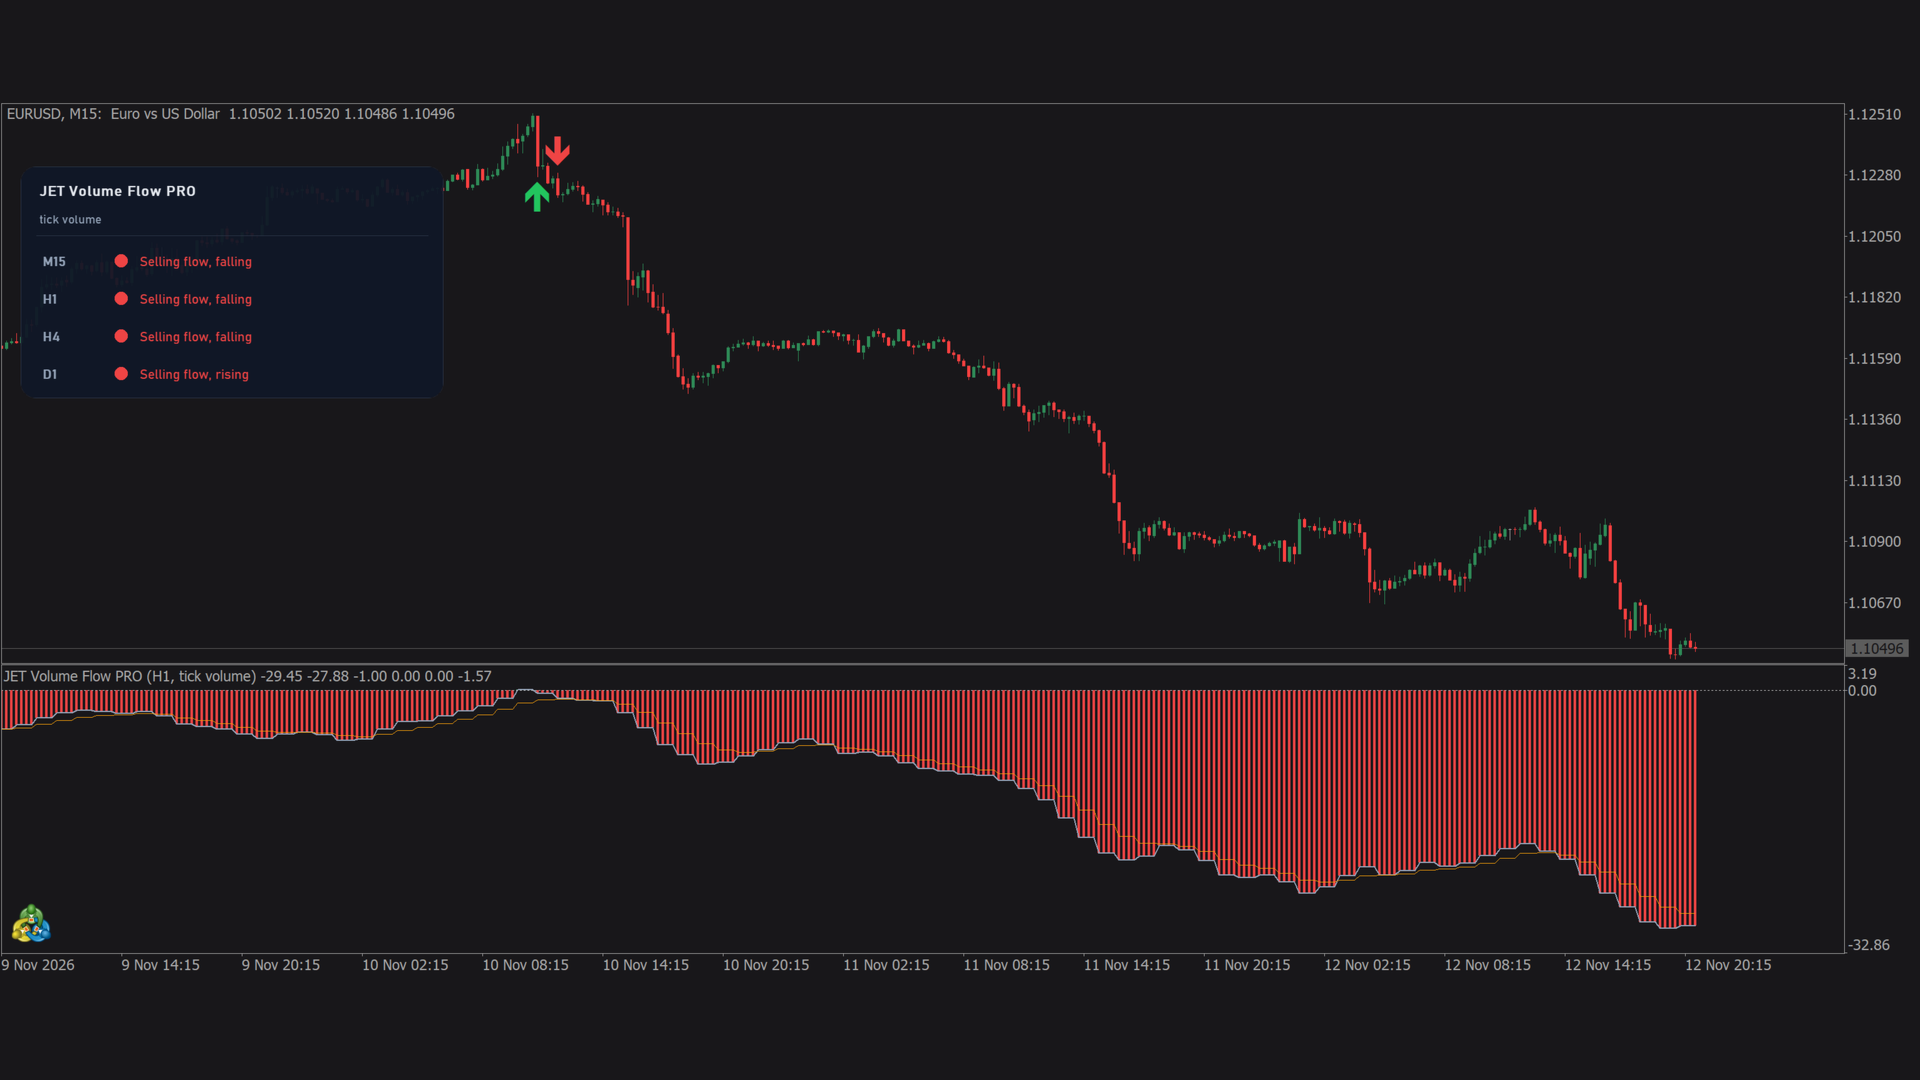
- State panel with 4 timeframes (M15, H1, H4 and D1 by default): Buying flow or Selling flow, rising or falling, and the volume in use. You can drag it anywhere on the chart.
Real or tick volume
- Automatic (default): uses real exchange volume when the broker sends it, as on B3 futures and stocks; otherwise tick volume, as on forex and CFDs.
- Or choose Real volume or Tick volume yourself. The volume in use is shown in the window title and on the panel.
Settings and timeframes
- Editable period, minimum price move, volume cut, smoothing and signal line.
- Calculation on a higher timeframe (for example H1 on an M5 chart).
- Editable colors; 5,000 bars calculated by default, and only the current bar on each tick.
Alerts on the closed bar
- Flow turned to buying, flow turned to selling, flow crossed above its signal and flow crossed below its signal, each with its own mode: popup, sound, push notification or a combination; e-mail optional.
- By default, only the alerts for the turns to buying and to selling are on.
Data for Experts (iCustom)
- Buffer 0: volume flow (positive = buying, negative = selling)
- Buffer 1: signal line
- Buffer 2: flow state (1 = buying, -1 = selling, 0 = no data)
- Buffer 3: zero line crossing (1 = turned to buying, -1 = turned to selling, 0 = none)
- Buffer 4: signal line crossing (1 = upwards, -1 = downwards, 0 = none)
- Buffer 5: difference between the flow and the signal line
- Signals are valid on closed bars (index ≥ 1); bar 0 updates with each tick.
- With a higher timeframe, the values are those of that timeframe, mapped to the chart bars.
Interface
- Dark and light themes; interface in 11 languages (automatic from the terminal language).
Works on any symbol and timeframe
- Forex, indices, stocks, metals and futures such as the B3 mini index, with any broker.
- Tested on WIN (real volume), EURUSD and US500 (tick volume).
Free version
JET Volume Flow shows the flow line with the green and red histogram, the signal line and the zero line, with editable parameters and the choice of volume.
Try the free version first: JET Volume Flow
Trading involves risk of loss. Volume flow is a reading of past volume, not a forecast: price can move against the flow after a signal. The indicator does not guarantee results.