JET Volatility Bottoms
- Indicators
-
JETINVEST
 Jet Invest develops indicators and trading tools for MetaTrader 4 and 5: order flow, volume, market structure and market overview panels for B3 (WIN, WDO and Brazilian stocks), US indices and forex.
- Version: 1.0
A histogram that highlights probable bottoms when volatility spikes, on your MetaTrader 5 chart.
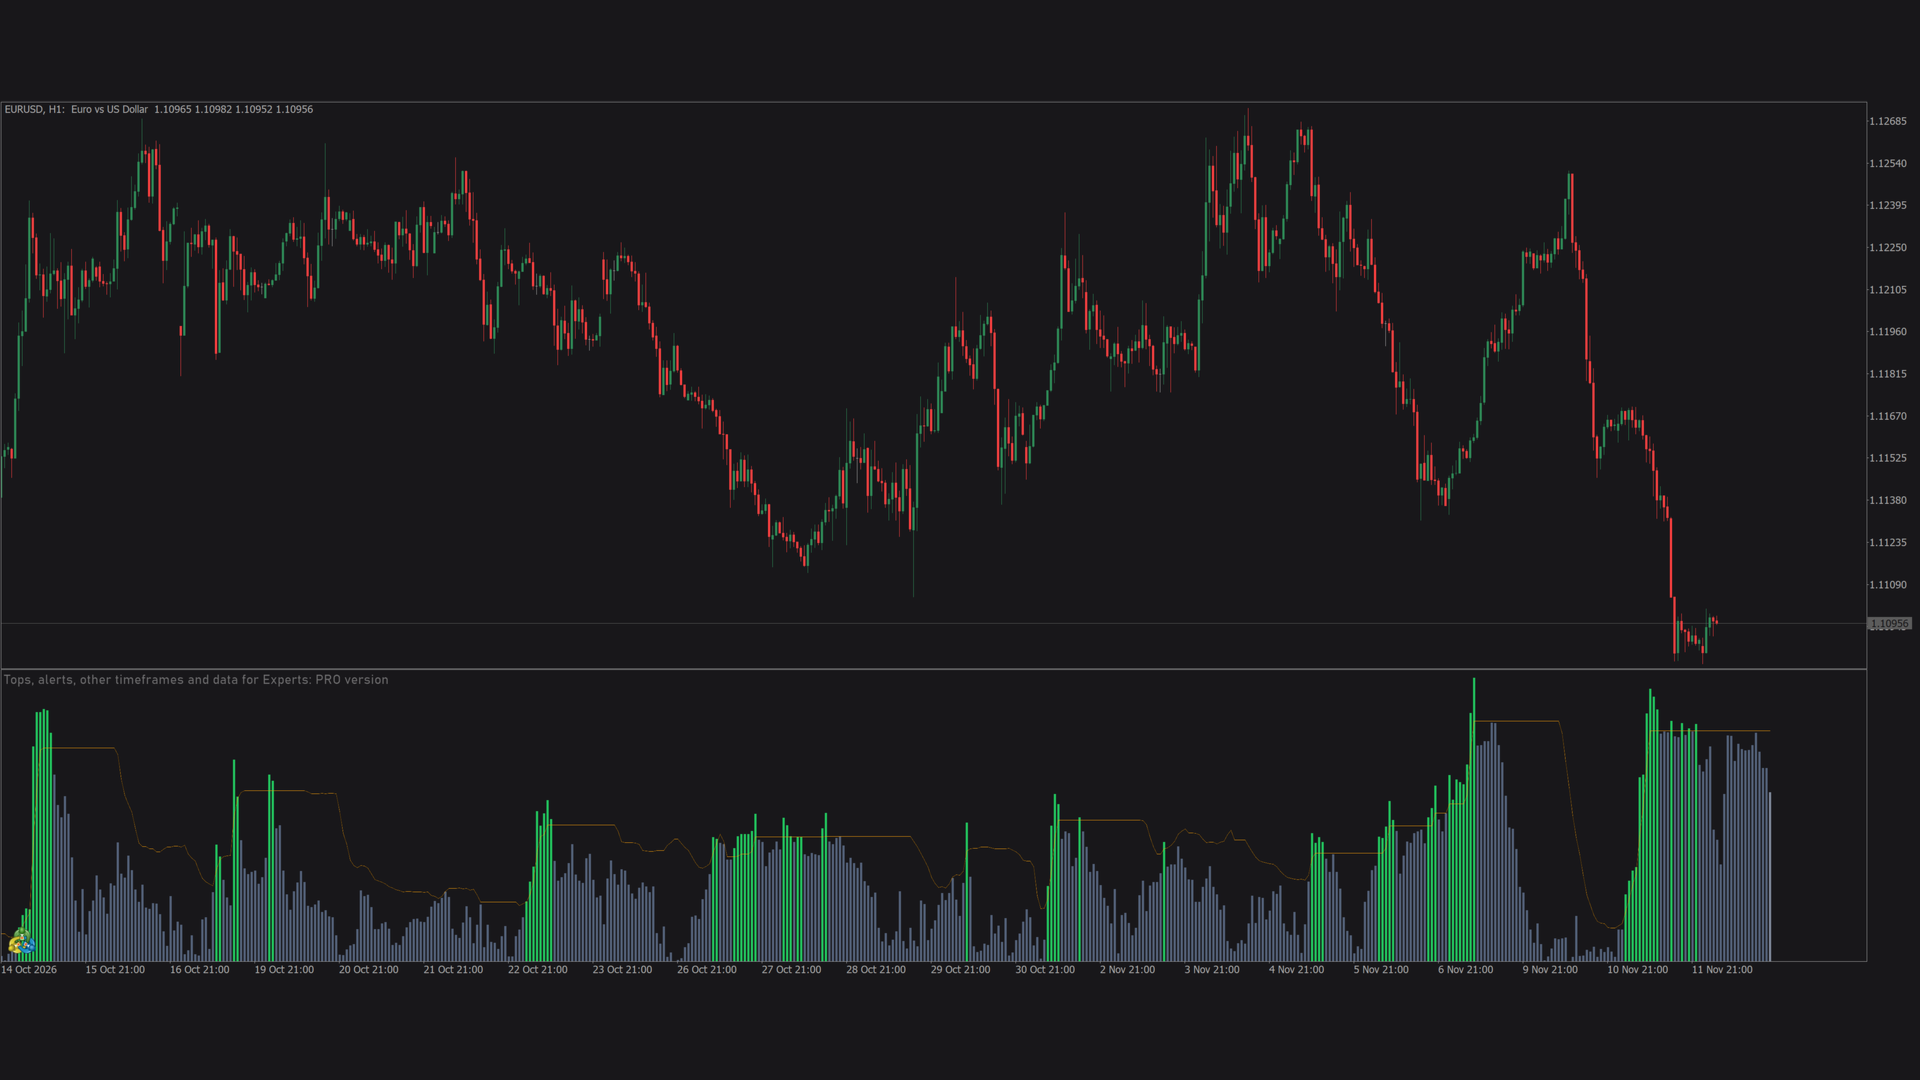
JET Volatility Bottoms shows, in a separate window, a histogram that rises when fear and volatility spike after a fall. When the spike reaches the dynamic band, the bars are highlighted in green: a probable bottom is forming.
Signals are evaluated on the closed bar and do not repaint: in the Strategy Tester, the values of closed bars never changed. It is an indicator only: it never opens, closes or changes orders.
What you see
- Histogram in a separate window, with probable bottoms in green.
- Dynamic band (orange line).
- The forming bar is shown in a lighter shade until it closes.
- Editable parameters and colors.
- Works on any symbol and timeframe: forex, indices, stocks and futures such as the B3 mini index. Tested on WIN, EURUSD and US500.
- A small note in the window reminds you that tops, alerts, other timeframes and data for Experts are in the PRO version.
Not in the free version
- No alerts of any kind (popup, sound, push notification or e-mail).
- Data for Experts: PRO version.
Want more?
JET Volatility Bottoms PRO adds: probable tops (mirrored histogram in red); confirmed bottoms and tops; optional trend filter; arrows on the main chart; calculation on a higher timeframe; state panel with 4 timeframes; dark and light themes; interface in 11 languages; alerts by popup, sound, push notification and e-mail; data for Experts.
Full version: JET Volatility Bottoms PRO
Trading involves risk of loss. A probable bottom or top is a reading of volatility, not a forecast: price can keep moving in the same direction after a signal. The indicator does not guarantee results.