Correlation Exposure Matrix MT5
- Indicators
- Version: 1.60
- Activations: 20

Three trades opened, three trades losing at the same time. That is usually not bad luck.
If the symbols you traded normally rise together and fall together, they were always going to lose together. It looks like the risk was spread out. In practice the same trade was taken three times.
The point of diversifying is that when one position loses, another has a chance to win. If the symbols move as one, that chance does not exist.
This panel does one thing: it turns the positions you currently hold into a count of genuinely different trades.
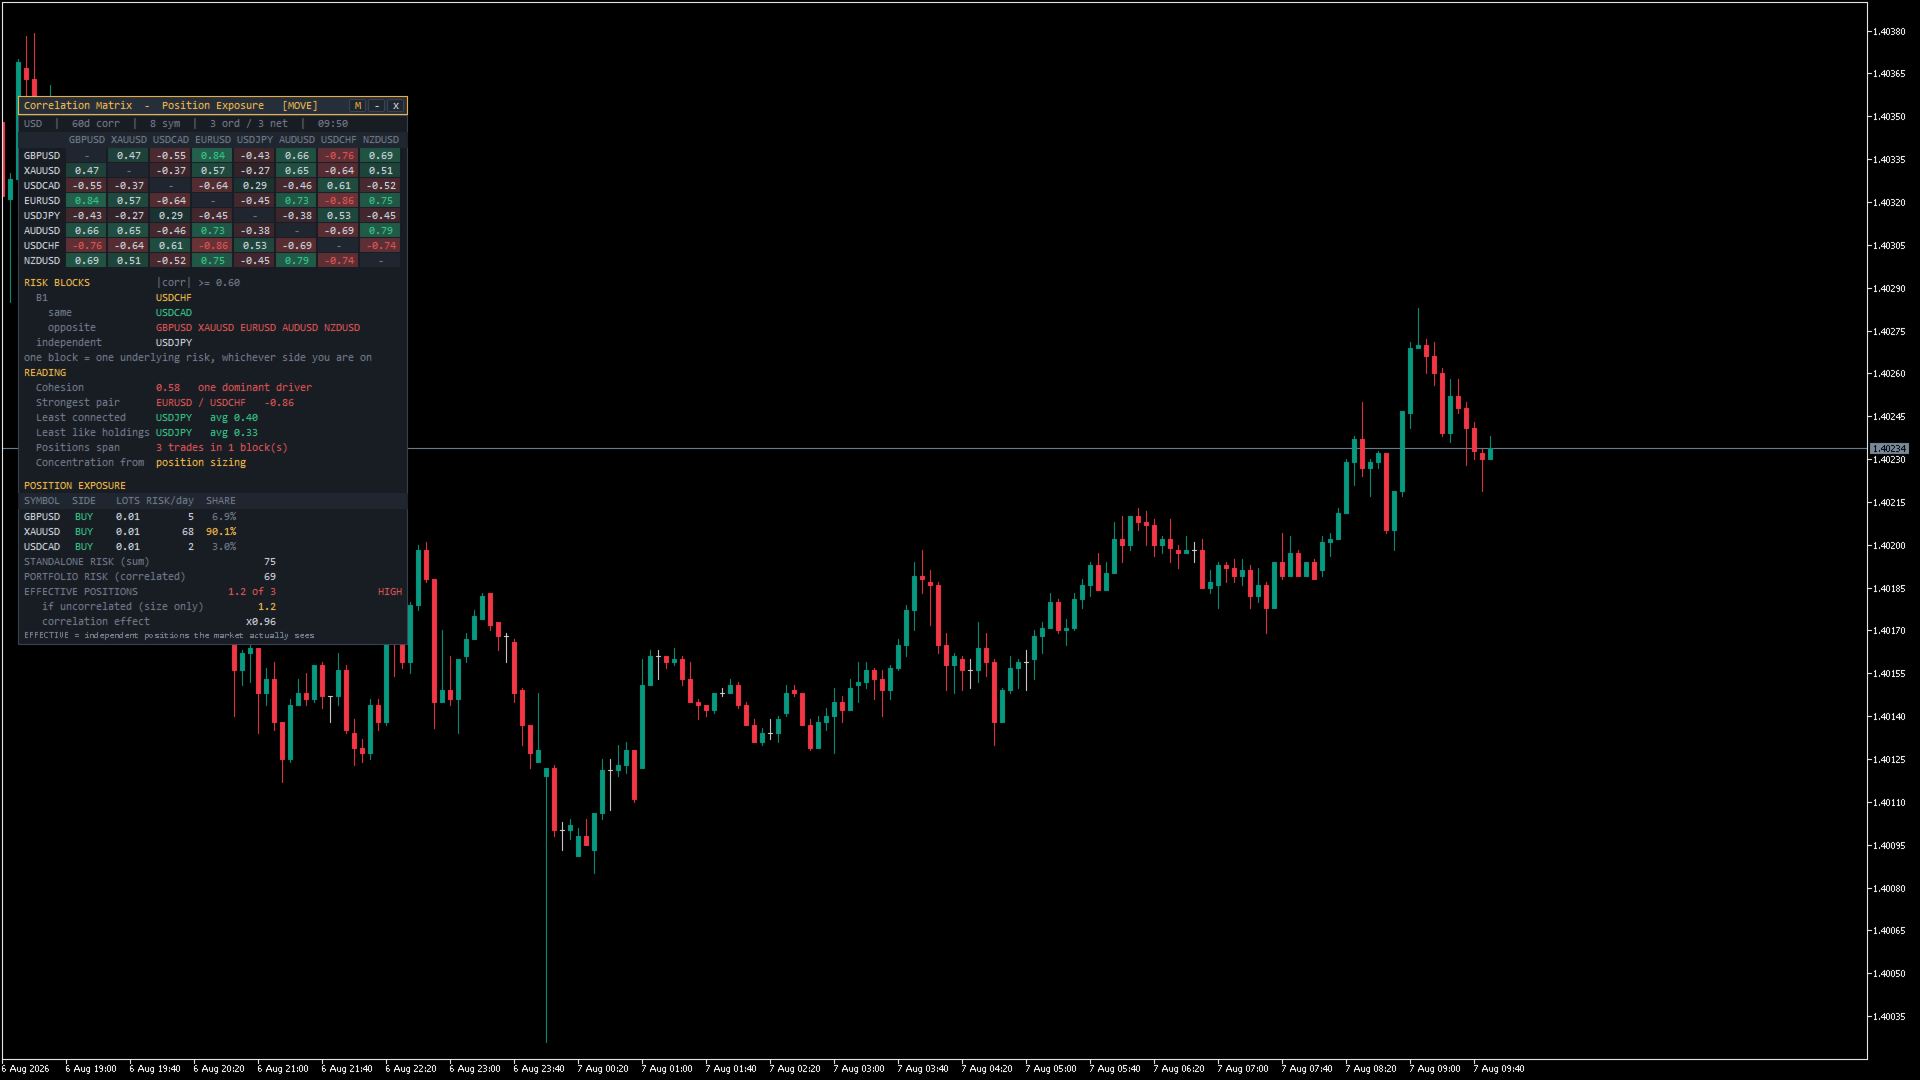
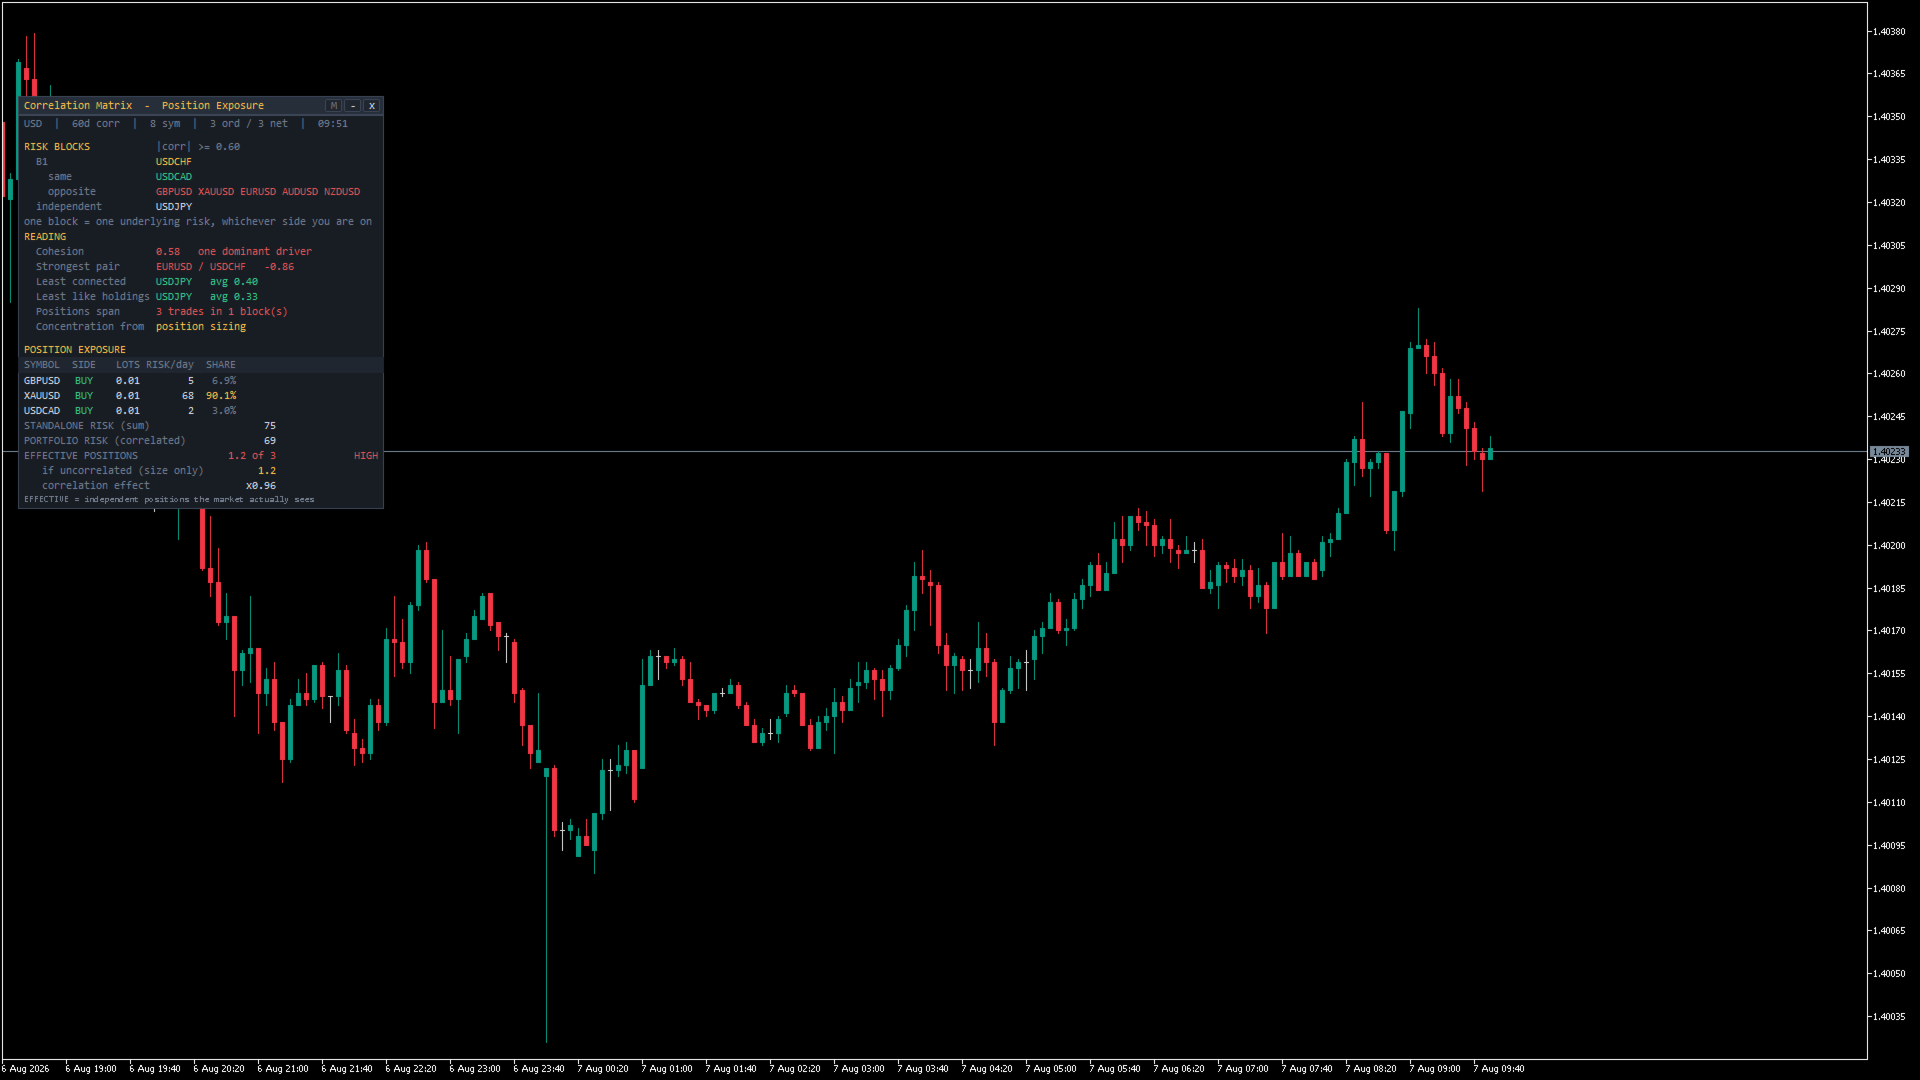
EFFECTIVE POSITIONS 1.2 of 3
Three tickets open, worth about 1.2. The other 1.8 diversified nothing; they only made the position bigger.
When to use it
Before entering: you want to add a trade, so check which symbol would actually make it a second trade.
While holding: see whether the open tickets are the same risk, and whether to trim.
Afterwards: when a loss is larger than expected, the reason is often here.
A worked example
Say you bought GBPUSD and now want to open a second trade.
The RISK BLOCKS section has grouped the symbols like this:
B1 USDCHF
same USDCAD
opposite GBPUSD XAUUSD EURUSD AUDUSD NZDUSD
independent USDJPY
This says that every symbol in B1, whether it sits on the same or the opposite line, is driven by one and the same thing. USDJPY stands alone under independent, meaning it has little in common with the rest.
Your GBPUSD is inside B1. So:
Buy EURUSD as well? Both are in B1, so this enlarges the GBPUSD trade. The panel will read 1.1 of 2 — two tickets, one trade.
Buy USDCHF? It sits on the other side of B1 and moves against you. That is a hedge: you lose less when it goes wrong, and you gain less when it goes right. The position has been halved, not doubled, and it is still one trade.
Trade USDJPY? It is under independent and has little to do with GBPUSD. The panel will read 1.7 of 2 — this really is a second trade.
One sentence is enough to remember: to add size, pick inside B1; to add a genuinely separate trade, pick from independent.
Check before you enter
You do not have to open anything to see the result. Type the trade you are weighing into Extra positions:
USDJPY,SELL,0.10
The panel lays it on top of what you already hold and recalculates at once. While that field has anything in it, the information line turns amber and adds the word planned, so a simulation is never mistaken for your real exposure. Empty the field to go back.
Reading every number on the panel
The correlation grid
Each cell holds the relationship between two symbols, from -1 to +1.
Near +1: they move almost identically. Holding both in the same direction is adding size.
Near -1: they move almost exactly opposite. Holding both in the same direction is hedging. Note that this is still one risk, not diversification.
Near 0: little relationship. This is where diversification comes from.
When the absolute value passes 0.70, which is adjustable, the number itself is coloured, so strong pairs stand out without reading every cell. Cells without enough data show three dots rather than an invented number. The M button on the title bar hides the grid.
RISK BLOCKS
B1 is followed by the symbol that represents the group. The same line holds symbols moving with it, the opposite line holds those moving against it. By default a relationship above 0.60 places a symbol in the group.
The independent line holds symbols that reach 0.60 with nothing. It is usually the most useful line on the panel, because it identifies the only symbols in the list capable of providing real diversification. If that line is empty, your whole watchlist is a single risk.
READING
Cohesion is the average relationship across every cell. It measures how alike the basket is as a whole.
Above 0.55, shown in red: one dominant driver. Almost everything here is moved by the same factor, so no choice inside this list will diversify much. Either change the list or accept holding one trade.
Between 0.35 and 0.55, in white: mixed drivers. Several forces at work, and a good choice can diversify.
Below 0.35, in green: loosely linked. The symbols are fairly independent of each other.
Strongest pair is the most closely linked pair and its value.
This is not the same information as Cohesion. Cohesion is an average across the whole set, Strongest pair is a single extreme, and the two can disagree completely. A Cohesion of 0.30 says the set is well spread, but if one pair reads 0.95, those two symbols still must not be held in the same direction at once. One answers whether this list can diversify at all; the other answers which two must never be paired.
A large positive value: the pair least suited to being held together in the same direction.
A large negative value: the most effective hedge available, useful when you want to reduce exposure.
Least connected is the symbol with the lowest average relationship to the rest, followed by that average.
The smaller this value, the more independent that symbol is, and the better a candidate it is for diversification. Below 0.30 is genuinely independent. Above 0.60 means even the most independent symbol here is not independent, and the list itself needs rebuilding.
Least like holdings appears only when you have positions. It names the symbol, among those you are not holding, with the lowest average relationship to what you already hold.
The difference from Least connected: that one is measured against the whole grid, this one is measured against your actual positions. They are often the same symbol, but not always. When you are about to add a trade, this is the line that matters.
Positions span shows how many risk groups your positions cover, written as n trades in m block(s).
m equals n: every position sits in a different risk group. This is diversification done properly.
m below n: shown in red. Several positions are crowded into one group. This is the most direct signal of over-concentration.
m equals 1: everything is riding on one risk, however many tickets are open.
Concentration from names the main cause directly: position sizing, correlation, or both equally.
position sizing: the problem is lot size, one position carries too much of the risk. Adjusting lots will fix it.
correlation: the problem is that the symbols are too alike. Adjusting lots will not help; the symbols have to change.
both equally: the two causes contribute within 0.15 of each other.
POSITION EXPOSURE
The table lists each position.
RISK/day is what that position typically moves in a day, one standard deviation, in your deposit currency. It is not a stop loss and not a worst case. It is the ordinary daily swing.
SHARE is that position's part of the total risk. Above 50 percent it changes colour, because a single dominant position is itself a form of concentration: even with no relationship between the symbols, you are effectively trading only that one.
Three summary lines follow.
STANDALONE RISK is the plain sum of the individual risks, which is what you face if every symbol moves against you at once. It is the worst case.
PORTFOLIO RISK is the real figure once the relationships between symbols are taken into account. It is always the smaller of the two, and how much smaller is exactly what diversification is contributing.
The ratio between them sets the label on the right:
0.85 and above: HIGH, in red. Almost no diversification.
0.65 to 0.85: ELEVATED, in amber.
0.40 to 0.65: MODERATE.
Below 0.40: DIVERSIFIED, in green.
A single position shows SINGLE, since there is nothing to compare.
EFFECTIVE POSITIONS is the conclusion, and its ceiling is the number of positions you hold.
With three positions the best possible reading is 3.0, three independent risks, and the worst is 1.0, three tickets that are really one. The further the number sits from your ticket count, the more you are repeating the same bet.
The last two lines explain why that number is low. Multiplied together they give exactly the effective count, so they can be read as two separate deductions.
if uncorrelated is the effective count with all relationships removed, so it reflects lot sizes only.
Equal to your ticket count: the positions are similar in size.
Clearly below it, coloured when it falls under 60 percent of the count: one position is large enough to drown the others. Three positions reading 1.2 means one of them holds most of the risk.
correlation effect is the contribution of the relationships between symbols.
Equal to 1.00: the symbols are largely unrelated, no deduction.
Below 0.90 in amber, below 0.70 in red: the symbols are too alike, and this is the main problem.
Above 1.05 in green: the positions are partly hedging each other, so the total risk is below the sum of the parts.
Read separately, they tell you what to do: a low if uncorrelated means adjust lot sizes, a low correlation effect means change symbols. These are different problems, and the wrong remedy will not improve anything.
How it is calculated
For those who want the detail: correlation is the standard coefficient on logarithmic daily returns. The two daily series are aligned on bar open time before the calculation, because holidays and CFD sessions leave symbols with different numbers of daily bars, and pairing them by position in the array would produce wrong values.
The risk of each position is lots x the real value of one lot x the daily movement of that symbol. STANDALONE is the sum of those amounts, PORTFOLIO is the correlation weighted combination, and EFFECTIVE is the square of their ratio.
What it does not do
It does not open, modify or close orders, and it produces no buy or sell signals.
A long and a short of equal size on the same symbol cancel out. They carry no directional risk and stay out of the calculation, but they are listed separately rather than disappearing quietly. In the MetaTrader 4 version, pending orders carry no exposure until they are filled.
Settings
Symbols: which symbols to compare, whether to pull in held symbols automatically, and how many to show, up to twelve.
Calculation: correlation period, minimum number of daily bars, highlight threshold, grouping threshold.
Positions: read the account, or enter them by hand.
Appearance: position, colours, font. Every dimension follows the font, so the whole panel scales when you enlarge the text.
Requirements
Symbols must appear in Market Watch first. The MetaTrader 5 version adds them itself; in the MetaTrader 4 version press Ctrl+U to show them. The panel can be attached to any chart and any timeframe, since all calculations use daily data.
Relationships between symbols are not fixed. Two symbols that used to move together can separate. The panel shows what actually happened over the period you selected.
Disclaimer
This is an analysis and information tool. It does not open, modify or close positions and does not produce trading signals. Please test it on a demo account and manage your own risk.
If you find it useful, a rating or review is appreciated. For questions or feature requests, please use the Comments section below.