Triple Screen Impulse System MT4
- Indicators
- Version: 1.60
- Activations: 5

Triple Screen Impulse System is a chart-window indicator that implements the three-screen structure described by Alexander Elder, using the Impulse System on two periods and the Force Index on a third. It draws arrows and nothing else. There are no lines, zones or trade levels on the chart, because the indicator answers one narrow question: at this moment, do all three screens permit the same direction.
The first screen is the tide. The Impulse System runs on a period higher than the chart period and reports one of three states. Green means the exponential moving average and the MACD histogram are both rising, red means both are falling, and blue means they disagree. In Elder's original description this screen works as a censorship layer. It does not tell you to trade, it tells you which direction you may not trade. A green tide removes short trades from consideration and a red tide removes long trades.
The second screen is the wave. The Force Index runs on an intermediate period and locates a pullback against the tide. Inside a green tide, the Force Index turning negative marks the counter-trend move that precedes a with-trend entry. Inside a red tide the mirror condition applies. This screen arms the setup and does not produce an arrow by itself.
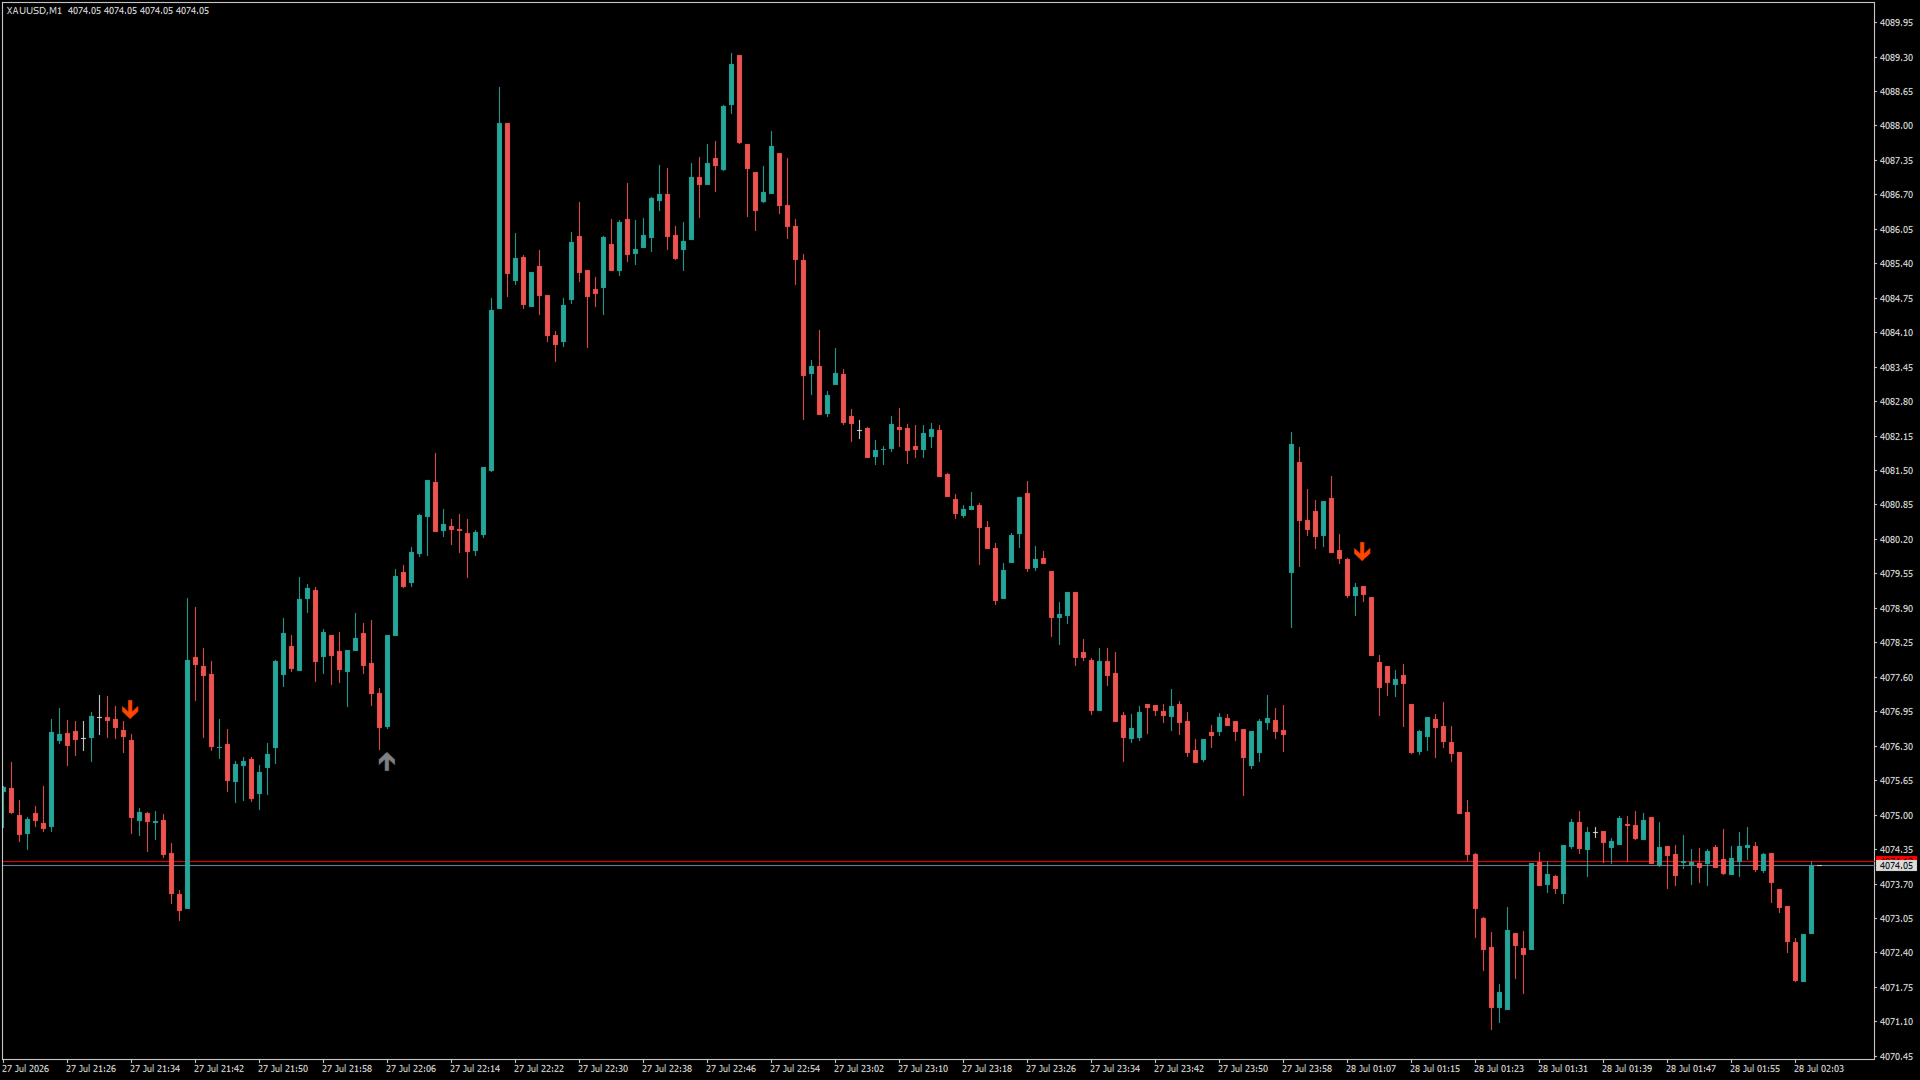
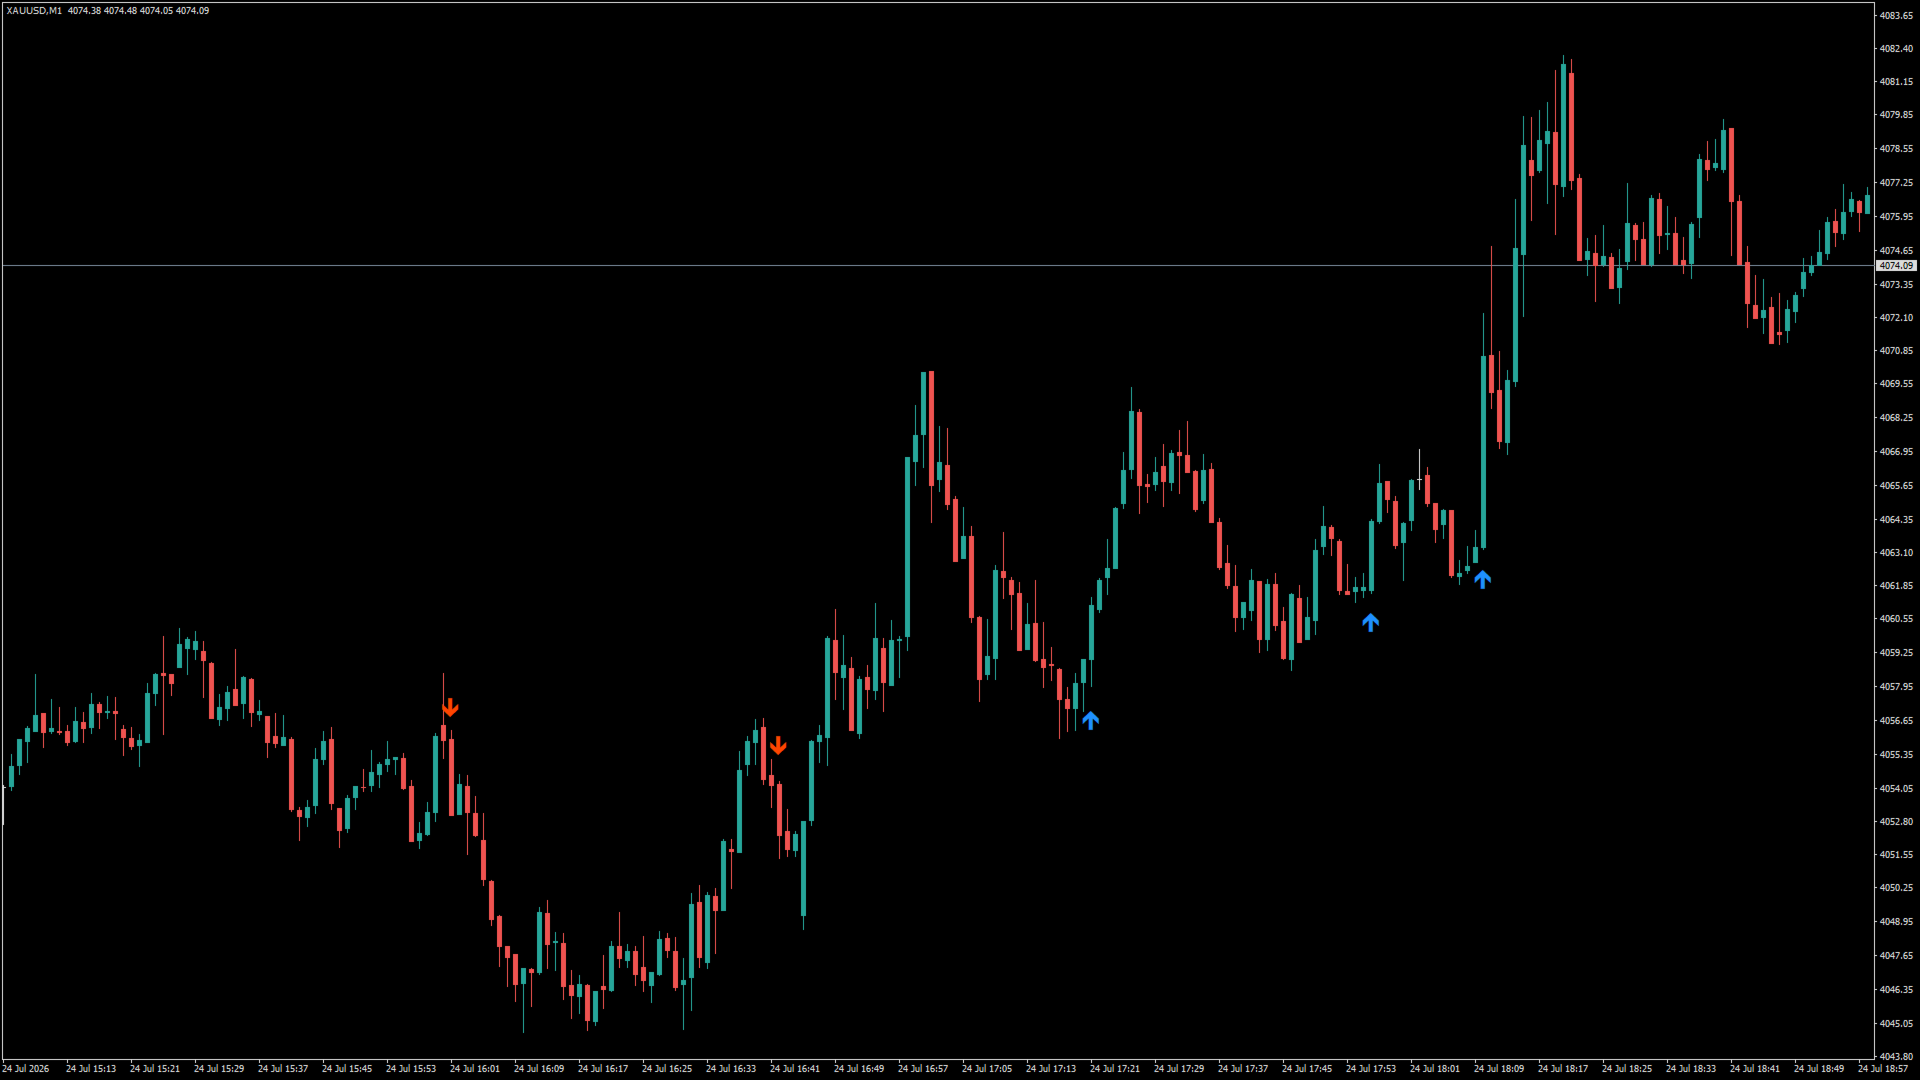
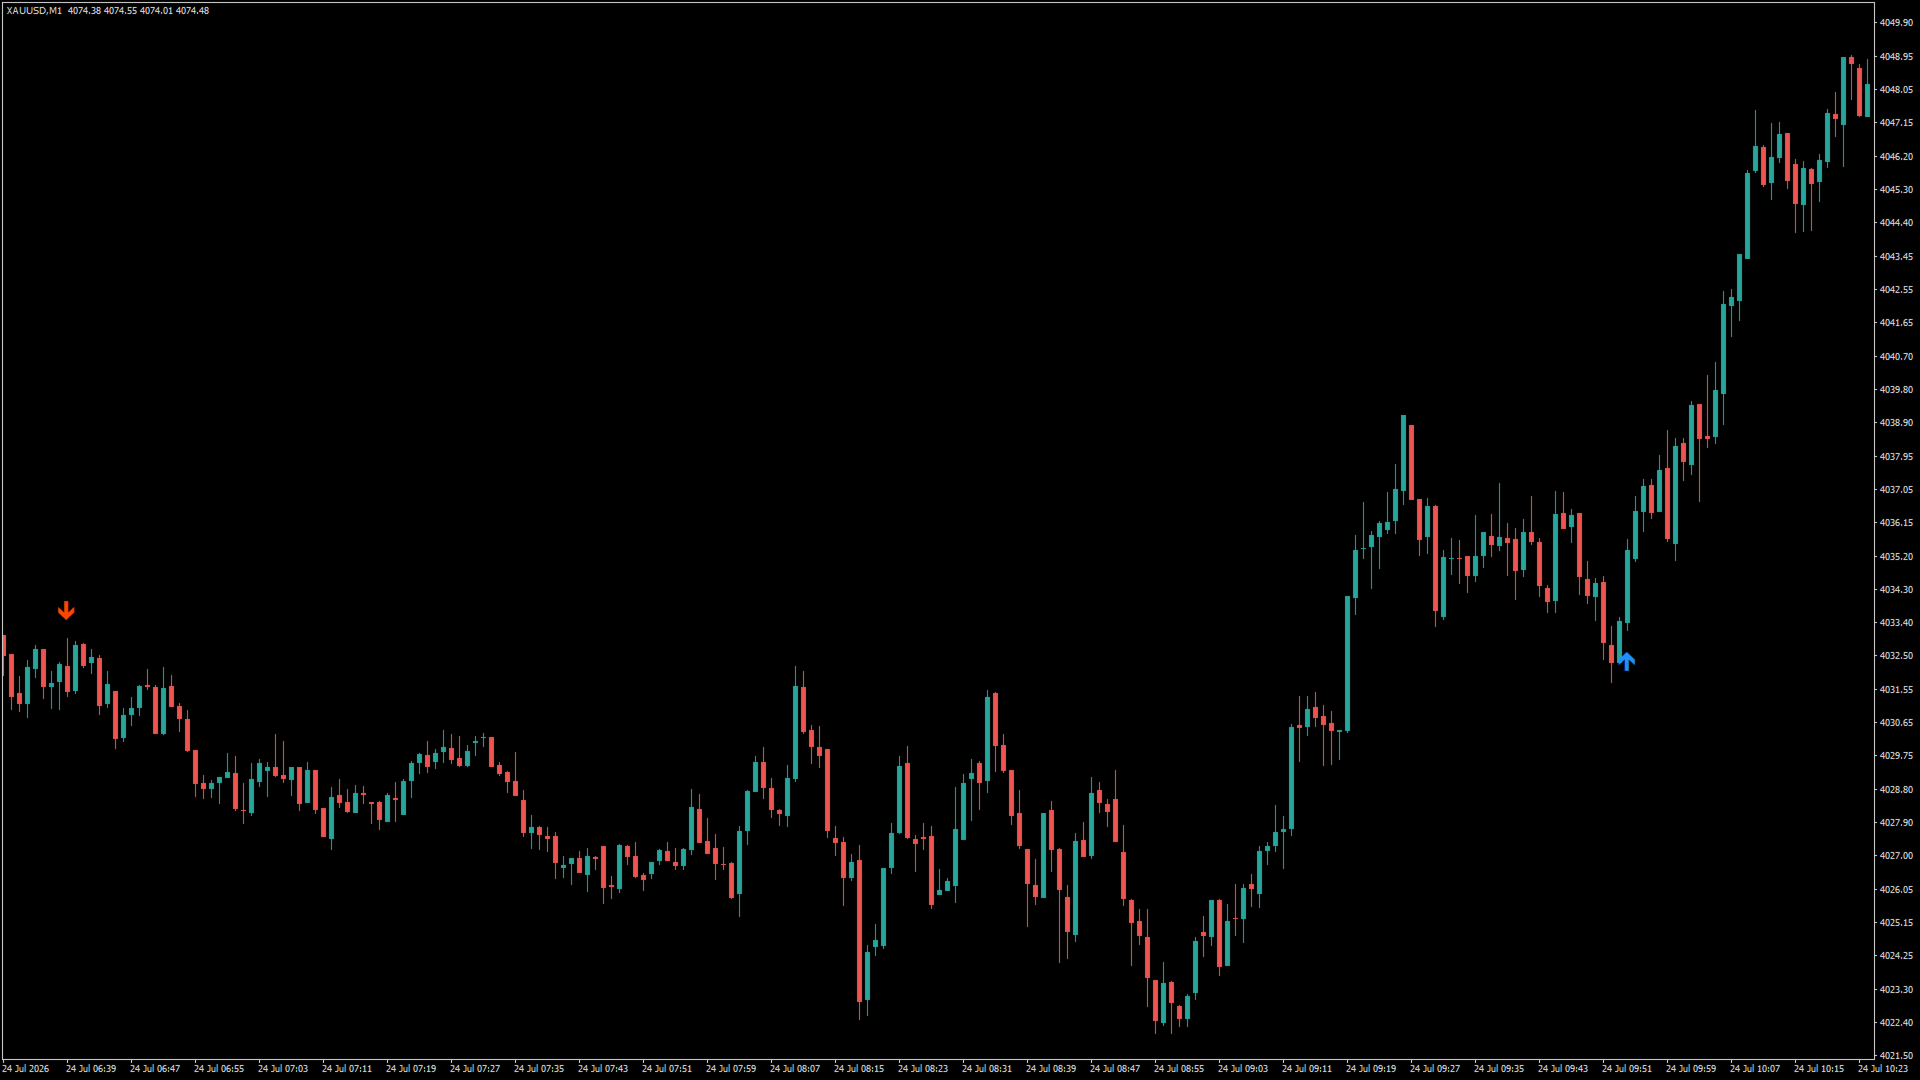
The third screen is the chart period. Once a setup is armed, the Impulse System on the chart period changing into the direction of the tide prints the arrow. The arrow is therefore a statement that the tide, the wave and the current period have lined up, evaluated on closed bars.
An arrow is not an instruction to open a position, and this indicator does not calculate entry prices, stop levels or targets. Following Elder's own framing, the arrow narrows the field. It says that if a trade is taken around this point, the three screens agree it should be a long, or a short, and that the opposite direction is currently excluded. Whether to act at all, where to place the order, where the stop belongs and how large the position should be remain entirely the trader's decisions. Used this way, the indicator behaves as a filter over discretionary judgement rather than as a source of trade signals.
Arrows appear in two forms. A blue or red arrow marks a signal where the tide colour had already persisted for the number of closed higher-period bars set in the trend confirmation setting. A grey arrow marks a signal that fired before the tide colour had persisted that long, meaning the higher-period trend was still young when the three screens agreed. Setting the trend confirmation value to zero disables the distinction and draws every signal in the standard colours. Alerts on grey arrows are controlled by a separate switch.
Every stage is evaluated on closed bars. Bar zero is still forming and its Impulse colour can change repeatedly before it completes, so it is never used. Cross-period lookups resolve to the newest bar of that period that had already closed at the moment the signal was taken, so the arrows shown on history correspond to what the indicator would have produced in real time rather than being reconstructed with information that arrived afterwards.
Period selection follows Elder's structure. Choose the entry period first, since that is the chart you are working on. Set the wave period to roughly four or five times the entry period, and the tide period to roughly four or five times the wave period. On a five minute chart that gives a twenty or twenty five minute wave and a one or two hour tide. Each screen's period is set independently of the chart period, and the list reaches beyond the platform's standard set, which makes the classic Elder ratios available without changing the chart you work on. MetaTrader 4 carries M1, M5, M15, M30, H1, H4 and D1, so M2, M3, M4, M10, M20, M25, M40, M45, H2, H3, H6 and H8 are synthesized from the one minute series.
The two components behind these screens are also published separately as free indicators, under the names Impulse System MTF and Force Index MTF. Traders who want to see the underlying colouring and the Force Index readings on their own charts, or who prefer to examine how each screen behaves on its own before using the combined tool, can search for those names and download them. One difference is worth noting: the multi-timeframe selection in those two free indicators covers only the standard period list offered by the platform, so the intermediate periods this indicator synthesizes are not available in them.
The remaining settings cover the Impulse and Force Index lengths, how many chart bars a setup stays armed before it expires, whether the tide must still agree at the moment of entry, a long only or short only filter, how many bars of history to scan when the indicator loads, and arrow appearance. An option limits the indicator to one arrow per contiguous tide colour run for traders who prefer fewer marks on the chart. Alerts can be delivered as a terminal popup, a sound, an email or a push notification. The four arrow buffers are exposed so that an Expert Advisor can read the signals through iCustom.
Costs deserve attention with this method. Because the arrow marks a direction rather than a price, the distance to a sensible stop is set by the market structure around the signal, and on very short periods the spread can account for a large share of that distance. Working on higher periods first is a reasonable way to begin.
Disclaimer: this is an analysis tool. It does not open, modify or close positions, and it makes no forecast of future prices. Test it on a demo account, form your own view of whether the method suits your instrument and period, and manage your own risk. This is an independent implementation of a publicly described method and is not affiliated with, authorised by or endorsed by the author of that method.
If you find this indicator useful, a rating or review is appreciated. For questions or feature requests, please use the Comments section of this product page.