SMC Market Structure with FVG and OB
- Indicators
-
Rajesh Kumar Nait
 Hi, I'm Rajesh, a MQL Developer with a B.Tech in Information Technology. With over 12 years of programming experience, I've transitioned from being a PHP developer, specializing in web development, to a full-time MQL5 programmer and crypto trader. Having expert level experience in coding EA related
 - Version: 1.3
- Updated: 9 August 2026
- Activations: 8
An indicator that marks swing points based on advanced fractal logic, break of structure and change of character on the chart, and shows the current trend for ten timeframes on a control panel.
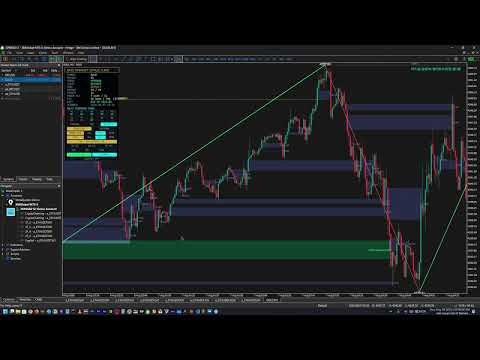
MC Market Structure is an analytical indicator for MetaTrader 5. It reads the price history on your chart and marks the points where the market makes a new high or a new low, where structure is broken, and where the direction changes. All drawings are placed on the chart itself, and a panel in the corner keeps the current reading in one place.
It is a reading tool that shows how price has moved, so you can make your own decisions.
How it reads the market
The market is described in three states: uptrend, downtrend and consolidation. The indicator follows the sequence of swing highs and swing lows to decide which state is active.
When price closes beyond a protected swing point in the direction of the existing trend, the move is marked as a break of structure and labelled BOS. When price closes beyond a protected swing point against the existing trend, the move is marked as a change of character and labelled CHOCH. A dotted line is drawn from the original swing point across to the candle that broke it, so the distance between cause and effect stays visible.
Wick breaks are treated separately from closing breaks. If a wick passes a previous high but the candle body stays below it, the break is not counted. If a second wick passes above the first one while both bodies remain below the old high, that level is recorded as a new high. The same logic is mirrored for lows.
Four ways to define highs and lows
The definition of a high and a low can be changed from the inputs, so the reading matches the way you already work.
Default mode uses wick levels for the swing point and requires a candle close to confirm a break. Wick break mode accepts a wick passing the level as a valid break. Close level mode places the swing point at the closing price and requires a close to break it. Body mode works like a line chart, where the highest close forms the high and the lowest close forms the low.
What is drawn on the chart
Swing points are joined by a coloured zigzag and labelled HH, HL, LH and LL, with major turning points marked separately. Break of structure and change of character are written next to their dotted level lines. Major and minor changes of character use separate labels so the larger move is easy to separate from the smaller one.
Internal structure can be shown on top of the main structure. This is the smaller sequence of highs and lows that forms inside a larger leg, drawn in a muted colour so it does not compete with the main reading.
Order blocks are drawn from the candle that started the move. After a valid break upward, the indicator looks back across the leg and takes the lowest bullish candle as the demand zone. After a break downward it takes the highest bearish candle as the supply zone. A zone that price has not returned to is extended to the right edge of the chart. A zone that price has already touched stops at the candle that touched it.
Fair value gaps follow the same rule. A gap stays open and extends forward until price first enters it, and then the rectangle ends at that candle.
Control panel
The panel sits in the top left corner and is built from buttons you can press while the chart is live.
Structure and internal structure can each be shown or hidden. Order blocks and fair value gaps have their own buttons, and each has three filter options: all zones, only the zones price has already filled, or only the zones that remain open. Live mode can be switched off to freeze the current reading, and a refresh button recalculates on demand.
The panel also reports the symbol, the timeframe, the active trend, the selected mode, the number of swings and events found, how many order blocks and gaps are open, the last structure event with its price, and the time of the last calculation.
Multi timeframe trend
Ten timeframes are listed in the panel: M1, M3, M5, M15, M30, H1, H4, D1, W1 and MN1. Each one is shown in its own box with the trend reading for that period. Timeframes without enough history on your account are shown as unavailable rather than being given a false reading.
Calculation and performance
The indicator recalculates when a bar closes, not on every tick, so the reading stays stable while a candle is forming and the chart is not redrawn constantly.
The scanned range is set by a vertical line you can drag along the chart, by a fixed start date, or by a number of bars back from the present. Moving the vertical line recalculates the analysis from the new point, which is useful for studying a particular session or a particular move.
Inputs
Structure settings cover the high and low definition mode and the history depth.
Scan settings cover the range mode, the start time, the number of bars used when no line is placed, and whether the vertical line follows the start time.
Typography settings cover the font name for the panel, for the panel title and for the chart labels, with separate sizes for each. Fonts must be installed on your computer for them to appear. The panel is designed around JetBrains Mono, the title around Orbitron, and the chart labels around Inter, all of which are freely available. Any font already on your system can be used instead.
Display settings cover the colours used for bullish and bearish structure, break of structure, change of character, internal structure, demand and supply zones, and fair value gaps.
Questions and problem reports are welcome in the comments section of this product page.