Watch the Market tutorial videos on YouTube
How to buy а trading robot or an indicator
Run your EA on
virtual hosting
virtual hosting
Test аn indicator/trading robot before buying
Want to earn in the Market?
How to present a product for a sell-through
Technical Indicators for MetaTrader 4 - 129
The KT Risk Management Indicator provides a comprehensive overview of the profit/loss and risk management characteristics of your Metatrader account, offering valuable insights and information. It efficiently categorizes the displayed information at account and symbol levels, ensuring a clear and organized presentation of crucial data. Risk is inherent when trading the Forex market - a reality that seasoned traders acknowledge and beginners quickly realize. To succeed in this volatile market, t

The KT Trades Info indicator is useful for traders wishing to stay informed about their trading performance. This indicator provides real-time updates on the profitability of all ongoing and completed trades, enabling traders to make well-informed decisions. By incorporating key financial metrics, it provides a comprehensive picture of a trader's financial status at a glance. This means traders can monitor their performance with increased accuracy and precision, facilitating better risk manageme

The KT 4 Time Frame Trend is an invaluable forex indicator for traders seeking to identify the trend direction across 4-time frames accurately. This innovative indicator allows users to simultaneously observe and analyze price trends across four different timeframes. Whether you're a beginner or an experienced trader, this tool offers an enhanced understanding of trend dynamics, leading to improved trading strategies on your trading platform. The capability to concurrently monitor multiple timef

xTrend The trend becomes obviously! Advangtage ・The trend becomes obviusly:Connect different color and width rise line,fall line and range line to present the overall trend of the period from spefied past time to now.It's usefull for speedy discretionary trading! ・Pips can be displayed:Displaying pips to help to know how much changed in that line obviously and immediately! ・Simply to setting:Only few settings about the period,the color and width,and whether to display pips. ・Unique algorith

The "Scalper_PRO" indicator is a basement indicator in the form of two lines and signals without redrawing or lag on the chart. The "Scalper_PRO" indicator shows on the chart the best entry points along the trend. The indicator shows good results on the M1 timeframe. The signal is generated after the candle closes and appears in the form of blue and red arrows with preliminary signals in the form of dots. The "Scalper_PRO" indicator is designed for scalping. The screenshots show examples of posi

Introduction: In the fast-paced world of binary options and forex trading, having the right tools and strategies at your disposal can make all the difference between success and failure. One such tool is the BBB Black Blue Binary Option Indicator System, a revolutionary approach to trading that leverages a combination of chart patterns, moving averages, and trading volume to help traders make informed decisions. In this comprehensive guide, we will delve into the intricacies of the BBB system, e
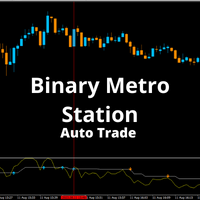
"Metro Station": Your Route to Successful Automated Trading
With "Metro Station," an avant-garde MT4 automatic trading signal that operates at the nexus of cutting-edge methods and clever algorithms, you may enter the realm of precision trading. Metro Station uses the strength of Moving Averages (MA), Relative Strength Index (RSI), Stochastic Oscillator, Momentum, and Average Directional Index (ADX) crossovers to generate well-informed trading signals. It is designed to cater to both novice tr
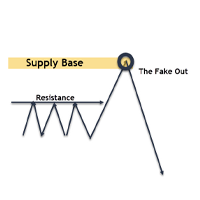
Fakeout Detector Indicator The "Fakeout Detector" indicator is a tool designed to assist traders in identifying potential false price movements (fakeouts) in the financial markets. A fakeout is a condition where the price of an asset appears to be moving in one direction but then reverses, causing losses for traders who incorrectly take positions. This indicator helps traders avoid or anticipate fakeouts by identifying key points in price movements. Indicator Output Functions: Arrow Up (Upward A

The Awesome Cross Trend Signal Indicator is a powerful tool designed to assist traders in making informed decisions in the financial markets. This advanced indicator leverages cutting-edge algorithms and technical analysis to identify potential entry points with high accuracy.
Features: 1. Precision Entry Points: The indicator generates precise arrow signals on the chart, highlighting potential entry points for various trading strategies.
2. Trend Identification: By analyzing price movem

The Levels indicator has been created to simplify the process of plotting support and resistance levels and zones on selected timeframes. The indicator plots the nearest levels of the selected timeframes, which are highlighted in different colors. It significantly reduces the time needed to plot them on the chart and simplifies the market analysis process. Horizontal support and resistance levels are used to identify price zones where the market movement can slow down or a price reversal is lik

This pass-band oscillator reduces lag in market data by filtering out high and low frequencies. It uses two EMAs (Exponential Moving Averages) with periods of 40 and 60.
Trigger points are added using an RMS cyclic envelope over the Signal line. The pass-band waveform output is calculated by summing its square over the last 50 bars and taking the square root to create trigger levels.
Buy when the pass-band crosses above its -RMS line and short when it crosses below the RMS line. The indicator

This is the Full Version, to get the free version please contact me. The free version works on “USDJPY” charts. All symbols and time frames scanner. Contact me after payment to send you the User-Manual PDF File. OVER and UNDER
Over & Under pattern is an advanced price action trading concept in the trading industry. The Over & Under pattern is more than a confluence pattern or entry technique than a trading strategy. It is a reversal pattern that is created after a significant obvious trend. It

This is the Full Version, to get the free version please contact me. The free version works on “GBPCHF” charts. All symbols and time frames scanner. Harmonic Pattern
Harmonic patterns are used in technical analysis that traders use to find trend reversals. They are considered one of the most accurate technical analysis tools, as they allow traders to predict the future price movement direction and the potential trend targets. Also, unlike many other technical tools, the number of false signals
The Real Strong Signal Signal Indicator is a powerful tool designed to assist traders in making informed decisions in the financial markets. This advanced indicator leverages cutting-edge algorithms and technical analysis to identify potential entry points with high accuracy.
Features 1. Precision Entry Points: The indicator generates precise arrow signals on the chart, highlighting potential entry points for various trading strategies.
2. Trend Identification: By analyzing price movemen

Title : UT_Bot - ATR-Based Trading Indicator Introduction : Discover the power of "UT_Bot," the ultimate trading indicator that leverages the Average True Range (ATR) to provide unparalleled accuracy in your trading decisions. If you're seeking a more reliable alternative to the Super Trend indicator, look no further. UT_Bot is your key to precision trading. Key Features : ATR-Powered Precision: UT_Bot uses the ATR to deliver accurate signals that adapt to market volatility. Enhanced Trend Detec

Title : Market Bias Indicator - Oscillator-Based Trading Tool Introduction : Discover the potential of the "Market Bias Indicator," a revolutionary oscillator-based trading tool designed for precise market analysis. If you're in search of a robust alternative to traditional bias indicators, your quest ends here. Market Bias Indicator offers unparalleled accuracy in identifying market sentiment and is your gateway to confident trading decisions. Recommended Trading Pairs : Market Bias Indicator i
ATR Stops is an indicator which shows Dynamic support and resistance lines by considering ATR value and also a multiplier. its highly effective to find out the trend direction and also is useful for using as stop loss levels. it could be used in different ways one usual way is to buy when line becomes green and sell when it becomes red. when its combined with money management rules and risk reward considerations there is good results.

Pivot Point Super Trend is another type of famous super trend indicator which is equipped with pivot points in different way. this indicator used to be available in the Trading view and this is converted from there to the MT4 language. MT5 version of the indicator is also available and you can find in my products. there are also buy/sell signals shown on the screen.

Pure Safe Trend indicator is designed for signal trading. This indicator generates trend signals.
It uses many algorithms and indicators to generate this signal. It tries to generate a signal from the points with the highest trend potential.
This indicator is a complete trading product. This indicator does not need any additional indicators.
The indicator certainly does not repaint. The point at which the signal is given does not change.
Features and Suggestions Time Frame: H1 Work

Indicador: Engulfing Candle Strategy El indicador "Engulfing Candle Strategy"! Este indicador personalizado para MetaTrader 4 identifica y resalta automáticamente las formaciones de velas "Engulfing", una poderosa señal técnica utilizada por traders de todo el mundo. ¿Qué es una vela "Engulfing"? Una vela "Engulfing" es una formación de dos velas consecutivas en un gráfico de precios. La primera vela es más pequeña y está completamente contenida dentro del rango de la segunda vela, que es sign

Line Breakouts - System for trend trading.
Contains a trend identifier that can be adapted to any chart and trading instrument using the period and smoothing function.
And a determinant of support and resistance levels. When the price is below the resistance line, open Sell trades, and when the price is above support lines - open Buy transactions. Stop loss should be placed a few points from the lines, Take Profit should be fixed after several candles (3-10-15), based on the time frame.
The indi
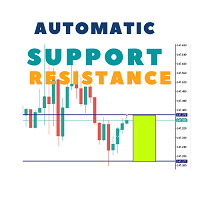
This Automatic support/resistance indicator calculates various peaks and troughs of the price action, identifies relevant levels and draws support and resistance automatically. It uses the built-in "ZigZag" indicator in Metatrader as a data source hence, very much accurate indicator. The support and resistance lines are contineusely updated as new levels and formed. The indicator has only 5 parameters to set, and mostly it can be used with the default values: The description of the settings is
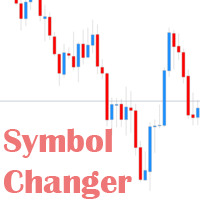
Symbol Changer This indicator makes it easier to change chart symbol, useful if a trader deals with many pairs.
User Inputs:
Indicator Custom Unique ID : Can make a custom ID for each Indicator when attach more 1 indicator. Show Profit Loss : Optional show Profit and Loss for each pair. Option Horizontal / Vertical button : Button to choose Horizontal or Vertical display. Optional display positions : Show in main Chart area and/or bottom chart. Main Pairs Preset / Own Pair : group pairs for e
The Nice Pro Signal Signal Indicator is a powerful tool designed to assist traders in making informed decisions in the financial markets. This advanced indicator leverages cutting-edge algorithms and technical analysis to identify potential entry points with high accuracy.
Features: 1. Precision Entry Points: The indicator generates precise arrow signals on the chart, highlighting potential entry points for various trading strategies.
2. Trend Identification: By analyzing price movements

Here is another version of famous Super Trend indicators which is modified by Kivanc Ozbilgic. I have get the code from Trading View and converted it to MT4 language. this is great opportunity for Trading View users who want to migrate to MT4 so can test this indicator and also make their custom EAs based on it. there are much more inputs than standard super trend also there are up/down arrows with alarms as well.

The QQE indicator is a momentum-based indicator used to identify trends and sideways. The Qualitative Quantitative Estimate (QQE) indicator works like a smoothed version of the popular Relative Strength Index (RSI) indicator. QQE extends the RSI by adding two volatility-based trailing stops. This indicator is converted from Trading View QQE MOD by Mihkel00 to be used in MT4 Version.

The SuperTrend indicator is a popular technical analysis tool used by traders and investors to identify trends in the price of a financial instrument, such as a stock, currency pair, or commodity. It is primarily used in chart analysis to help traders make decisions about entering or exiting positions in the market. this version of super trend indicator is exactly converted from trading view to be used in MT4

" Valiant Strong Trend " - Your Ultimate MT4 Signal Indicator Are you ready to elevate your trading game to new heights? Look no further than the "Valiant Strong Trend" MT4 signal indicator, your indispensable tool for navigating the complex world of financial markets. Key Features: Precise Trend Identification : "Valiant Strong Trend" employs advanced algorithms to accurately identify market trends, whether they are bullish or bearish. Say goodbye to guesswork and hello to informed trading deci
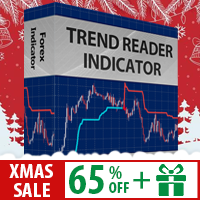
CHRISTMAS SALE — LIMITED TIME!
Get Trend Reader Indicator with a huge –65% discount AND receive Trend Matrix EA as a FREE BONUS ! Special Christmas Price: $107
(Regular Price: $297 — You Save $190!) FREE BONUS: Trend Matrix EA
A powerful multi-symbol strategy packed with advanced features, supporting 10 trading pairs — real value: $447! After completing your purchase, simply contact me and I will send you your BONUS EA immediately. Don’t miss this once-a-year opportunity! Trend Reader Indica

The PTS Divergence Finder Sell Indicator by Roger Medcalf - Precision Trading Systems.
This indicator only give Bearish - Sell Indications.
First and foremost, I have been asked many times why I did not provide a sell divergence indicator while happily providing a buy signal divergence finder for many years.
I gave the answer that sell divergences are less reliable than the buy divergences, which is still true.
Some solutions to change this were found, not by giving in to peer pressure o

Are you in search of a reliable tool to enhance your trading experience on MetaTrader 4? Look no further! "Great Safe Signal" is here to elevate your trading strategy and provide you with invaluable insights for making informed decisions. Key Features: Precision Analysis: "Great Safe Signal" employs advanced algorithms to analyze market trends and price movements with pinpoint accuracy. This ensures that you have the most precise information at your fingertips. User-Friendly Interface: We unders

PTS - Divergence Buy Finder by Precision Trading Systems
Precision Divergence Finder was designed to find market bottoms with pinpoint accuracy and frequently does so. In technical analysis, the art of picking bottoms is generally much easier than picking tops this item is designed precisely for this task. After a bullish divergence is identified then it is wise to wait for the trend to turn up before buying. You can use a 10 or 20 bar high to enter or a moving average 15-30 to be rising to ide

PTS Demand Index code by Precision Trading Systems Demand Index was the creation of James Sibbet and uses complex code to make simple work of the interpretation of volume and price as a combination. Understanding volumes is never an easy task but this beautiful piece of programming certainly makes like a lot easier. There are several ways in which this indicator can benefit traders and investors alike.
Divergences (As a Leading indicator) Having studied many technical indicators over the years

Super Trend Channels MT4 Indicator Looking for a versatile and powerful channel indicator for your MetaTrader 4 trading platform? Look no further than the "Super Trend Channels" indicator! This advanced tool is designed to help traders identify trend channels accurately, enabling you to make informed trading decisions with confidence. Key Features: Multi-Channel Support: The "Super Trend Channels" indicator supports multiple channels simultaneously. You can visualize various channel types, inclu

Enhance your trading strategies with the " MA Trend Filter " indicator for MetaTrader 4. This powerful tool is designed to help you make more informed trading decisions by effectively filtering market trends using Moving Averages (MA). Key Features: Efficient Trend Filtering: The "MA Trend Filter" uses Moving Averages to filter out noise and highlight significant market trends. It simplifies complex price data, making it easier to identify potential entry and exit points. Customizable Settings:

EZZ Elite Zig Zag is an indicator for the MetaTrader 4 terminal. This indicator traces the peak of the trend based on the market reversal, thus showing various opportunities in the financial market. EZZ Elite Zig Zag is a visual tool, intuitive, and easy to understand and use.
Test it Yourself by Downloading it for Free.
Author Paulo Rocha all rights reserved

Unlock the power of precision in your forex trading with the Precise Magic Arrow signal indicator. This versatile indicator is designed to provide you with weekly average signals for all major currency pairs, revolutionizing your trading strategy and enhancing your decision-making process. Key Features: Universal Applicability: "Precise Magic Arrow" is compatible with all currency pairs, ensuring that you have access to valuable signals across the forex market. Weekly Averages: Receive weekly

Scalper Terminal interface software is an indicator, it does not engage in automatic buy-sell transactions. This indicator shows the current trading zone where transactions can be entered when a scalping trade opportunity occurs. When there is a scalping signal, on the right side of the relevant trading pair, the Turquoise light turns on and the exact trading direction is written above it. After that, click on the Turquoise button to enter the transaction. A new tab opens. Afterwards, candle clo
Daily Monitoring : The indicator automatically calculates and displays the daily drawdown on your trading chart, allowing you to see how well you're performing on a daily basis. Risk Management : By monitoring daily drawdown, traders can better manage their risk. It helps to keep daily losses within acceptable limits. Real-Time Information : Daily drawdown is updated in real-time, providing accurate and up-to-date information about your trading performance. How to Use: Activate the "Daily Drawd

Unlock the full potential of your trading strategy with the Large Strong Signal MT4 Signal Indicator. Designed with precision and reliability in mind, this powerful tool empowers traders with invaluable insights to make informed trading decisions. Here's why "Large Strong Signal" stands out in the crowded landscape of trading indicators: Enhanced Market Awareness : Gain a deeper understanding of market dynamics through our meticulously crafted indicator. It offers a comprehensive view of price
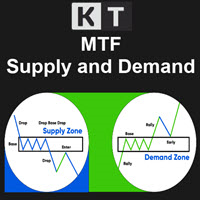
KT Supply and Demand indicator identifies and plots key supply and demand zones. It achieves this by analyzing swing points and integrating them with a multi-timeframe analysis, ensuring that only the most crucial supply-demand zones are highlighted. This advanced method highlights the regions where prices are likely to reverse, stemming from significant supply-demand zones established by recent price movements.
Features
Precision Analysis: Our refined algorithm is designed to accurately pinpo
The "Dagangduit Spread Indicator" is a versatile tool designed to provide traders with essential information about the current spread in the chart window. This indicator offers customizable features, including font parameters, display location on the chart, spread normalization, and alerts to enhance your trading experience. Key Features: Real-time Spread Display : The indicator displays the current spread in real-time on your trading chart, allowing you to stay informed about the cost of execut

Title: Unveiling the Non-Repainting XY Trend Indicator: Your Ultimate Guide to Forex and Binary Options Success
In the dynamic world of Forex and binary options trading, staying ahead of the curve is paramount. Traders are constantly on the lookout for tools that can provide them with a competitive edge, and one such powerful tool that has been making waves in the trading community is the "Non-Repainting XY Trend" indicator.
The Non-Repainting XY Trend indicator is a revolutionary trading to

Swing trading is a method in which traders attempt to take advantage of market fluctuations. They buy a security when they believe the market will rise and sell if they feel the market will fall, which, as you can imagine, is common in most trading strategies, irrespective of trading style.
The four most frequently occurring patterns in the swing trading domain are reversal, retracement (or pullback), breakouts, and breakdowns.
it work all currency pair, and work all timeframe
100% non repaint

An indicator based on candlestick patterns
To catch short-term and long-term trends
If it gives a signal in the direction of the trend, it is long term
And if it gives a signal in the opposite direction of the trend, it is short term
Too many signals
Can be used in all symbols
Can be used in all time frames
Attributes: Too many signals Can be used in all symbols Can be used in all time frames Simple settings Simple and fast usage With author lifetime support
Settings: Candle back: The number

The Fantastic Price Entry Signal Indicator is a powerful tool designed to assist traders in making informed decisions in the financial markets. This advanced indicator leverages cutting-edge algorithms and technical analysis to identify potential entry points with high accuracy.
Features: 1. Precision Entry Points: The indicator generates precise arrow signals on the chart, highlighting potential entry points for various trading strategies.
2. Trend Identification: By analyzing price mov
*NOTE : 40% Discount for early buyers! Release of Free EA will be 2nd week of November Discount is over once FREE EA is available
RSi indicator is one of the most popular indicator to point when a certain commodity or Pair is overbought or oversold. Currency Strength Meter is also a trend indicator which is based on multiple currencies. RSi Currency Strength Meter is a one chart indicator which have the algorithm of RSi and Currency Strength Meter. It also have one-click feature, in which 28 ma

OVERVIEW
A Lorentzian Distance Classifier (LDC) is a Machine Learning classification algorithm capable of categorizing historical data from a multi-dimensional feature space. This indicator demonstrates how Lorentzian Classification can also be used to predict the direction of future price movements when used as the distance metric for a novel implementation of an Approximate Nearest Neighbors (ANN) algorithm. This indicator provide signal as buffer, so very easy for create EA from this indi

TrendSwift
It's designed to be used by anyone, even the absolute beginner in trading can use it.
NEVER repaints .
Indications are given from close to close .
Designed to be used alone , no other indicators are required.
How does it work TrensSwift is using an internal trend indicator combined with a price action and Fibonacci system.
The strategy is stricly applied without any post recalculations, smoothing or interpolation.
The "success" of the strategy can be checked instantly th

The strategy is based on Order-Block concept with MVB(Most Volatile Bar) concept. To determine a good zone of concern to focus for users, the zone are painted in blue and target levels are in thin redline. The mindset behind this indicator was to help users grow naturally while also making money trading. This strategy works so well on XAUUSD, the win rate is over 85%. To Buy! > Trader MUST see a Bullish Engulfing Candlestick pattern (HIGHER High, HIGHER Close Candle), at the Bank Zone (The Blu
"Maxi Super Signal" - Your Ultimate MT4 Signal Indicator! Are you tired of missing out on profitable trading opportunities? Look no further! Introducing "Maxi Super Signal," the must-have MT4 signal indicator that will revolutionize your trading experience. Key Features: Accurate Signals: Maxi Super Signal employs cutting-edge algorithms to provide you with highly accurate buy and sell signals. Say goodbye to guesswork and hello to informed trading decisions. User-Friendly Interface: Our intuiti

This indicator is based on the RSI indicator
Also, some candlestick patterns are used in it to identify better signals
Can be used in all symbols
Can be used in all time frames
Easy to use method
Adequate settings
Settings: period: The number of candles used to calculate signals. alarmShow: If you want to receive an alert in Metatrader after receiving the signal, enable this setting alarmShowNoti: If you want to receive an alert on your mobile after receiving a signal, enable this setting Ala

Let us introduce you to a new era of neural indicators for financial markets! Intelligent Moving is a unique indicator that trains its neural network in real time! You no longer need to look for the optimal indicator parameters for each specific situation. No more late signals. The artificial intelligence is able to adapt itself and predict any market movements.
Visually, the indicator is drawn as a main solid moving average line, two dotted lines of standard deviations and signal arrows. For
SuperOsma Arrow is a supertrend osma based indicator that give buy and sell signals , the indicator is non repaint and it comes with a dashboard that shows signals stats.
Recommended timeframe :15 and above
Buy : Buy arrow appear on bar open , set tp and sl as drawn on chart
Sell : Sell arrow appear on bar open , set tp and sl as drawn on chart ================================ The Dashboard shows history signals info : 1.win-rate % 2.how many winners 3.how many loser 4.how many consecutive winne
In the fast-paced world of financial markets, every second counts, and every decision can make or break a trade. Enter the Binary Hacker Indicator – a groundbreaking tool that is set to transform the way traders analyze price movements, one minute at a time. Unveiling Precision in Trading: The Binary Hacker Indicator is not your ordinary trading tool. It functions as a real-time analyzer, dissecting each minute on the chart to provide traders with invaluable insights. Unlike traditional indicato

If you are good at trading at levels This indicator is all you need levels to manage your trades Market is usually follow current trend when break out some levels or reverse
Trade at the Institutional traders level with the best supply and demand zone indicator available in MT4 and MT5 The Secret Profit Levels Signals indicator for MT4 is a complete trading system that provides traders with the entry price and 2 take profit levels. Technical analysts use support and resistance levels to identi

Nice Price Signal is a powerful and easy-to-use MT4 indicator that provides traders with accurate and reliable entry and exit signals. The indicator uses a variety of technical indicators to analyze the market and identify trends and reversals. Features: Accurate and reliable signals: The indicator uses a variety of technical indicators to analyze the market and identify trends and reversals. This helps to ensure that traders are entering and exiting trades at the right time. Easy to use: Th

True Super Arrows is a powerful and versatile indicator that can help you identify and trade profitable trends. The indicator uses a combination of technical indicators to generate arrows that point to the direction of the trend. Features: Multiple trend identification methods: The indicator uses a combination of moving averages, trend lines, and other indicators to identify trends. Accurate trend direction: The indicator uses a variety of techniques to ensure that the arrows are pointing in

The Pure Cross Entry Signal Indicator is a powerful tool designed to assist traders in making informed decisions in the financial markets. This advanced indicator leverages cutting-edge algorithms and technical analysis to identify potential entry points with high accuracy. The indicator works based on instant price movements. This indicator is a complete trading product. This indicator does not need any additional indicators.
The indicator certainly does not repaint. The point at which th

Trend based indicator
Identify trends with this indicator
A simple-to-use trend indicator
No complicated settings
Attributes: Can be used in all symbols Can be used in all time frames Relatively high signals No complicated settings Specific to the trend Lifetime support
Settings: Alarm Show Alert: By activating these settings, after receiving the signal, you will receive an alarm in Metatrader
Alarm Show Notification: By activating these settings, after receiving the signal, you will receive a

Using signals generated by a single indicator can be risky while trading. This is because using just one indicator to trade can give more false signals. Thus, many forex traders used three or more indicators to filter out good trade setups. However, using multiple indicators for signals can also be complicating and confusing. This is especially true when these indicators are generating contradictory signals. The Super Arrow indicator, however, provides good signals by using multiple indicators.

Готовый Инструмент для Трейдера с большим арсеналом технического аспекта, который будет помощником в торговле! Индикатор имеет буферные стрелки, алерт, возможность настройки нужных уровней сигнала, возможность торговать на пробой и ретест! работать можно на любом инструменте, и любом таймфрейме. Можно регулировать цвета линий что бы было приятно использовать этот инструмент в своём торговом шаблоне!

With the help of this Practica Trend forex indicator algorithm, you can quickly understand what kind of trend is currently developing in the market. The Practical Trend indicator accompanies long trends, can be used without restrictions on instruments or timeframes. With this indicator, you can try to predict future values. But the main use of the indicator is to generate buy and sell signals.
The Practical Trend indicator is used in the forex markets. One of the main definitions for monitorin
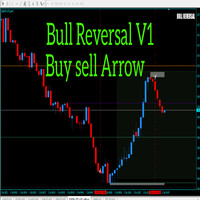
Alright. This indicator works on MT4 and is very easy to use. When you receive a signal from it, you wait for that candle with the signal to close and you enter your trade at the beginning of the next new candle. A red arrow means sell and a green arrow means buy. All arrows comes with a long dotted like for easy identification of trade signal. Are you okay with that?
100% non repaint
Work All Major currency Pair,
1 minute time frame 1 minute expire

ENIGMERA: The core of the market (This is a manual indicator and contains features that may not supported by the MetaTrader current testing environment) Introduction This indicator and trading system is a remarkable approach to the financial markets . ENIGMERA uses the fractal cycles to accurately calculate support and resistance levels. It shows the authentic accumulation phase and gives direction and targets. A system that works whether we are in a trend or a correction.
How It Works
Most

The Bars Deflection trend indicator can be used with any trading pair and on any time frame. With this indicator it is impossible to miss the beginning of a trend. Use Bars Deflection as a standalone strategy or as an addition to yours. Signal arrows appear on the chart at the moment the bar opens and are located at the breakout level of the reverse movement. Thus, the arrows not only indicate the possible direction of movement of the quote, but also act as levels for analyzing the placement of

Dr Trend is a trend indicator for the MetaTrader 4 trading platform. This indicator allows you to find the most likely trend reversal points. You won’t find a proprietary indicator like this anywhere else. A simple but effective system for determining the Forex trend. From the screenshots you can see for yourself the accuracy of this tool. Works on all currency pairs, stocks, commodities, cryptocurrencies.
Are you already tired of constant ups and downs? You shouldn’t fall victim to unstable m

The Trahin indicator determines the prevailing trend. They help analyze the market on a selected time interval. Easy to set up and works on all pairs and all time intervals. Trend indicators make it possible to classify the direction of price movement, determining its strength. Solving this problem helps investors enter the market on time and get good returns.
For any trader, it is extremely important to correctly determine the direction and strength of trend movement. Unfortunately, there is

The Crit indicator analyzes price behavior and, if there is a temporary weakness in the trend, you can notice this from the indicator readings, as in the case of a pronounced change in trend direction. Entering the market is not difficult, but staying in it is much more difficult. With the Crit indicator, staying on trend will become much easier! This indicator allows you to analyze historical data and, based on it, display instructions for further actions on the trader’s screen.
A arrow techn

The Royal Mint New indicator for MetaTrader is a trend-following system that analyzes the trend bias of any currency pair. It is a superior version of the regular Heiken Ashi indicator, designed with more advanced technical tools like the trend reversals, a T3 line, and the moving average. The T3 line of the indicator works as an extra layer of confluence to confirm when the moving average crosses over. Moreover, the Heiken Ashi bars of the indicator would change to blue to depict a potential bu
The MetaTrader Market offers a convenient and secure venue to buy applications for the MetaTrader platform. Download free demo versions of Expert Advisors and indicators right from your terminal for testing in the Strategy Tester.
Test applications in different modes to monitor the performance and make a payment for the product you want using the MQL5.community Payment System.
You are missing trading opportunities:
- Free trading apps
- Over 8,000 signals for copying
- Economic news for exploring financial markets
Registration
Log in
If you do not have an account, please register
Allow the use of cookies to log in to the MQL5.com website.
Please enable the necessary setting in your browser, otherwise you will not be able to log in.