Смотри обучающее видео по маркету на YouTube
Как купить торгового робота или индикатор
Запусти робота на
виртуальном хостинге
виртуальном хостинге
Протестируй индикатор/робота перед покупкой
Хочешь зарабатывать в Маркете?
Как подать продукт, чтобы его покупали
Новые технические индикаторы для MetaTrader 4 - 11

About testing Mode step1.Copy the settings below into txt and save as presets file such as "QDT3.set" step2.Copy the presets file into the "tester" folder which is located in the MT4 root directory step3.Load the settings when testing the indicator step4.Use the tick data to test and adjust the test speed to 30
InpDivideLine1=*******************************通用设置******************************* InpTheme=2 InpSHIcon=0 InpShowSHIcon=true InpShowOnRight=true InpShowMainTabByClickAutoHide=true In

ZeusArrow Smart Liquidity Finder
Smart Liquidity Finder is Ai controlled indicator based on the Idea of Your SL is My Entry. It scan and draws the major Liquidity areas on chart partitioning them with Premium and Discount Zone and allows you find the best possible trading setups and help you decide the perfect entry price to avoid getting your Stop Loss hunted . Now no more confusion about when to enter and where to enter. Benefit from this one of it's kind trading tool powered by Ai an trade

Consolidation is when price is moving inside a clear trading range. When prices are consolidated it shows the market maker placing orders on both sides of the market. This is mainly due to manipulate the un informed money. This indicator automatically identifies consolidation zones and plots them on the chart. The method of determining consolidation zones is based on pivot points and ATR, ensuring precise identification. The indicator also sends alert notifications to users when a new consolida
This automated VOLUME SCALPING INDICATOR can be utilized to manage trades and identify potential areas of support and resistance for both buying and selling. It is designed to identify zones for Sell/Buy trades based on the volume analysis and can be effectively used in conjunction with other indicators, such as order block indicators, and more. Currently designed for MT4, it will later be adapted to function on MT5. We also offer the opportunity to customize the robot according to your trading
FREE

Exclusive Arrival: Presenting for the First Time . This is your secret weapon for predicting which way the wind will blow with the next market shift. It assists you in developing your trading strategy by predicting the direction of the next candle. Compatible with forex, stocks, and cryptocurrencies on all timeframes, but higher timeframes are recommended. MT5 Version - https://www.mql5.com/en/market/product/108937/ How does it work ? It's pretty neat. The algorithm separates green and red can

Двойной RSI по временным рамкам - это новый технический индикатор, предназначенный для трейдеров, которые хотят сравнивать показатели Индекса Относительной Силы (RSI) из двух различных временных рамок на одном графике. Эта двойная перспектива позволяет трейдерам более эффективно идентифицировать подтверждения трендов и дивергенции. Например, трейдер может использовать RSI с одночасового графика наряду с дневным RSI, чтобы убедиться, что краткосрочные сделки соответствуют более широкому рыночному
FREE
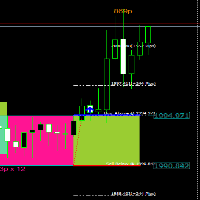
Hi All, " FCK Support Resistance BreakOut " indicator is very simple indicator for new users. You can choose which indicators and timeframes you want to calculate. " FCK Support Resistance BreakOut" that gives NON-REPAINT Buy/Sell signals "FCK Support Resistance BreakOut" provides the trend for buy/sell trades. Opposite side you the stop loss or hedging trade. * - Draws Dynamic S/R Boxes based on consolidation areas; * - consolidation areas are defined by a minimum period of time during whi

This is a unique Gold Indicator On channel trading pullbacks and gives accurate entries on gold and major Fx Pairs on M15tf. It has the ability to pass any prop firm Challenge and get accurate entries on gold and major fx pairs.
EA FOR PROP FIRM AND CHANNEL INDICATOR IS FREE ALONG WITH THIS POWERFUL INDICATOR ALONG WITH THE BEST SET FILE FOR FIRST 25 USERS. Strategy tester report is in comment section. INDICATOR FEATURES: INDICATOR IS BEST ON M15 GIVES ACCURATE ENTRIES EA AND CHANNEL INDICAT

For some trader's charts analysis use, specially for multi timeframe trading strategies . When you need to check something of the time within different timeframe at the same symbol chart, even different symbol charts, this indicator will show the crosshair at sync moving. You just need to load this indicator into some charts, then the crosshair will shown automatic.
FREE

ASR (Accurate Support Resistance) Indicator Uniqe formula behind this indicator makes it one the world's best support resistance indicator. watch the tutorial video
It is user-friendly and here are some key features : -- different calculations for swing traders and scalpers. -- the lower the accuracy number the further the lines distance is. --easily applicable on all charts. ( try to find the best accuracy number ) recommended accuracy number for Gold is 5or 6, for eurusd 6 or 7. other instru

The MT4 Channel Standard Deviation Indicator automatically plots support and resistance channels on the price chart using price standard deviation. It indicates BULLISH and BEARISH market conditions and is suitable for both new and advanced forex traders.
This indicator offers support, resistance, entry, and exit levels, along with stop-loss and take-profit points. It accurately identifies BULLISH and BEARISH market trends, making it effective for both intraday and long-term trading across va

An Implied Fair Value Gap (IFVG) is a three candles imbalance formation conceptualized by ICT that is based on detecting a larger candle body & then measuring the average between the two adjacent candle shadows.
This indicator automatically detects this imbalance formation on your charts and can be extended by a user set number of bars.
The IFVG average can also be extended until a new respective IFVG is detected, serving as a support/resistance line.
Alerts for the detection of bull

This trend reversal arrow indicator has an alert signal that is a valuable tool for forex traders, providing several advantages that contribute to making more informed trading decisions and potentially increasing profits. Here are some advantages: Early Identification of Reversals: The primary advantage is the early identification of potential trend reversals. This arrow indicator can visually signal when a trend may be losing momentum or about to reverse, allowing traders to be proactive rather
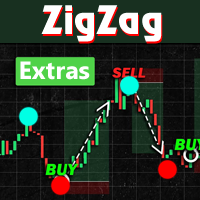
Introducing ZigZag Extras MT4, a Forex indicator that simplifies market analysis:
- Visualizes highest highs and lowest lows over a specified "Depth" period. - Highlights potential reversal points with filled blue and red dots. - Optional display of BreakOut points, indicating probable peaks and bottoms. - Helps avoid common pitfalls of mistaking repainted points for market tops or bottoms. - Designed to enhance understanding and serve as signals for various trading strategies.
Instructions
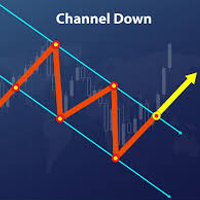
Trend channels are vital tools in technical analysis for identifying optimal buy or sell points. - Upper Line: Marks resistance. - Lower Line: Marks support. - Tops and bottoms of channels indicate potential support or resistance zones. - Bearish Channels: Negative slope (down). - Bullish Channels: Positive slope (up). Creating Channels: - Up Channel: Draw a parallel line matching the uptrend angle, touching the latest peak. - Down Channel: Draw a parallel line ma

What are Heiken Ashi Candles?
Heiken Ashi, derived from the Japanese term 'Heikin Ashi,' translates to average price bars. It's an indicator depicting price bars on a chart.
Formula for Heiken Ashi candles:
- Heiken Ashi opening price: (previous candle's opening + closing price) / 2 - Closing price Heiken Ashi: (opening + high + low + closing) / 4 - Heiken Ashi peak: Max of high, opening, or closing price - Heiken Ashi bottom price: Min of low, opening, or closing price
How to Read Heik
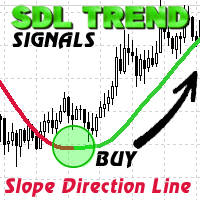
SDL Trend Signals is a custom MQL4 indicator named "Slope Direction Line" for MetaTrader 4. It employs weighted and simple moving averages to create customizable trend lines on charts.
Using two trend line buffers (Uptrend and Downtrend) and one for indicator values (ExtMapBuffer), the indicator calculates trend lines. Bullish slopes appear in BLUE, signaling an upward trend, while Bearish slopes are in RED, indicating a downward trend.
In a Bullish trend, traders can enter a BUY position w

This indicator cuts right through the price, in a straight line
100% non repaint, you get a new value at the opening of each new bar
It is perfect for mean reversal strategies : open far from the line and close when the price touches the line It works really well for mean reverting pairs specially (CHF, NZD).
It has absolutely no lag when there is a sudden move up or down and follows trend exactly !
This indicator should be a must have tool in the toolbox of every trader

Multi Divergence Indicator for MT4 - User Guide Introduction Overview of the Multi Divergence Indicator and its capabilities in identifying divergences across multiple indicators. Importance of divergence detection in enhancing trading strategies and decision-making. List of Indicators RSI CCI MACD STOCHASTIC AWSOME MFI ACCELERATOR OSMA MOMENTUM WPR( Williams %R) RVI Indicator Features Indicator Selection: How to enable/disable specific indicators (RSI, CCI, MACD, etc.) for divergence detection.

The TLR indicator is a market trend identification indicator. The idea behind this indicator is to use 3 linear regression lines, one short-term, one medium-term, and one long-term. The UPTREND will be determined when: The long-term linear regression line and the medium-term linear regression line have an uptrend. The long-term linear regression line has an uptrend, the medium-term linear regression line has a sideway, and the short-term linear regression line has an uptrend. The DOWNTREND will
FREE
*** IMPORTANT: I will send you the real file to your email because marketplace doesn't allow DLL files and this indicator needs DLL to request the data from internet. *** My email: dibanfelipe@gmail.com *** My whatsapp: +56962286633 *** My Telegram: FelipeDiban -Retail Traders Sentiment indicator shows the percentage of longs and shorts, volume, positions and average prices in real time. -The sentiment update every 1 minute. -The source of information comes from myfxbook, which collects an imp

An integrated analysis system that moves the trader from the random trading stage to professional trading And seeing and understanding the market with one glance instead of moving between different charts and currencies, even in times of high liquidity
It will be easy for you to read the market with our excellent Price Action Expert signals and confirm entry opportunities With accurate analysis tools integrated into our analysis system, which we can work with on a daily basis One of the most

up-down indicator is no repaint and works all pairs and lower than weekly time frames charts. it is suitable also 1 m charts for all pairs. and hold long way to signal. dont gives too many signals. when red histogram cross trigger line that is up signal.and price probably will down when blue histogram cross trigger line that is down signal.and price probably will go up. when the signals not seen press + button on terminal . too see weekly chart because of low data on chart ,it needs to lower p

BUY INDICATOR AND GET EA FOR FREE AS A BONUS + SOME OTHER GIFTS! ITALO TRIANGLE INDICATOR is the best triangle indicator ever created, and why is that? Using Geometry and Fibonacci the Indicator works on all time-frames and assets, indicator built after 7 years of experience on forex and many other markets. You know many triangle indicators around the internet are not complete, does not help, and it's difficult to trade, but the Italo Triangle Indicator is different , the Italo Triangle Indi

QualifiedEngulfing - это бесплатная версия индикатора ProEngulfing ProEngulfing - это платная версия индикатора Advance Engulf, загрузите ее здесь. В чем разница между бесплатной и платной версией ProEngulfing ? Бесплатная версия имеет ограничение в один сигнал в день. Представляем QualifiedEngulfing - ваш профессиональный индикатор для распознавания паттернов Engulf для MT4. Разблокируйте мощь точности с QualifiedEngulfing, передовым индикатором, разработанным для выявления и выделения квали
FREE

Цена будет повышаться на 30 долларов после продажи каждых 5 копий. Первоклассный индикатор направлен на определение общего тренда рынка. Цветовая система с яркими и темными цветами призвана выявлять сильные и слабые условия рынка.
На мой взгляд, этот индикатор беспрецедентен; он отлично справляется, когда рынок начинает двигаться.
Если вы предпочитаете использовать индикатор для более длительного временного интервала, такого как 1 час, 4 часа или суточный, для достижения лучших результатов,

«Trend reversal ml4» – это уникальный индикатор, разработанный для определения моментов разворота цены в первое время. Это уже готовая торговая система для Metatrader4. Индикатор не перерисовывает свои значения! На основе продвинутых алгоритмов и технического анализа этот индикатор дает вам сигналы о возможных точках входа и выхода на рынок, помогая вам принимать обоснованные решения.
Преимущества индикатора: высокая точность сигналов. Индикатор сам показывает трейдеру, правильно ли он настро

With this easy to set up indicator you can display and set alerts for the following candlestick formations: Bull Breakout, Bear Breakout, Hammer, Pin, Bullish Engulfing, Bearish Engulfing. I'd appreciate if you would review the indicator
Input parameters: ShortArrowColor: The color of the Arrows, displaying a Bearish candle formation LongArrowColor: The color of the Arrows displaying a Bullish candle formation BullishEngulfing: Disabled/Enabled/EnabledwithAlert BearishEngulfing: Disabled/Ena
FREE
Forex and Gold OBI is an innovative indicator based on a study of price and market dynamics, utilizing the RSI indicator. This indicator helps you find the best moment to enter the forex market by signaling when the market is in overbought or oversold conditions. Moreover, The indicator calculates two possible targets and the stop loss for each trade, allowing you to optimize your risk/reward ratio. Price This indicator is easy to use and set up, working with any currency pair and timeframe. If
FREE

This automated DOJI BAR FINDER INDICATOR can be utilized to manage trades and identify potential areas of support and resistance for both buying and selling. It is designed to identify zones for Sell/Buy trades and can be effectively used in conjunction with other indicators, such as order block indicators, and more. Currently designed for MT4, it will later be adapted to function on MT5. We also offer the opportunity to customize the robot according to your trading strategy. https://t.me/FXTSPr
FREE

Технически индикатор представляет собой разницу двух фрактальных адаптивных скользящих средних. Фрактальная адаптивная скользящая средняя (FRAMA) — это умная адаптивная скользящая средняя, разработанная Джоном Элерсом. FRAMA учитывает изменения цен и точно следует за уровнем цены, оставаясь прямой в моменты колебания цены. FRAMA использует тот факт, что рынки фрактальны и динамически корректирует ретроспективный период, основанный на этой фрактальной геометрии. Индикатор имеет возможность отпр
FREE

Уровни пивот, поддержки и сопротивления являются одним из основных индикаторов на графиках любого профессионального трейдера. Индикатор PivotPointsMT4 поможет вам определить актуальные точки входа на любой валютной паре и любом таймфрейме. Удобен тем, что показывает исторические уровни пивот, поддержки и сопротивления на всех таймфреймах, и вы всегда видите, что работало в недавнем прошлом. Учитывая новостной контекст, чаще всего определить актуальный уровень и правильную точку входа в рынок на

ICT Kill zone and Macros Indicator mark and display the following zone times on the chart: Kill zones Kill zone Forex Asian
London Open New York Open London Close Central Bank Dealing range
Kill zone Indices Asian London Open New York AM New York Lunch New York PM Power Hour
Macros London 1 London 2 New York Am 1 New York AM 2 New York Lunch New York PM 1 New York PM 2
Silver bullet London Open New York AM New York PM
Sessions Asian London New York
Chart The display of Kill zone ,

SX Currency Strength indicator allows users to analyze currency strength through a selected period, with results resetting periodically and accumulating thereafter. It displays the historical relative strength of eight major currencies (USD, EUR, GBP, JPY, AUD, CHF, CAD and NZD) across a selected timeframe. Assessing a currency's relative strength aids in evaluating its performance against a basket of other currencies. Users can select to visualize relative strength of the currencies in the shap

In Forex trading, understanding support and resistance is crucial. Virtually every trading strategy incorporates these levels.
MetaTrader lacks built-in support and resistance calculation features, but there's a solution— the Support and Resistance Lines indicator.
This powerful MetaTrader indicator automatically calculates and displays support and resistance levels for any chosen currency pair or trading instrument.
Benefits of the Support and Resistance Lines indicator:
1. Identify be

This pass-band oscillator reduces lag in market data by filtering out high and low frequencies. It uses two EMAs (Exponential Moving Averages) with periods of 40 and 60.
Trigger points are added using an RMS cyclic envelope over the Signal line. The pass-band waveform output is calculated by summing its square over the last 50 bars and taking the square root to create trigger levels.
Buy when the pass-band crosses above its -RMS line and short when it crosses below the RMS line. The indicat

Доброго времени суток уважаемые трейдеры и инвесторы.
Вашему вниманию предлагается индикатор, определяющий за любой промежуток времени : Максимальную цену. Минимальную цену. 50 % от от максимума до минимума. Цену закрытия периода. Кроме того, в зависимости от настроек - индикатор может добавлять 10 процентных уровней как вниз, так и вверх, эти уровни указываются, но по стандарту начинаются от 50% с шагом 50% до 500%. В обе стороны. Индикатор реализован максимально удобно, при смене тайм-фрейма

The Waddah Attar Explosion (WAE) indicator is a potent tool in Forex trading, offering buy, sell, exit buy, and exit sell signals. It assesses trends as trend power and momentum as explosion power.
Trend Direction: - Green bars indicate a bullish trend. - Red bars indicate a bearish trend.
Signal Line: - A line serves as a threshold for momentum.
Buy Trade Setup: **Entry:** Go long when a green bar crosses above the threshold. Place a stop loss below the entry candle. **Exit:** Close the

In MetaTrader, TP & SL values aren't visible when hovering over corresponding lines. Our indicator fixes this by showing values on-screen. It displays defined SL and TP values in your account currency, facilitating easy tracking of positions. Note : The indicator estimates values, excluding commissions, and allows customization of colors and distance from SL/TP lines.

SURE REVERSAL is a histogram overbought/oversold type indicator that gives key reversal points that indicates a bull or bear market movment this indicator is fusion between moving average and the rsi indicator ,this indicator is non repainter , and is not delayed . Parameters : Ma period Ma Method Ma Price Sure Period (Rsi) Sure Price (Rsi) ==============
ткройте новое измерение торговли с нашим передовым индикатором MQL4 Range BreakOut MT4.
Этот мощный инструмент предназначен для выявления и извлечения выгоды из движений цен, когда они выходят за пределы установленных диапазонов.
предоставляя вам точность и уверенность, необходимые для процветания в динамичном мире финансовых рынков.
Версия MT5 : WH Range BreakOut MT5
Функции:
Точное определение диапазона. Сигналы прорыва в реальном времени. Настраиваемые параметры. Инструменты у
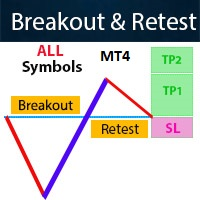
Contact me for instruction, any questions! Introduction The breakout and retest strategy is traded support and resistance levels. it involves price breaking through a previous level. The strategy is designed to help traders do two main things, the first is to avoid false breakouts. Many false breakouts start with a candlestick that breaks out of a level but ends with an immediate candlestick that brings the price back into the level. The second thing that the breakout and retest strategy does
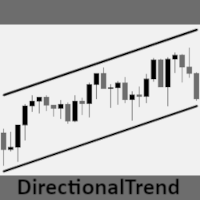
Торговый индикатор DirectionalTrend - это инновационный инструмент, предназначенный для получения четкого и точного представления о тенденции развития финансового рынка. Основываясь на исторических рыночных данных, этот индикатор определяет и отображает общее направление движения рынка в течение определенного периода времени. Его основная задача - помочь трейдерам принимать взвешенные решения, предоставляя четкие сигналы о доминирующей на рынке тенденции. Индикатор имеет интуитивно понятный инте
FREE

ЭНИГМЕРА: ядро рынка https://www.enigmera.com
Введение Этот индикатор и торговая система представляют собой удивительный подход к финансовым рынкам. ENIGMERA использует фрактальные циклы для точного расчета уровней поддержки и сопротивления. Он показывает подлинную фазу накопления и дает направление и цели. Система, которая работает независимо от того, находимся ли мы в тренде или в коррекции.
Как она работает? ENIGMERA состоит из трех линий: линии поддержки/сопротивления, линии цели и ли

Индикаторы на Forex, измеряющие время, - большая экзотика. Широко распространено мнение, что время не поддается анализу.
Данный индикатор имеет следующую логику:
Из физики мы знаем, что расстояние равно скорости со временем. S=V*t Если рассматривать время, то оно будет равно скорости, деленной на расстояние. t=S/V
Скорость на Форекс - это тиковый объем, потому что это не объем, а количество тиков за определенный промежуток времени, т.е. это скорость сделки. (Я сделал такой индикатор с ег

Цель индикатора "черная лошадь" - выявление расхождений между движением цены и индикатором VWAP. Он использует фильтры для выявления потенциальных ложных расхождений и выдачи качественных, точных сигналов.
Медвежьи расхождения обозначаются красными точками над свечой, тогда как бычьи расхождения представлены зелеными точками под свечой.
Основной фильтр расхождений основан на ATR (Средний истинный диапазон) и движении цены в предыдущих свечах в пределах периода обзора. Расхождения определяют
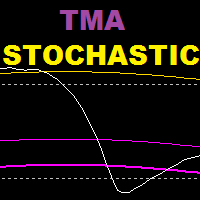
TMA Stochastic — это индикатор, основанный на стохастическом осцилляторе и индикаторе полос tma. Этот индикатор основан на разворотной стратегии.
Рекомендуемый временной интервал: 15 лет и старше.
Рекомендуемые настройки: более низкие значения для скальпинга, более высокие значения для свинг-трейдинга.
=============================================== =====================
Параметры:
История tma: сколько баров назад, чтобы показать полосы tma на стохастике
Период К (Стохастик)
Перио

Заголовок: "Daotradingfx - Идеальный Ключ для Волнового Трейдинга с 7-летним Опытом"
Торговля на форексе никогда не бывает легкой, но с индикатором daotradingfx я нашел надежного партнера, открывающего дверь к успеху в волновом трейдинге. Созданный на основе моего 7-летнего опыта торговли, этот индикатор - не просто инструмент; это всестороннее понимание рынка и удобство в торговле.
Daotradingfx выделяется своей способностью использовать несколько временных интервалов, ключевой функцией, ко
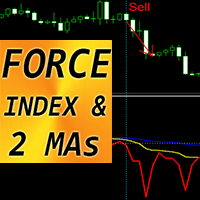
Forex Indicator "FORCE index and 2 Moving Averages" for MT4 This indicator is excellent for Momentum trading into the trend direction. " FORCE index and 2 Moving Averages" Indicator allows you to see Fast and Slow Moving Averages of Force index Force index is one of the top indicators that combines price and volume data into a single value Force index itself is powerful oscillator - that measures the amount of power used to move the price Indicator gives opportunities to see the t
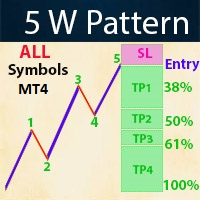
Contact me for instruction, any questions! Introduction The Elliott Wave in technical analysis describes price movements in the financial market that are related to changes in trader sentiment and psychology. The 5 W Pattern (Known as 3 Drives) is an Elliott Wave pattern that is formed by 5 consecutive symmetrical moves up or down. In its bullish form, the market is making 5 drives to a bottom before an uptrend forms. In a bearish 5-drive, it is peaking before the bears take over. 5W Pattern S

RSI divergence indicator is a multi-timeframe and multi-symbol indicator that help us find divergences between price chart and RSI indicator. Always use the divergence indicators with other technical assets like support resistance zones, candlestick patterns and price action to have a higher possibility to find trend reversals. This indicator will identify the peaks and troughs of both price and the RSI indicator. You can adjust the parameters to adjust the strength and weakness of these peaks a
FREE

The "Yesterday High Low" indicator for the MetaTrader 4 (MT4) trading platform is a powerful tool designed to help traders identify key price levels from the previous trading day. This indicator provides a visual representation of the high prices, low prices, high/low price averages, and intermediate average levels on the chart.
Primarily used by institutional and professional traders, this indicator offers an instant view of price levels that are often considered crucial in financial markets
FREE

This indicator integrates the Bollinger Band strategy in calculation with a volume-over-MA
calculation to further narrow down "Areas of Interest" levels for a potential re-test zone to the right of the chart.
We added a Moving Average calculation for a multi-level cloud and further broke down more conditions to highlight both
volume flow crossover on the High and Extreme High MA's and also high and extreme high volume spikes on set period average
without bull\bear conditions. Original Bull
FREE
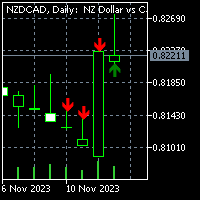
For MT5 version please click here . Introduction Most traders use candle patterns as a confirmation tool before entering a trade. As you know there are lots of candle patterns out there. However I realized most of them can be generalized in simple rules. So I developed my own candle pattern(Although I cannot say for sure this is mine). pattern description The pattern consists of three consecutive candles. This is true for most of the patterns out there (considering there is a confirmation nec
FREE
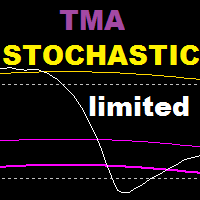
TMA Stochastic is an indicator based on stochastic oscillator and tma bands indicator , this indicator is based on a reversal strategy . Recommended time frame : 15 and above Recommended settings : lower values for scalping , higher values for swing trading WORKS ONLY ON EURUSD , GET THE FULL VERSION : https://www.mql5.com/en/market/product/108378 ======================================================================= Parameters : tma history : how many bars back to show tma bands on stochas
FREE
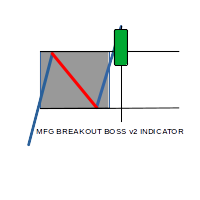
MFG breakout boss indicator is a Semi Autom ated Asian session range breakout System which seeks to identify the High and low of the asian session when the Market is ranging with no major movement, With the help of sofisticated Algorithm within the system, a breakout in either direction coupled with momentum the system gives High Accurate entries, with predefined Stop loss and 3 Take profit levels.

Supreme Direction is an indicator based on market volatility , the indicator draws a a two lined channel with 2 colors above and below price , this indicator does not repaint or back-paint and signal is not delayed. how to use : long above purple line , short below golden line. Parameters : channel period ========================================================
FREE

Daily supply and demand levels for breakouts or reversals. Use on 1 Hour charts No nonsense, for the confident trader who trades price action supply and demand levels with daily projections without the fluff using 1 Hour charts. MT5 Version: https://www.mql5.com/en/market/product/108522 The Bank Trader Indicator is a sophisticated tool employed by institutional traders, particularly those in banking institutions, to navigate the complex world of forex markets. Rooted in the principles of daily

Attractive Numero - Numerology Levels Indicator Description: Discover the fascinating world of numerology in trading with our "Attractive Numero" indicator. This innovative tool allows you to seamlessly integrate numerology principles into your technical analysis, helping you identify critical supply and demand levels that can significantly enhance your trading strategy. How It Works: "Attractive Numero" is designed to harness the power of numerology to pinpoint supply and demand levels. You hav
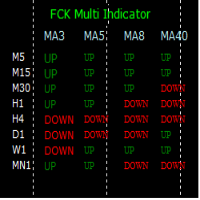
The FCK Multi Indicator for MT4 displays trend direction of multiple indicators on multiple time frames for a pair. So, forex traders can see the trend direction at a snap and trade with confluence of multiple indicators. Furthermore, it helps traders to see the trend in multiple time frames and trade in the direction of the overall market trend. Additionally, it shows the stop loss, pips to stop, pips in profit of any open position. The indicator display is very neat and is very helpful for bot
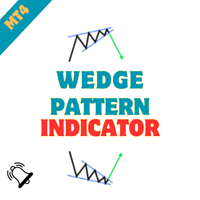
Wedge Chart Pattern Indicator - Unleash the Power of Wedge Patterns in Your Trading Embark on a journey of precision trading with the "Wedge Chart Pattern Indicator." Crafted for MetaTrader, this advanced tool is your ultimate companion for identifying wedge chart patterns, empowering you to make informed and strategic trading decisions. Whether you're a seasoned trader or just starting, this indicator simplifies the process of spotting wedge patterns, providing you with a valuable edge in the m
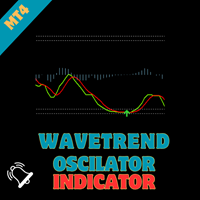
WaveTrend Oscillator - Bringing Tradingview's Renowned Indicator to MQL Elevate your trading strategies with the "WaveTrend Oscillator," an MQL port of the renowned TS/MT indicator created by Lazybear on tradingview. This powerful indicator provides valuable insights into market dynamics, offering clear signals for optimal entry and exit points in your trades.
Key Features : Proven Effectiveness : Based on the popular TS/MT indicator, the WaveTrend Oscillator brings a time-tested and proven ap

Symmetrical Triangle Pattern Indicator - Mastering Trend Recognition in MetaTrader Unlock the power of trend recognition with the "Symmetrical Triangle Pattern" indicator for MetaTrader. This innovative tool simplifies the identification of symmetrical triangle patterns, providing traders with clear signals for potential trend continuation or reversal. Elevate your trading strategies with this MQL offering. Key Features : Accurate Pattern Recognition : The Symmetrical Triangle Pattern Indicator
STOCH ARROW is a long short arrow signal type indicator that is based on standard stochastic oscillator this indicator has 3 methods of giving long and short signal that are as follow : 1.whenever stochastic lines cross 2.when a cross happens in overbought and oversold zones (short arrow on overbought zone cross , long arrow on oversold zone cross) 3.when stochastic lines leave overbought and oversold zones (short arrow on leave from overbought zone , long arrow leave on oversold zone) this ind
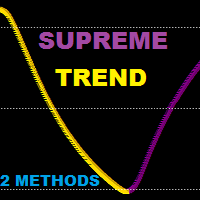
Supreme Trend is a reversal/continuation type Oscillator type indicator that is based on Moving average and stochastic indicators this indicator can be used in two methods : Reversal Method : short when golden arrow appear after arrows were above upper level (e.g 70) Reversal Method : long when Purple arrow appear after arrows were below lower level (e.g 30) Trend Method : long when arrows cross above 50 level line , short when arrows cross below 50 level line. use higher ma and stochastic peri

Introducing the South African Sniper indicator created by a small group of traders with a few years trading trading the financial market profitably . This is a plug and play indicator that provides you with BUY and SELL (SNIPER ENTRY) signals with TARGET and trail stops. The indicator Works with all MT4 trading instruments. The indicator uses previous chart data as receipt to speculate on future market moves.
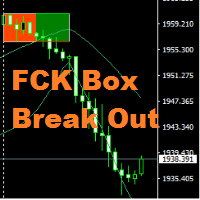
Hi All, " FCK Box Break Out " indicator is very simple indicator for new users. You can choose which indicators and timeframes you want to calculate. "FCK Box Break Out" provides the day's trend for buy/sell trades. Opposite side you the stop loss or hedging trade. NON-REPAINT Buy/Sell signals Recommendations Timeframes: Recommended - H 1 (Still, EA technically works on any Time frames ) Spread : up to 20 Recommended pairs: works on any metal, indices and currency pair
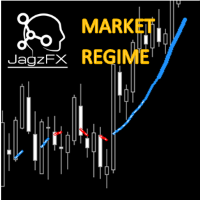
Elevate your trading with the JagzFX Market Regime Filter—adapt, optimize, succeed in navigating through smooth or volatile price movements. Gain a deeper understanding of market dynamics to refine your strategy and make informed decisions. KEY FEATURES Price Action Analysis: Distinguishes between smooth and volatile price movements. Trend Identification: Pinpoints bullish or bearish trends with precision. Strength Assessment : Evaluates the strength of identified trends—whether strong or weak M

note: this indicator is for METATRADER4, if you want the version for METATRADER5 this is the link: TRENDMAESTRO recognizes a new TREND in the bud, he never makes mistakes. The certainty of identifying a new TREND is priceless. DESCRIPTION TRENDMAESTRO identifies a new TREND in the bud, this indicator examines the volatility, volumes and momentum to identify the moment in which there is an explosion of one or more of these data and therefore the moment in which prices have strong probability of f
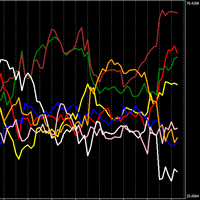
Мощный индикатор, показывающий силу отдельной валюты.
Чем он выше, тем сильнее валюта, и наоборот, чем он ниже, тем она слабее.
Торговая стратегия N1: Открывайте позицию при пересечении линий, если одна пересекает вверх, а другая вниз, открывайте позицию по валюте, которая растет.
Торговая стратегия N2: Откройте позицию, покупая самую сильную валюту и продавая самую слабую валюту.
В настройках можно изменить таймфрейм, я использую по умолчанию (ТАЙМФРАММ 1 ЧАС) и с периодом 24. Я также
MetaTrader Маркет - уникальная площадка по продаже роботов и технических индикаторов, не имеющая аналогов.
Памятка пользователя MQL5.community расскажет вам и о других возможностях, доступных трейдерам только у нас: копирование торговых сигналов, заказ программ для фрилансеров, автоматические расчеты через платежную систему, аренда вычислительных мощностей в MQL5 Cloud Network.
Вы упускаете торговые возможности:
- Бесплатные приложения для трейдинга
- 8 000+ сигналов для копирования
- Экономические новости для анализа финансовых рынков
Регистрация
Вход
Если у вас нет учетной записи, зарегистрируйтесь
Для авторизации и пользования сайтом MQL5.com необходимо разрешить использование файлов Сookie.
Пожалуйста, включите в вашем браузере данную настройку, иначе вы не сможете авторизоваться.