Watch the Market tutorial videos on YouTube
How to buy а trading robot or an indicator
Run your EA on
virtual hosting
virtual hosting
Test аn indicator/trading robot before buying
Want to earn in the Market?
How to present a product for a sell-through
New Technical Indicators for MetaTrader 4 - 14
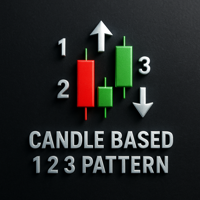
Candle Based 1 2 3 Pattern The Candle Based 1 2 3 Pattern indicator identifies high-probability reversal setups using a classic 1-2-3 formation based on candle structure and swing points. It only displays signals after a confirmed breakout , reducing noise and avoiding premature entries. Key features: Candle-based detection of confirmed bullish and bearish 1-2-3 patterns Draws trendlines between pattern points and signal arrows at confirmation Sends alerts via terminal, email, push, and sound Cu

SMC Larry Williams Structure is an indicator for analyzing price chart structures that builds and connects the most important swing points using the method of the famous trader Larry Williams from his bestseller “Long-Term Secrets of Short-Term Trading”, creating a solid foundation for adapting the market structure and analyzing the areas of interest of large participants using the Smart Money concept. The swing construction is based on simple and clear logic — identifying key local extremes whe
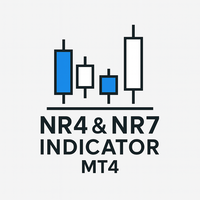
Description:
NR4 & NR7 Inside Bar Highlighter for MetaTrader 4 is an indicator that automatically detects price compression patterns based on the combination of NR4 or NR7 with an Inside Bar . How it works:
The NR4 (Narrow Range 4) pattern identifies the candle with the smallest range among the last 4 bars, while NR7 considers the last 7. When this narrow-range condition occurs alongside an Inside Bar (a candle completely contained within the previous one), it often signals a low-volatility ph
FREE

Quick Lines Tool: A User-Friendly Indicator for Drawing Trend Lines and Rectangles Quick Lines Tool is a powerful and intuitive indicator for MetaTrader 4 designed for traders who need fast and effective tools for technical analysis. With this indicator, you can easily create trend lines, support/resistance levels (AP/DW), and rectangles, optimizing your chart marking process. It is ideal for both beginners and professional traders looking to enhance their analysis accuracy and speed.
Main adv
The indicator is ordinary in its creation. It calculates the highs and lows and correlates them with the average price. The only beauty of it is that it correlates the parameters of the past day with the parameters of the present day, and that's why I called it "That Day." It was developed for the time period of the H1-hour chart. And that's where he behaves correctly. In the settings, it is easy to set the parameter: length determines the average price. Parameter: prim indicates which price the
Candlestick Pattern Analyzer for MT4 Description
Candlestick Pattern Analyzer is an advanced tool for both discretionary and systematic traders, built to automatically detect major Japanese candlestick patterns and deliver a detailed statistical breakdown of their historical performance. This indicator is perfect for those who want to objectively verify the real-world effectiveness of patterns and combine them with confirmation filters (e.g., trend, key levels, volume) and a well-defined risk m
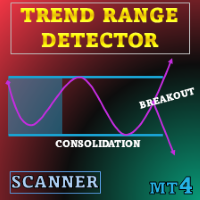
Special offer : ALL TOOLS , just $35 each! This tool will be FREE for 3 days, don't miss it! New tools will be $30 for the first week or the first 3 purchases ! Trading Tools Channel on MQL5 : Join my MQL5 channel to update the latest news from me Trend Range Detector was created for users who prefer a structured, data-driven view of price consolidation. Instead of relying on subjective chart reading, it applies clear volatility rules to outline where prices have paused and where

Enhance your trading versatility with the Make Your Own Index MT4 indicator, a customizable tool that lets you build personalized indices from any symbols, blending them into a single line with equal or weighted allocations for tracking sector performance, diversified portfolios, or strategy-specific baskets. Inspired by established indices like the S&P 500 (market-cap weighted since 1957) or equal-weighted alternatives popularized in the 2000s for balanced exposure, this indicator is favored b
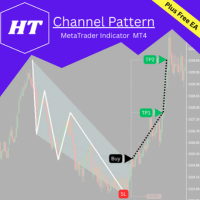
HT Channel Pattern – Advanced Channel Detection & Breakout Confirmation Tool
HT Channel Pattern is a professional indicator designed to detect one of the most effective price action patterns in Forex: the channel pattern. Whether the market is forming a bullish or bearish channel, this tool automatically identifies the pattern and provides clear visual insights for potential trading opportunities.
Key Features: Detects both bullish and bearish channel patterns Draws waves and channel boundaries
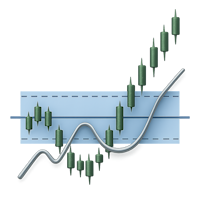
PriceDensity – Professional Price Density Indicator for Accurate Market Level Detection PriceDensity is a smart, non-volume-based indicator that analyzes historical price action to determine key price levels with the highest frequency of occurrence . It automatically detects where the market has spent the most time – revealing hidden areas of support and resistance based on actual market behavior, not subjective drawing. This tool is ideal for traders using price action, support/resistance conce
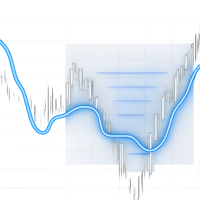
ShiftedPriceDensity — Professional Price Density Indicator with Shifted Historical Levels ShiftedPriceDensity is an advanced technical custom indicator for the MetaTrader 5 platform that visualizes the most significant horizontal price levels based on historical shifts . This tool is ideal for traders who practice cluster analysis , build support and resistance levels , and look for key price zones in volatile market conditions. The indicator is built upon the concept of

ShiftedPriceDensitySet – Advanced Price Density Level Analysis with Time Shifts ShiftedPriceDensitySet is a powerful professional indicator for MetaTrader 5 , designed to visualize key price density levels across multiple time-shifted segments of historical data. It builds multiple instances of the embedded PriceDensity indicator with configurable depth and shift settings to reveal consistent price clusters that often act as support/resistance zones or areas of strong market interest. This is an
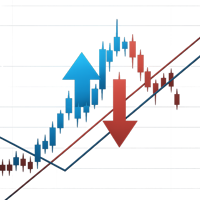
Pointer Trend Switch — precision trend reversal indicator Pointer Trend Switch is a high-precision arrow indicator designed to detect key moments of trend reversal based on asymmetric price behavior within a selected range of bars. It identifies localized price impulses by analyzing how far price deviates from the opening level, helping traders find accurate entry points before a trend visibly shifts. This indicator is ideal for scalping, intraday strategies, and swing trading, and performs equa

Trend TD Ultimate — The All-in-One Trend Indicator for MetaTrader Trend TD Ultimate is a modern, all-in-one trend indicator for MetaTrader 5. It combines advanced trend-following logic, smart price pattern analysis, and integrated trade evaluation features — all in one powerful tool. It is built for traders who need accuracy, flexibility, and visual clarity — on forex, stocks, indices, commodities, and crypto . Key Features & Benefits 1. Multi-Purpose Trend Signal Engine Generates Bu

**Volume Trend Navigator** is a modern volume-based trend indicator that spots when market momentum is accelerating or fading by analyzing volume and recent price swings over three bars:
* **Bullish acceleration**: Draws an ↑ arrow when the current bar’s volume exceeds that of the two preceding bars **and** price closes above the previous bar’s high—signaling a strengthened up-trend. * **Bearish acceleration**: Draws a ↓ arrow when the current bar’s volume exceeds that of the two preceding bar

Indicator “Tempest” for MQL5 Market (SEO-optimized, in English)
1. Introduction The Tempest indicator is a modern technical tool for MetaTrader 5 designed to automatically detect market reversal points by analyzing RSI across multiple timeframes.
Provides clear BUY/SELL signals that allow traders to react instantly to market conditions.
Easily integrates into Expert Advisors for fully automated trading.
SEO Keywords: Tempest, RSI indicator, MQL5 trading robot, Forex automation, RSI strategy

Equilibrium — Multi-Timeframe CCI Reversal Indicator for MetaTrader 5 Equilibrium is a powerful technical indicator for MetaTrader 5, built on the Commodity Channel Index (CCI) to automatically detect potential market reversal points.
Designed for both manual traders and automated strategies, Equilibrium delivers precise BUY/SELL signals, adapting to changing market conditions in real time. Easily integrates into any MQL5 Expert Advisor for full automation.
SEO Keywords: CCI indicat

System Super Trend: Your personal all-inclusive strategy The indicator no repaint!!! System Super Trend - is an easy to use trading system. It is an arrow indicator designed for Forex and cryptocurrencies. The indicator can be used as a standalone system, as well as part of your existing trading system.
How does System Super Trend work? We have 3 options for trading with our indicator.
Global Signals - You can easily trade using these signals, Green arrow - for buying, Red - for selling. T

Ninja Trend Oracle — Master the Trend Like a Ninja The Ninja Trend Oracle is your secret weapon for identifying high-probability trend reversals, breakouts, and pullbacks — all with deadly precision . Whether you’re a scalper, day trader, or swing trader, this all-in-one trend detection tool helps you: Spot the direction with clarity Catch early entries with confidence Avoid false breakouts and choppy zones Receive clean visual signals and alerts Features: Smart Trend Zones: Dynamically det

Directional Trend Line — Directional Trend Indicator for MetaTrader
**Directional Trend Line** is a professional tool for traders that allows you to:
* Accurately determine the current market trend * Timely detect phase shifts in market structure * Clearly visualize the dominant price movement direction
### ** Key Features **
#### 1. ** Automatic Adaptation to Any Timeframe **
* Automatically adjusts the CCI period for M1…MN * Enables optimal sensitivity across different timeframes *

Multi Anchor VWAP Pro MT4 – Pure Anchored VWAP | Adaptive σ-Bands | Smart Alerts Precision VWAP anchoring, purpose-built for MetaTrader 4. One-click anchors, dynamic σ-bands or %-bands and instant multi-channel alerts—ideal for scalpers, intraday and swing traders who need institutional-grade fair-value mapping. Full User Guide – Need MT5? Click here WHY PROFESSIONAL TRADERS CHOOSE MULTI ANCHOR VWAP PRO VWAP is the institutional benchmark for fair value. This MT4 edition removes every non-anch
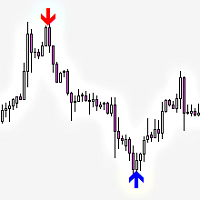
Railway Tracks Pattern — Reversal Pattern Indicator Railway Tracks Pattern is an indicator that automatically detects a powerful two-candle reversal pattern on the chart. It looks for two candles with opposite directions (bullish and bearish), similar in size, and with minimal wicks — a clear sign of momentum shift. How it works: The first candle is strong and directional. The second candle moves in the opposite direction and is of similar size. Both candles have small shadows (wicks). The
FREE
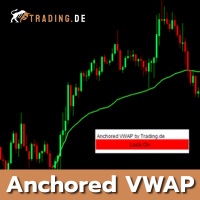
With the Anchored VWAP for MT4 from Trading.de, you can easily calculate and display the volume-based average price starting from a specific point in the chart (anchor). The indicator is ideal for our Trading.de 1-minute chart strategy, but can also be used in all other timeframes. The AVWAP for MetaTrader 4 is calculated using volume or an average period. In the settings, you can specify whether or not to use real trading volume. The indicator also has a "Lock" button in the upper right corner

Sniper System Accurate entry points for trades for currencies, crypto, metals, stocks, indices! The indicator 100% does not repaint All screenshots were taken at the time of publication (no adjustment to history!) If a signal appears, it no longer disappears! Unlike indicators with redrawing, which lead to loss of deposit, because they can show a signal and then remove it. Trading with this indicator is very easy. We wait for a signal from the indicator and enter the transaction according to t

Visual Trend is a simple and effective tool that helps you quickly assess the market situation and find trend-based entry points. It eliminates the need to use multiple indicators at once by combining all the essentials in one place. Key Features: Background Coloring: The chart background automatically changes color based on the trend direction (blue for uptrend, pink for downtrend). Clear Signals: Trend-following entry points are marked with arrows. Signal Candle Highlight: The candle o
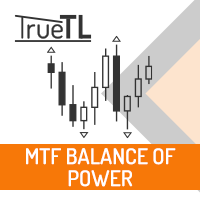
Highly configurable Balance of Power (BOP) indicator.
Features: Highly customizable alert functions (at levels, crosses, direction changes via email, push, sound, popup) Multi timeframe ability Color customization (at levels, crosses, direction changes) Linear interpolation and histogram mode options Works on strategy tester in multi timeframe mode (at weekend without ticks also) Adjustable Levels Parameters:
BOP Timeframe: You can set the lower/higher timeframes for Balance of Power . BOP
FREE

Highly configurable Fisher Transform indicator.
Features: Highly customizable alert functions (at levels, crosses, direction changes via email, push, sound, popup) Multi timeframe ability Color customization (at levels, crosses, direction changes) Linear interpolation and histogram mode options Works on strategy tester in multi timeframe mode (at weekend without ticks also) Adjustable Levels Parameters:
Fisher Transform Timeframe: You can set the lower/higher timeframes for Stochastic. Fisher
FREE

Moving MinMax is a custom trend indicator that helps you easily identify the current market direction , reversals , and high-probability trade setups . This tool uses a unique calculation method that measures price pressure from both buyers and sellers, helping you see who is in control and when the market is likely to change direction. Unlike basic oscillators or moving averages, this indicator computes trend likelihoods using a distribution-based exponential model applied over a moving price w
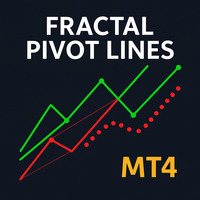
Fractal Pivot Lines — Indicator Overview Fractal Pivot Lines is a custom trend-structure indicator for MetaTrader 4 .
It automatically connects key fractal highs and lows with dynamic lines so you can see how price is respecting local structure, building channels, and preparing for potential reversals. Instead of staring at dozens of candles and guessing where the real pivots are, the indicator turns fractals into clear support/resistance paths and trend channels . What the Indicator Does C

The Trend and Revesal Indicator is a custom indicator designed to help traders identify trend direction, reversal points, and high-probability trade setups. It uses advanced mathematical calculations to analyze market behavior and highlight potential turning points with great accuracy. This indicator measures buying and selling pressure over a defined period and shows which side is in control. It provides a clear visual display of trend zones, reversal arrows, and momentum signals in a separate
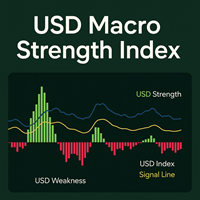
The USD Macro Strength Index is a custom indicator designed to assess and visualize the overall strength or weakness of the US Dollar (USD) across major currency pairs. It achieves this by calculating a weighted average of USD-related price changes over a defined lookback period and displaying the results as a color-coded histogram with optional smoothed index and signal lines. Key Features: Macro USD Sentiment Analysis:
Uses six major USD pairs ( EURUSD , USDJPY , GBPUSD , AUDUSD , USDCAD

This powerful, cycle-based market analysis indicator is inspired by the groundbreaking work of legendary forecaster Martin Armstrong and his renowned AI model, Socrates . Widely regarded as one of the most accurate economic forecasters of our time, Armstrong is known for unmatched precision and record-low drawdowns that have redefined modern market forecasting. Socratix brings key elements of his cyclical methodology to MetaTrader, enabling traders to anticipate market turning points and navigat

Elevate your chart analysis with precision visual signals. The CandleBodyArrows indicator is designed for traders who value clear, actionable chart insights. It automatically identifies significant candle movements based on user-defined thresholds and highlights them with intuitive up and down arrows. Whether you're trading trends or volatility, this tool offers an additional layer of visual confirmation that integrates seamlessly with your existing technical approach. Key Features: Highlights c
Triple Momentum Pro - The Ultimate 3-in-1 Trend Indicator for MT4 Unlock the power of Triple Momentum Pro , the all-in-one indicator that combines three powerful, customized trend-following systems into a single, easy-to-read visual tool. Stop cluttering your charts with multiple indicators and get clear, confident signals for any market and any timeframe. Key Features: Three Powerful Indicators in One: Combines a unique FollowLine trend-tracker, a classic SuperTrend , and the dynamic PMax (Prof

VertexVision Pro – Precision-Powered Trading Signals VertexVision Pro is a professional-grade trading indicator designed for MetaTrader 4 that combines intelligent price action analysis, smart trend filtering, and optional multi-timeframe (MTF) confirmation to generate high-confidence BUY and SELL signals . Whether you're a beginner or a seasoned trader, VertexVision Pro gives you the visual edge and analytical power to make confident decisions in volatile markets. Key Features: Accur

Smart Money Concepts (SMC) Indicator The SMC Indicator is an advanced market structure tool designed for traders who want to trade like institutions. It automatically detects and plots key Smart Money concepts on your chart, giving you a clear view of market intent and high-probability trade setups. Core Features Market Structure Detection – Automatically identifies Break of Structure (BOS) and Change of Character (CHoCH) to spot trend shifts and reversals. Multi-Timeframe Support – Analyz

Auto Optimized Bollinger Bands – Adaptive Volatility Tool for Real Markets Auto Optimized Bollinger Bands is an advanced MT4 indicator that improves the traditional Bollinger Bands by automatically selecting the best period and deviation values using historical trade simulation. Instead of fixed inputs, the indicator runs real-time optimization to find the most effective parameters based on actual market behavior. This allows the bands to adjust to changing volatility and price structure without
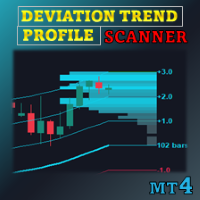
Special offer : ALL TOOLS , just $35 each! New tools will be $30 for the first week or the first 3 purchases ! Trading Tools Channel on MQL5 : Join my MQL5 channel to update the latest news from me Deviation Trend Profile Scanner (DTPS) - An indicator that detects trend direction, gauges volatility, and organises information from several symbols / timeframes in one table. It applies a configurable moving average, adaptive standard‑deviation zones, and a distribution histogram to pr
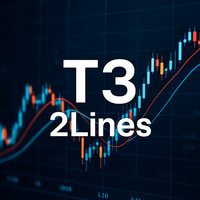
T3 2Lines – Precise Trend Analysis with Dual T3 Moving Averages “T3 2Lines” is an MT4 indicator that plots two T3 (Triple Exponential Moving Average) lines on your chart—one short-term and one long-term. By combining these two smoother moving averages, traders can gain clearer insights into trend initiation, continuation, and potential reversal zones. What This Indicator Does Displays two T3 moving average lines simultaneously (short and long term) Each line has individually configurable period
FREE

Market Structure ICT Indicator 1. Automated Market Structure The biggest advantage is reducing errors from subjective interpretation. Accurate Trend Identification: Automatically identifies BOS (Break of Structure) for trend continuation and CHoCH (Change of Character) for trend reversals. Swing Classification: Users can select the market structure type, from Short-term to Intermediate and Long-term, making it suitable for both Scalpers and Swing Traders. 2. Professional Dashboard No need to swi
Enhance your trading decisions with the Cm Ultimate Ma Mtf MT4 , a versatile moving average indicator offering extensive customization for multi-timeframe analysis. Originally inspired by popular TradingView tools and refined for MT5, it supports various MA types including SMA, EMA, WMA, HullMA, VWMA, RMA, TEMA, and Tilson T3, gaining popularity since the 2010s for its ability to plot dual MAs from different timeframes. Non-repainting and user-friendly, it highlights price crosses and MA interse

Overview The True Strength Index (TSI) indicator is a momentum oscillator plotted in a separate window on MT4. It smooths the momentum (MTM) and its absolute value through two successive Exponential Moving Averages (EMAs) and then computes their ratio multiplied by 100. TSI helps visualize trend strength and potential turning points in the market. Key Features Dual-EMA smoothing to reduce noise and produce a clean line Signal EMA overlay to assist with entry and exit timing Auto-scaled range fro
FREE

Overview of the Aroon Classic Indicator The Aroon Classic indicator is a technical tool that quantitatively identifies the emergence and persistence of trends on a chart. It uses two lines—“Aroon Up” and “Aroon Down”—to display trend strength and turning points within a range of 0–100. A higher Aroon Up value indicates a stronger uptrend, while a higher Aroon Down value indicates a stronger downtrend. Key Features Visually distinguishes trend initiation and reversal Customizable calculation peri
FREE

The Range Filtered AlgoAlpha is a technical analysis tool designed to help identify potential trading opportunities by analyzing market volatility. This Metatrader adaptation of AlgoAlpha's original TradingView indicator combines several analytical methods to provide visual market assessments.
Technical Features Utilizes Kalman filtering for price smoothing Incorporates ATR-based bands for volatility measurement Includes Supertrend elements for trend analysis Provides visual signals through co
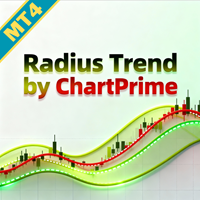
Elevate your trading strategy with the Radius Trend by ChartPrime MT4 , an advanced technical analysis tool that visualizes market trends through an adaptive, radius-based method. Unlike traditional trend lines, this indicator adjusts dynamically like a radius sweeping across the chart, creating a fluid approach to trend analysis with bands that react to price action and volatility. With dynamic outer and inner bands, it offers unique insights into trend direction, strength, and potential revers
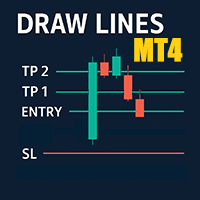
Easily draw Entry, Take Profit, and Stop Loss levels on your chart to analyse and follow trading signals. Key Features Easily input Entry, TP1, TP2, TP3 and SL values Optional vertical line to mark the exact time of the signal Custom labels and colours for each line Visually assess the accuracy and risk/reward of any signal Works with all symbols and all timeframes No repainting, no lag, just clear and stable lines Use Cases Visualise signals from Telegram, WhatsApp, or other channels A

The Big Short – Indicator for MetaTrader 4 Designed for serious traders who demand clarity and precision "The Big Short" is an exclusive MT4 indicator developed for traders looking for a clear, structured, and highly visual tool to identify key reversal zones and market entries. It’s a flexible and professional solution for short-based strategies and much more. Key Features Compatible with all symbols: forex, indices, commodities, crypto Works on all timeframes: from M1 to D1 and beyond Built-in

PipStartex is an indicator for scalping. It draws overbought/oversold price zones on the chart in the form of a channel. It also draws yellow dots on the chart when the price goes beyond the channel. When the price goes beyond this channel, it always tries to return back. Knowing this pattern, every trader can use it for trading. When the price in the oversold zone goes beyond the channel below the red zone, we open a buy deal. When the price in the overbought zone goes beyond the channel above

It's a very convenient and easy to use indicator, as well as powerful and accurate. It detects and visually displays the start of a new trend. It is presented in a two-color bar chart: one for the start of an uptrend and one for the start of a downtrend. The indicator only requires the number of bars to look at for its calculation. Calculation. a) The indicator compares the current candlestick close with the high or low of the previous candle group. If it's higher than the high, it indicates an

RSIBandsTREND is a custom trend-focused indicator that enhances the classic RSI approach by visualizing dynamic upper and lower bands based on RSI calculations.
It plots three clean bands (upper, lower, and midline) directly on the chart, helping traders identify overbought and oversold zones with precision. Features: Three-band system: upper, lower, and center RSI lines EMA-smoothed RSI band calculation Clear trend zone visualization on chart Works on all timeframes (M1 to Monthly) Fully opt

Detailed Description with screenshots here: https://www.mql5.com/en/blogs/post/763562
Features Three Hull MA Variations: Classic HMA, Exponential HMA (EHMA), and Triangular HMA (THMA) Multi-Timeframe Support: View higher timeframe Hull MA on any chart Dynamic Color Coding: Automatic trend-based color switching for easy visualization Candle Body Coloring: Color candle bodies based on Hull trend or price position Real-Time Alerts: Get notified on trend changes and candle color switches Customiza

About:
QQE Dual Pulse is best for people who are using QQE with their existing trading strategies to validate trends. It is an oscillator that combines two QQE calculations with Bollinger Band filtering to identify high-probability trading signals. This indicator helps traders spot momentum shifts and trend changes with reduced false signals.
Detailed description with screenshots is in blog post: https://www.mql5.com/en/blogs/post/763582
What is QQE and QQE Mod?
QQE original: is an enhanced

Forex Target Zones Indicator – Master Key Support & Resistance Levels
Unlock the power of precise trading with the Forex Target Zones Indicator, the ultimate tool for identifying high-probability buy and sell zones based on previous weekly and daily highs and lows. Designed for both scalpers and swing traders, this indicator highlights critical levels where price is likely to react, giving you a competitive edge in the forex market.
Key Features: Smart Weekly & Daily Zones – Instantly
FREE

Purpose : The AllAverages indicator plots a moving average line on the chart, with options to select from a wide range of MA types and price applications. It also displays buy and sell signals as arrows when the trend changes, and supports alerts (sound, email, push notifications) for these signals. Key Features : Supports multiple moving average types (e.g., SMA, EMA, HMA, TEMA, etc.). Allows customization of the price type (e.g., Close, Open, High, Low, Heiken Ashi variants). Displays a colore
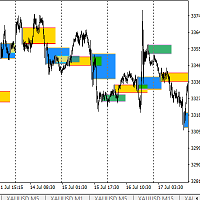
Trade are base on Breakout Session Box ( based on Time Setting ) . Can use for scalping , intraday or reversal ( based on your experience ) Can be use on M1 to M30 chart . Best use on M30 and Trade on M5 . Trade can be use buy limit/sell limit or buy stop/sell stop depend on your trading style .
Setting file are The best time setup to trade for Gold or Xauusd as per my trading style .
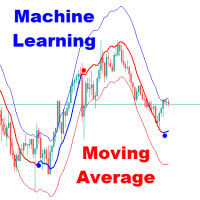
The Adaptive Gaussian Moving Average or also known as Machine Learning Moving Average (MLMA) is an advanced technical indicator that computes a dynamic moving average using a Gaussian Process Regression (GPR) model. Unlike traditional moving averages that rely on simple arithmetic or exponential smoothing, MLMA applies a data-driven, non-linear weighting function derived from the Gaussian process, allowing it to adaptively smooth the price while incorporating short-term forecasting cap
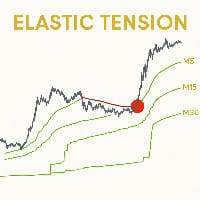
Elastic Tension MTF (M5 Only)
Индикатор многотаймфреймового натяжения цены Автор: Александр Лапин Профиль на MQL5
---
Описание
Elastic Tension MTF — это интеллектуальный авторский индикатор, основанный на концепции «упругой силы» в движении цены. Он анализирует рыночные данные с нескольких таймфреймов и визуализирует потенциальные уровни натяжения цены, отображая их на графике M5.
Индикатор моделирует поведение цены как движение под действием силы упругости, рассчитываемой по

This indicator is deliberately constructed to avoid repainting. Once a candle has closed, the output it produces remains fixed and unchanged. This behavior ensures accuracy during backtesting and provides reliability in real-time strategy execution.
Unlike traditional methods such as linear or polynomial regression, kernel-based methods don't assume any specific form or distribution for the data. Instead, they rely on a kernel function —a mathematical tool that assigns influence to each nearby

High Timeframe Exponential Moving Average (HTF EMA) Spot the Trend with Clarity – No Matter Your Timeframe!
The HTF EMA Indicator brings the power of higher timeframe analysis right onto your current chart. Whether you're trading M5,M15, H1, or any intraday timeframe, this tool overlays the Exponential Moving Average (EMA) from your chosen higher timeframe—such as H1, H4, or D1—so you can make smarter, more confident decisions.
Key Features: Displays EMA from Higher Timeframes directly o

Common Channel Index (CCI) Multi-Period Overlay Overview:
The Common Channel Index Multi-Period Overlay is a powerful -based tool that brings clarity and multi-timeframe insight into your trading decisions. By combining three different Commodity Channel Index (CCI) periods — 5 , 15 , and 60 — into a single, unified display, this indicator offers a layered view of market momentum and overbought/oversold conditions. Key Features: Triple CCI Overlay:
See short-term (5), mid-term (15), a

Keltner Channel MultiBand – Period 20 | ATR 10 | Bands 1.5, 2.0, 2.5 Unlock Precise Market Timing with Triple-Band Trend Mapping The Keltner Channel MultiBand is a powerful technical tool designed to help traders identify trend opportunities , optimize entry points , and strategically place Take Profit (TP) and Stop Loss (SL) levels. Key Features: Triple Bands (1.5x, 2.0x, 2.5x ATR) : Offers a multi-layered view of price volatility, helping you gauge the strength of market momentum with gr

CustomMultiBarFractal Indicator Description
Overview The CustomMultiBarFractal indicator identifies and displays fractal patterns on price charts. Fractals represent significant price reversal points that can serve as signals for trading strategies.
Key Features - Detects fractals based on a user-defined analysis period - Displays upper and lower fractals with customizable colors - Allows offset adjustment from price extremes - Provides flexible visualization settings - Support
FREE
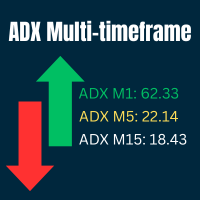
Ultimate ADX Multi-timeframe Indicator Free for limited time.
This indicator provides real-time ADX values for multiple timeframes in one unobtrusive label panel. It i s especially useful for gauging trend strength across timeframes without constantly switching charts. Choose which periods to display, anchor the panel to any chart corner, and color-code ADX strength levels to your taste. Key Features & Personalization Multi-Timeframe ADX - Toggle visibility for 9 built-in periods (M1, M5, M15,
FREE

Momentum Hunter – Advanced Non-Repainting Momentum Indicator Momentum Hunter is a powerful and reliable indicator designed to detect fresh momentum and help traders capture market moves with precision. Specially optimized for the M1 timeframe , it also works seamlessly on higher timeframe's, making it suitable for scalpers and swing traders alike. MT5 version of this indicator is available here : https://www.mql5.com/en/market/product/144628 Key Features: Non-Repainting & Non-Lagging : Signals a
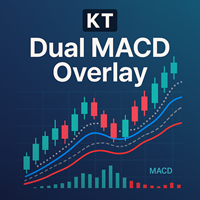
The KT Dual MACD Overlay plots two full MACD oscillators directly on your price chart, one based on the current timeframe and the other from a higher timeframe. The fast MACD captures short-term momentum, while the slow MACD keeps you in sync with the broader trend. With both layered over the candlesticks, you get a complete view of market momentum without needing to flip between charts or windows.
Buy Entries
Primary Buy Entry: A blue vertical line appears when an uptrend begins. Add-on Buy En
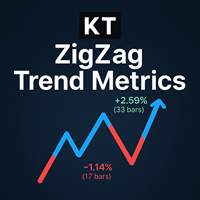
The KT ZigZag Trend Metrics turns market swings into a clear, easy to read map of trend and structure, so even beginners can spot turning points and market flow at a glance. The indicator labels each swing as a Higher High, Lower High, Lower Low or Higher Low and shows the percentage move from the previous swing. It also displays how many bars it took to form the new swing high or low. It also plots lines between each recent swing high and low, giving you an x-ray view of price action that makes

Ride the Wave of Trends — Clear Signals for Confident Following In financial markets, the most stable profits often come from clear and established trends. However, even experienced traders know that riding the trend reliably is not always easy. Ride the Trend Signal is a signal-based indicator that focuses on trend-following entries, particularly on pullbacks and retracements. Instead of jumping into the early stages of a trend, this tool waits until the trend is established and then identifies
FREE
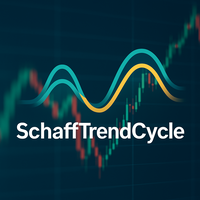
What is Schaff Trend Cycle? The Schaff Trend Cycle (STC) is an oscillator-type indicator designed to detect trend reversals in a timely manner. Compared to traditional indicators like moving averages or MACD, it combines cyclical patterns with momentum to more clearly identify the beginning and end of trends. Main Features Clear trend reversal signals: The cycle line rises in an uptrend and falls in a downtrend. Noise reduction in ranging markets: Smoothing based on cyclical timing helps filter
FREE
** All Symbols x All Time frames scan just by pressing scanner button ** After 18 years of experience in the markets and programming, Winner indicator is ready. I would like to share with you! *** Contact me to send you " Trend Finder indicator " free, instruction and add you in "M1 Signal Scanner group" for sharing or seeing experiences with other users. Introduction: M1 Signal Scanner is the indicator designed scalping M1 time frame to detect Small trend switching in the direction

2 copies left at $65, next price is $120
Scalper System is a user-friendly indicator designed to detect market consolidation zones and anticipate breakout movements. Optimized for the M1 or M15 timeframe, it performs best on highly volatile assets like gold (XAUUSD). Although originally designed for the M1 or M15 timeframe, this system performs well across all timeframes thanks to its robust, price action-based strategy.
You can visually backtest the indicator to evaluate the accuracy of its si
Learn how to purchase a trading robot from the MetaTrader Market, the store of application for the MetaTrader platform.
The MQL5.community Payment System supports transactions via PayPal, bank cards and popular payment systems. We strongly recommend that you test the trading robot before buying, for a better customer experience.
You are missing trading opportunities:
- Free trading apps
- Over 8,000 signals for copying
- Economic news for exploring financial markets
Registration
Log in
If you do not have an account, please register
Allow the use of cookies to log in to the MQL5.com website.
Please enable the necessary setting in your browser, otherwise you will not be able to log in.