Market Condition Evaluation based on standard indicators in Metatrader 5 - page 160
You are missing trading opportunities:
- Free trading apps
- Over 8,000 signals for copying
- Economic news for exploring financial markets
Registration
Log in
You agree to website policy and terms of use
If you do not have an account, please register
Forum on trading, automated trading systems and testing trading strategies
Press review
Sergey Golubev, 2016.03.23 07:43
Technical Targets for USD/JPY by United Overseas Bank (based on the article)
USD/JPY: back to 110.66
Daily price is located below 100 period SMA and 200 period SMA for the primary bearish market condition with the secondary ranging within 110.66 support level and 113.81 resistance level.
RSI indicator is estimating the secondary ranging to be continuing.
Forum on trading, automated trading systems and testing trading strategies
Press review
Sergey Golubev, 2016.03.24 05:57
NZD/USD Intra-Day Fundamentals: NZ Trade Balance and 17 pips price movement
2016-03-23 21:45 GMT | [NZD - Trade Balance]
if actual > forecast (or previous one) = good for currency (for NZD in our case)
[NZD - Trade Balance] = Difference in value between imported and exported goods during the reported month.
==========
NZDUSD M5: 17 pips price movement by NZ Trade Balance news event :
Forum on trading, automated trading systems and testing trading strategies
Press review
Sergey Golubev, 2016.03.24 07:43
Trading the News: U.K. Retail Sales (based on the article)The U.K. Retail Sales report may produce headwinds for the British Pound and drag on GBP/USD as signs of a slowing recovery provides the Bank of England (BoE) with greater scope to further delay its normalization cycle.
What’s Expected:
Why Is This Event Important:Even though BoE argues that the next policy move will be to lift the benchmark interest rate off of the record-low, the Monetary Policy Committee (MPC) may preserve its current policy throughout 2016 in an effort to mitigate the downside risks surrounding the real economy.
Nevertheless, the expansion in private-sector lending paired with the ongoing improvement in labor-market dynamics may boost household spending, and a positive development may generate a near-term rebound in GBP/USD as it puts pressure on Governor Mark Carney and Co. to normalize monetary policy sooner rather than later.
How To Trade This Event Risk
Bearish GBP Trade: Retail Sales Slips 1.0% or Greater
- Need red, five-minute candle following the GDP report to consider a short British Pound trade.
- If market reaction favors bearish sterling trade, short GBP/USD with two separate position.
- Set stop at the near-by swing high/reasonable distance from entry; look for at least 1:1 risk-to-reward.
- Move stop to entry on remaining position once initial target is hit, set reasonable limit.
Bullish GBP Trade: U.K. Consumption Beats Market Expectations- Need green, five-minute candle to favor a long GBP/USD trade.
- Implement same setup as the bearish British Pound trade, just in reverse.
Potential Price Targets For The ReleaseGBPUSD Daily
Forum on trading, automated trading systems and testing trading strategies
Press review
Sergey Golubev, 2016.03.24 11:07
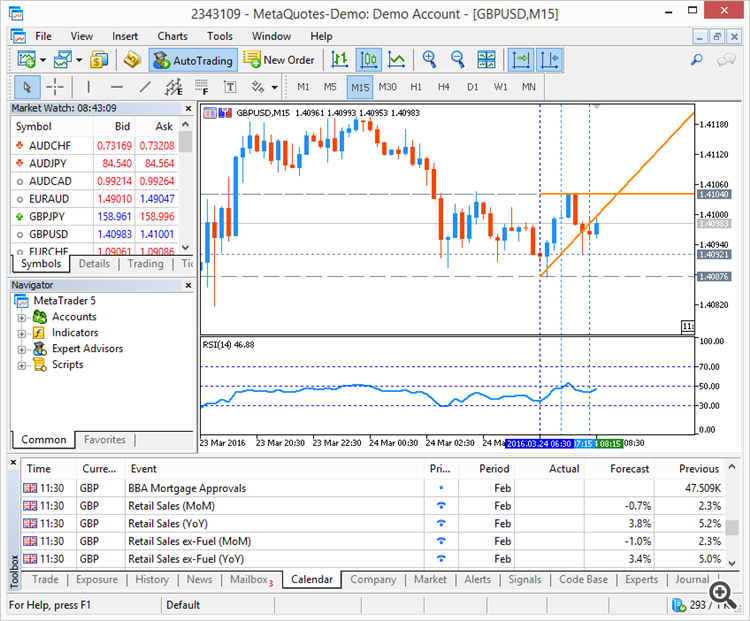
GBP/USD Intra-Day Fundamentals: U.K. Retail Sales and 31 pips range price movement
2016-03-24 09:30 GMT | [GBP - Retail Sales]
if actual > forecast (or previous one) = good for currency (for GBP in our case)
[GBP - Retail Sales] = Change in the total value of inflation-adjusted sales at the retail level.
==========
==========
GBPUSD M5: 31 pips range price movement by U.K. Retail Sales news event :
Forum on trading, automated trading systems and testing trading strategies
Press review
Sergey Golubev, 2016.03.24 11:20
Trading the News: U.S. Durable Goods Orders (based on the article)A 3.0% contraction in orders for U.S. Durable Goods may hamper the near-term advance in the greenback and spur a rebound in EUR/USD should the data print undermine Fed expectations for a ‘consumer-led’ recovery in 2016.
What’s Expected:
Why Is This Event Important:
A slowdown in private-sector consumption, one of the leading drivers of growth and inflation, may push the Federal Open Market Committee (FOMC) to further delay the normalization cycle as the weakening outlook for the global economy derails hopes for a stronger recovery.
How To Trade This Event Risk
Bearish USD Trade: Demand for Large-Ticket Items Decline 3.0% or Greater- Need to see green, five-minute candle following the release to consider a long trade on EURUSD.
- If market reaction favors a bearish dollar trade, buy EURUSD with two separate position.
- Set stop at the near-by swing low/reasonable distance from entry; look for at least 1:1 risk-to-reward.
- Move stop to entry on remaining position once initial target is hit; set reasonable limit.
Bullish USD Trade: U.S. Durable Goods Orders Exceed Market Forecast- Need red, five-minute candle to favor a short EURUSD trade.
- Implement same setup as the bearish dollar trade, just in the opposite direction.
Potential Price Targets For The ReleaseEURUSD Daily
Forum on trading, automated trading systems and testing trading strategies
Press review
Sergey Golubev, 2016.03.24 13:58
EUR/USD Intra-Day Fundamentals: Durable Goods Orders and 10 pips range price movement
2016-03-24 12:30 GMT | [USD - Durable Goods Orders]
if actual > forecast (or previous one) = good for currency (for USD in our case)
[USD - Durable Goods Orders] = Change in the total value of new purchase orders placed with manufacturers for durable goods.
==========
EURUSD M5: 10 pips range price movement by Durable Goods Orders news event :
Forum on trading, automated trading systems and testing trading strategies
Forecast for Q1'16 - levels for GOLD (XAU/USD)
Sergey Golubev, 2016.03.24 16:05
I was reading some article in Forbes and it was stated that 'it is the time to invest in silver'. So, let's evaluate the situation with SILVER (XAG/USD) compare with GOLD (XAU/USD).
GOLD (XAU/USD daily). Correction to bearish reversal. Daily price is located above Ichimoku cloud for the primary bullish market condition: the price is breaking 1215.24 support level to below for the secondary correction to be started with 1190.86 key bearish reversal support level as the next target.
If D1 price will break 1215.24 support level on close bar so the secondary correction within the primary bullish trend will be started with 1190.86 as the next target.
If D1 price will break 1190.86 support level so we may see the reversal of the price movement from the primary bullish to the primary bearish market condition with the secondary ranging: the price will be inside Ichimoku cloud.
If D1 price will break 1263.31 resistance level so the primary bullish trend will be continuing.
If not so the price will be ranging within the levels.
SILVER (XAG/USD daily). Bearish reversal. Daily price is located near and above Senkou Span line which is the virtual border between the primary bearish and the primary bullish on the chart: the price is breaking 15.17 key support level for the reversal of the price movement to the primary bearish market condition. Chinkou Span line is crossing the price to below on open daily bar for good bearish reversal breakdown to be started in the near future.
If D1 price will break 15.17 support level on close bar so the reversal of the price movement from the primary bullish to the primary bearish market condition will be started.
If D1 price will break 16.12 resistance level so the primary bullish trend will be continuing.
If not so the price will be ranging within the levels.
General Conslusion.
As we see from the charts above - the Silver is on bearish reversal on open bar for now, and we may see the bearish breakdown in short-term situation. The Gold is on correction within the bullish, and the bearish reversal may be possible but in the medium-term situation for example.
To make it shorter
Do not invest in silver in the near future.
Forum on trading, automated trading systems and testing trading strategies
Press review
Sergey Golubev, 2016.03.25 08:43
EUR/USD - Long-Term Forecast: more bearish in a long-term for 0.95 target at year-end
Morgan Stanley made a long-term forecast concerbning the price movement for EUR.USD pair related to the end of this year:
So, let's describe some of the interesting moments for EURUSD.
------------------
EURUSD
W1 price is on primary bearish market condition located to be below 100 period SMA and 200 period SMA area with the secondary ranging within 1.1713 key bullish reversal resistance level and 1.0516 key bearish support level.
Most likely scenario:
Forum on trading, automated trading systems and testing trading strategies
Press review
Sergey Golubev, 2016.03.25 14:18
EUR/USD Intra-Day Fundamentals: U.S. Gross Domestic Product and 10 pips range price movement
2016-03-25 12:30 GMT | [USD - Final GDP]
if actual > forecast (or previous one) = good for currency (for USD in our case)
[USD - Final GDP] = Annualized change in the inflation-adjusted value of all goods and services produced by the economy.
==========
"Real gross domestic product -- the value of the goods and services produced by the nation's economy less the value of the goods and services used up in production, adjusted for price changes -- increased at an annual rate of 1.4 percent in the fourth quarter of 2015, according to the "third" estimate released by the Bureau of Economic Analysis. In the third quarter, real GDP increased 2.0 percent."
==========
EURUSD M5: 10 pips range price movement by U.S. Gross Domestic Product news event :
Forum on trading, automated trading systems and testing trading strategies
Press review
Sergey Golubev, 2016.03.26 10:59
EUR/USD: Stuck In Range; Focus On Next Week's NFP - The Bank of Tokyo-Mitsubishi UFJ (based on the article)
EUR/USD: correction to bearish reversal. Daily price is on the secondary correction within the primary bullish market condition: the price is located near and above Ichimoku cloud and Senkou Span line which is the virtual border between the primary bearish and the primary bullish trend on the chart. If the price breaks 1.1143 key support level on the daily close bar so the bearish reversal will be started with the secondary ranging: the price will be located inside Ichimoku cloud. If the price breaks 1.1342 resistance level so the bullish trend will be continuing. Chinkou Span line is located near and above the price to be ready to break it to below for the good possible bearish breakdown.
There are the following news events which will be affected on EUR/USD price movement for the week: