EURUSD Technical Analysis 2015, 13.12 - 20.12: ranging on reversal
Forum on trading, automated trading systems and testing trading strategies
Sergey Golubev, 2015.12.14 09:02
FOMC Preview: taking it easy - we expect the FOMC adopt a dovish tone - Credit Suisse (based on the article)
- "The Committee likely will increase its fed funds rate target
range by 25bp, but we expect the FOMC adopt a dovish tone in its
guidance about the future path of policy."
- "Vehicles by which the FOMC can communicate gradual policy normalization going forward include the official policy statement, the dot plot, and Fed Chair Yellen's post-meeting press conference."
- "Assuming policy liftoff this month, we look for three more rate hikes in 2016, with the first coming at the March meeting, at the earliest. Current market pricing is for two rate hikes next year, though this may increase once investors absorb the reality of a new tightening cycle."
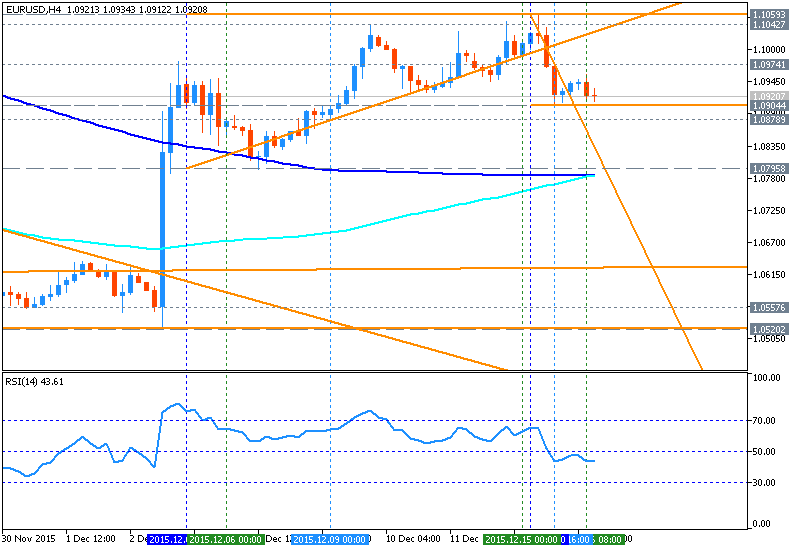
H4 price is located above 200 period SMA and 100 period SMA for the primary bullish ranging between 50.0% Fibo support level at 1.0783 and Fibo resistance level at 1.1042. RSI indicator is estimating the ranging bullish market condition to be continuing.
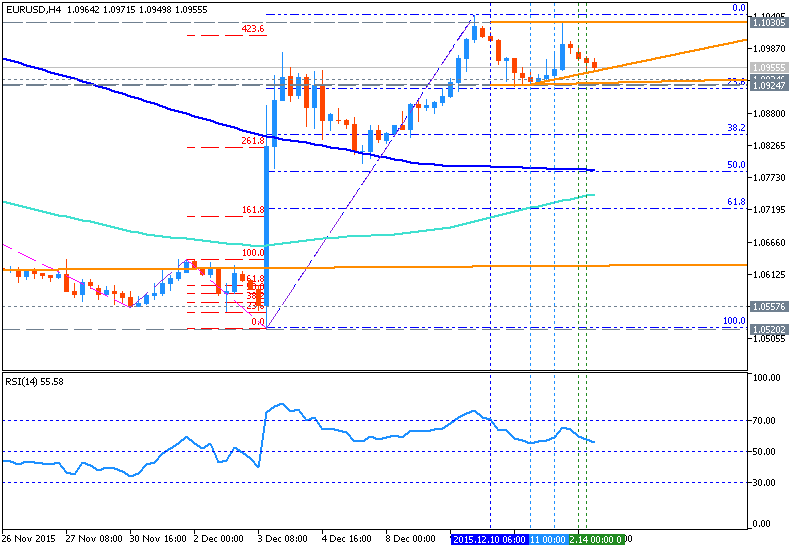
If the price will break 50.0% Fibo
support level at 1.0783 on close H4 bar so we may see the reversal of the price movement from the primary bullish to the primary bearish market condition with the secondary ranging.
If the price will break Fibo resistance level at 1.1042 from below to above so the primary bullish market condition will be continuing.
If not so the price will be ranging within the levels.
Trend:
EURUSD Intra-Day Technical Analysis - bullish with the ranging within key reversal s/r levels
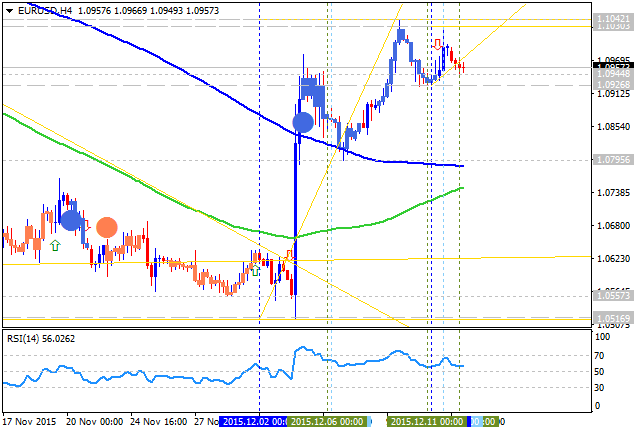
H4 price is located above SMA with period 100 (100-SMA) and SMA with the period 200 (200-SMA) for the primary bullish market condition with the secondary ranging within the following key reversal support/resistance levels:
- 1.1042 resistance level located in the primary bullish area of the chart, and
- 1.0795 support level located on the border between the primary bearish and the primary bullish trend of intra-day chart.
RSI indicator is estimating the current trend as the ranging bullish market condition.
- If the price will break 1.1042 resistance level so the primary bullish trend will be continuing without secondary ranging.
- If price will break 1.0795
support so the reversal of the price movement from the primary bullish
to the primary bearish condition will be started with the secondary
ranging and with 1.0623 level as the next bearish target.
- If not so the price will be ranging within the levels.
| Resistance | Support |
|---|---|
| 1.1030 | 1.0795 |
| 1.1042 | 1.0623 |
- Recommendation to go short: watch the price to break 1.0795 support level for possible sell trade
- Recommendation to go long: watch the price to break 1.1042 resistance level for possible buy trade
- Trading Summary: ranging
SUMMARY : ranging
Forum on trading, automated trading systems and testing trading strategies
Sergey Golubev, 2015.12.14 14:22
EUR/USD: short-term strategy, long-term strategy and the levels to watch - Swiss Finance Corporation (based on the article)
- Short-term strategy: "Positive above 1.0860 with scope for retest of recent highs.Market seems not to be overly happy with EURUSD staying above 1.10. Respect 1.09-1.1050 range for now. Involve only on the extremes."
- Long-term strategy: "Daily close above 1.10/1.1020 turns our m/t model positive. We do not
get excited though and take wait-and-see approach looking for additional
confirmation that rally has further room to go."
- Levels to watch: "1.0920/860 on the downside; 1.1030/50 on the upside."
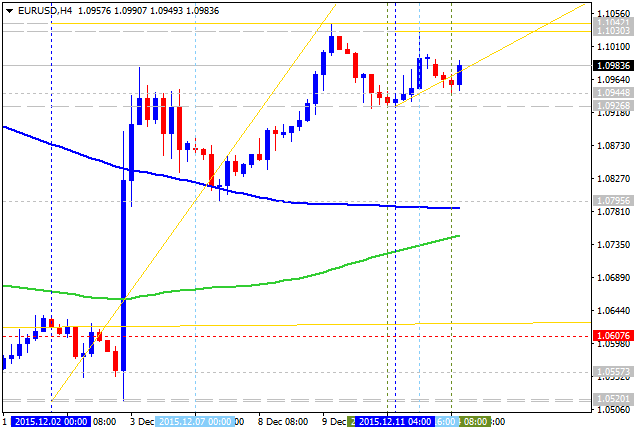
As we see from the chart above - the price (H4) is on bullish market condition for the secondary ranging within s/r levels waiting for direction:
- If the price will break 1.1042 resistance level from below to above on close H4 bar so the bullish trend will be continuing.
- If price will break 1.0926 support level from above to below on close H4 bar so the secondary correction will be started within the primary bullish market condition.
- If price will break 1.0795 support level from above to below on close H4 bar so the bearish reversal will be started with the secondary ranging.
- If not so the price will be ranging within the levels.
| Resistance | Support |
|---|---|
| 1.1042 | 1.0926 |
| N/A | 1.0795 |
- Recommendation to go short: watch the price to break 1.0926 support level for possible sell trade
- Recommendation to go long: watch the price to break 1.1042 resistance level for possible buy trade
- Trading Summary: ranging bullish
Forum on trading, automated trading systems and testing trading strategies
Sergey Golubev, 2015.12.15 09:57
EUR/USD: trading ideas by Societe Generale (based on the article)
SocGen made a long-term forecast for EUR/USD confirmed that 1.05/1.04 levels as the medium-term target will be extended in downmove to 0.96/0.95 target in the long-term situation.
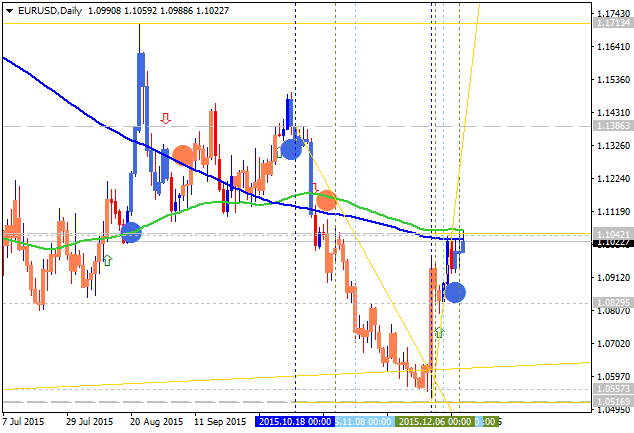
As we see from the chart above (EUR/USD, D1) - the price is on bear market rally within the primary bearish market condition: 100 SMA/200 SMA are very near to be broken by the price from below to above for the reversal of the price movement from the primary bearish to the primary bullish market condition. If the price will be bounced from 1.1042 resistance level so we may see the ranging bearish condition up to 1.0516 level as a nearest bearish target in this case.
- If the price will break 1.1042 resistance level on close daily bar so we may see the reversal of the price movement from the primary bearish to the primary bullish market condition.
- If price will break 1.0516 support so the bearish trend will be continuing up to 0.96/0.95 target.
- If not so the price will be ranging within the levels.
| Resistance | Support |
|---|---|
| 1.1042 | 1.0516 |
| 1.1386 | N/A |
- Recommendation to go short: watch the price to break 1.0516 support level for possible sell trade
- Recommendation to go long: watch close daily price to break 1.1042 resistance level for possible buy trade
- Trading Summary: ranging on reversal
SUMMARY : ranging
Forum on trading, automated trading systems and testing trading strategies
Sergey Golubev, 2015.12.15 13:13
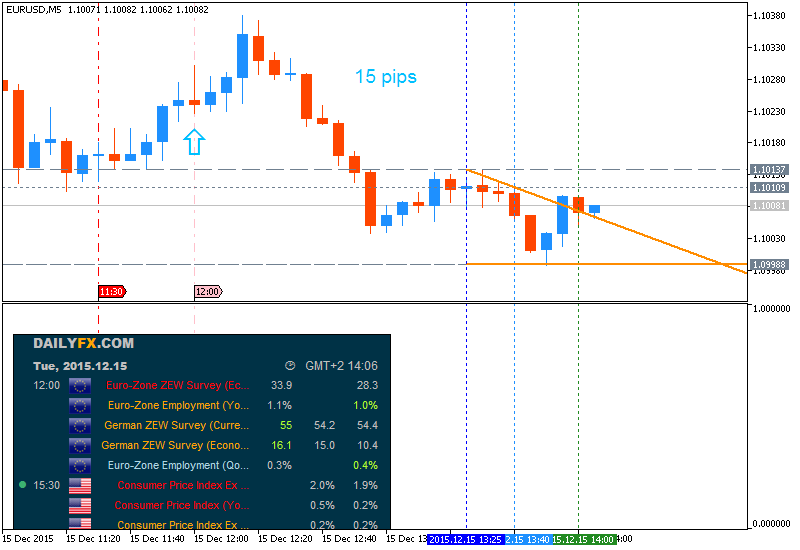
EUR/USD Intra-Day Fundamentals - German ZEW Economic Sentiment and 15 pips price movement
2014-12-15 10:00 GMT | [EUR - German ZEW Economic Sentiment]
- past data is 10.4
- forecast data is 15.2
- actual data is 16.1 according to the latest press release
[EUR - German ZEW Economic Sentiment] = Level of a diffusion index based on surveyed German institutional investors and analysts. It's a leading indicator of economic health - investors and analysts are highly informed by virtue of their job, and changes in their sentiment can be an early signal of future economic activity.
==========
The ZEW Indicator of Economic Sentiment for Germany has increased for the second consecutive time in December 2015. Gaining 5.7 points compared to the previous month, the index now stands at 16.1 points (long-term average: 24.7 points).
==========
EURUSD M5: 15 pips price movement by EUR - German ZEW Economic Sentiment news event :
Forum on trading, automated trading systems and testing trading strategies
Sergey Golubev, 2015.12.15 16:28
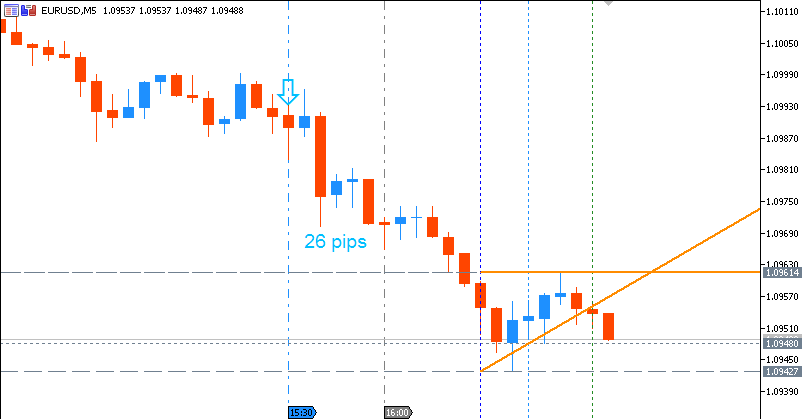
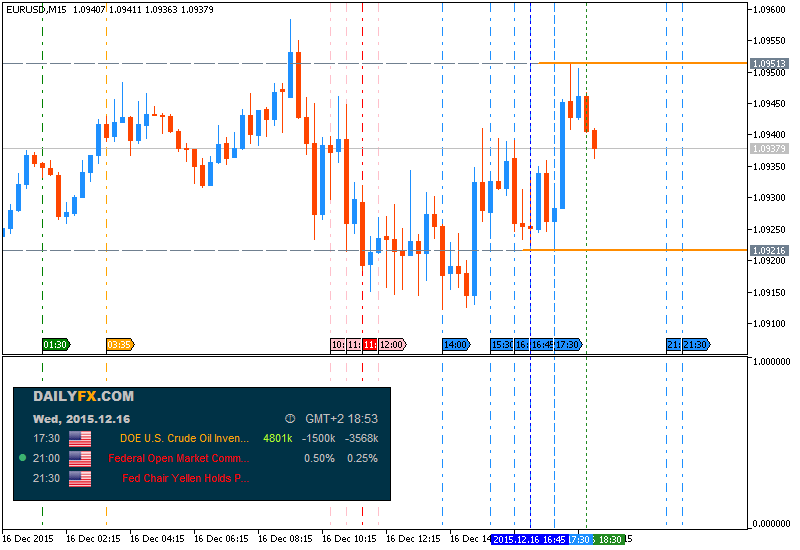
EUR/USD Intra-Day Fundamentals - Consumer Price Index (CPI) and 26 pips price movement
2014-12-15 13:30 GMT | [USD - CPI]
- past data is 0.2%
- forecast data is 0.2%
- actual data is 0.2% according to the latest press release
[USD - CPI] = Change in the price of goods and services purchased by consumers.
Consumer prices account for a majority of overall inflation. Inflation
is important to currency valuation because rising prices lead the
central bank to raise interest rates out of respect for their inflation
containment mandate.
==========
The Consumer Price Index for All Urban Consumers (CPI-U) was unchanged
in November on a seasonally adjusted basis, the U.S. Bureau of
Labor Statistics reported today. Over the last 12 months, the all items
index increased 0.5 percent before seasonal adjustment.
The index
for all items less food and energy rose 0.2 percent in November, the
same increase as in September and October. The indexes for
shelter, medical care, airline fares, new vehicles, and tobacco were
among the indexes that rose in November. In contrast, the indexes for
recreation, apparel, household furnishings and operations, and used cars
and trucks all declined.
==========
EURUSD M5: 26 pips price movement by USD - Consumer Price Index (CPI) news event :
Forum on trading, automated trading systems and testing trading strategies
Sergey Golubev, 2015.12.15 17:19
EUR/USD: short-term strategy, long-term strategy and the levels to watch - Swiss Finance Corporation (based on the article)
- Short-term strategy: "Positive above 1.0950/0860 with scope for limited gains ahead. Market is probing congested resistance in 1.1040/50 area where 100&200D SMA's converge. Sustained gains above should provide additional fuel to present rally and open door to further advance into 1.11 initially and 1.12 should the rally extend. No position at present."
- Long-term strategy: "Daily close above 1.10/1.1020 turns our m/t model positive. We do not
get excited though and take wait-and-see approach looking for additional
confirmation that rally has further room to go ( close above 100&
200D SMA)."
- Levels to watch: "1.0950/860 on the downside; 1.1050 on the upside."

The price (H4) is on bullish market condition located above 100 period SMA and 200 period SMA with the secondary ranging within the follolwing support/resistance levels:
- Fibo resistance level at 1.1059, and
- Fibo support level at 1.0914.
RSI indicator is estimating the local downtrend as the secondary correction to be started within the primary bullish market condition.
- If the price will break Fibo resistance level at 1.1059 from below to above on close H4 bar so the bullish trend will be continuing.
- If price will break Fibo support level at 1.0914 from above to below on close H4 bar so the secondary correction will be started within the primary bullish market condition.
- If not so the price will be ranging within the levels.
| Resistance | Support |
|---|---|
| 1.1042 | 1.0914 |
| 1.1059 | N/A |
- Recommendation to go short: watch close H4 price to break 1.0914 support level for possible sell trade
- Recommendation to go long: watch close H4 price to break 1.1059 resistance level for possible buy trade
- Trading Summary: possible correction
Forum on trading, automated trading systems and testing trading strategies
Sergey Golubev, 2015.12.16 09:26
EUR/USD ranges on reversal ahead of FOMC (adapted from the article)
Morgan Stanley is forecasting USD long movement against the major currencies incl TRY, BRL, AUD and CAD for example:
- "Of course, it matters what you go long USD against. We think the combination of weak commodities, stress in high yield and uncertainty about China’s FX policy may lead funding currencies to outperform."
- "The deterioration in risk sentiment is supporting our bullish JPY call, and EUR’s negative correlation to risky assets is strong, especially given the disappointing ECB announcement earlier this month."
- "Should the Fed’s messaging fail or broader macro concerns weigh on risky assets, USD is actually vulnerable against EUR, JPY and other non-commodity G10 currencies."
- "Therefore we prefer to play USD longs against AUD and CAD in G10 and select EM currencies such as TRY and BRL."
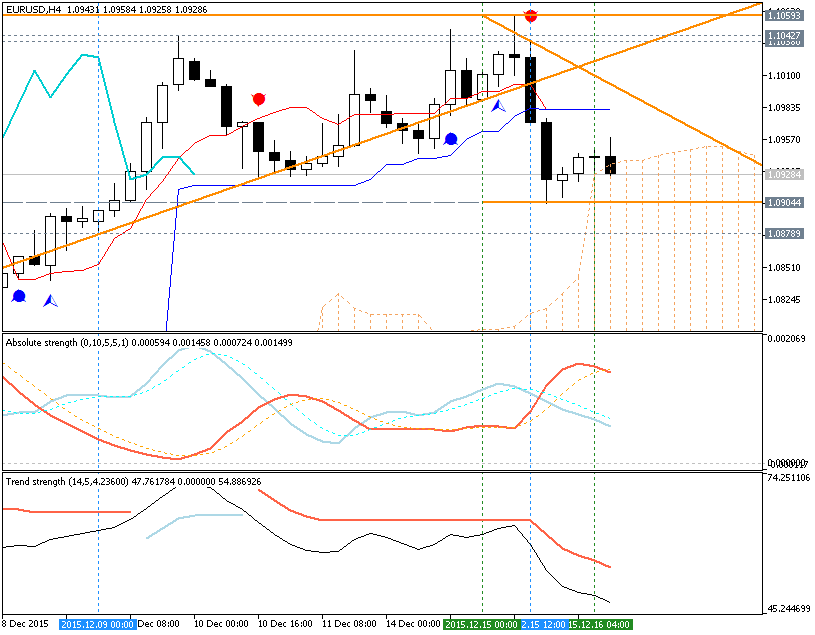
Let's describe the situation with the technical point of view.
H4 price was on the secondary correction within the primary bullish market condition: price was bounced from 1.1059 resistance level yesterday and it was stopped inside Ichimoku cloud near 1.0904 support level and Senkou Span line which is the virtual border between the primary bullish and the
primary
bearish on the chart.
- Chinkou Span line crossed the price from above to below for good possible breakdown.
- Absolute Strength indicator is estimating the ranging condition.
- Trend Strength indicator is forecasting the bearish reversal to be started soon.
- The nearest support levels are 1.0904 and 1.0878.
- The nearest resistance levels are 1.1042 and 1.1059.
| Resistance | Support |
|---|---|
| 1.1042 | 1.0904 |
| 1.1059 | 1.0878 |
If price will break 1.0904 support level on close H4 bar so we may see the reversal of the intra-day price movement from the primary bullish to the primary bearish market condition with the secondary ranging: the price will be located inside Ichimoku cloud for ranging).
If price will break 1.1059 resistance level on close H4 bar so the primary bullish trend will be continuing.
If not so the price will be ranging within the levels.
- Recommendation for long: watch close H4 price to break 1.1059 for possible buy trade
- Recommendation
to go short: watch close H4 price to break 1.0904 support level for possible sell trade
- Trading Summary: ranging on bearish reversal
SUMMARY : ranging on reversal
Forum on trading, automated trading systems and testing trading strategies
Sergey Golubev, 2015.12.16 13:34
USD, EUR/USD, AUD/USD and GBP/USD Into FOMC (adapted from the article)
Credit Suisse and Credit Agricole are forecasting the Fed rates hike for today telling that Fed will maintain a dovish tone during the FOMC Statement:
2014-12-16 19:00 GMT | [USD - Federal Funds Rate]
- past data is 0.25%
- forecast data is 0.50%
- actual data is N/A
according to the latest press release
if actual > forecast (or previous one) = good for currency (for USD in our case)
[USD - Federal Funds Rate] = Interest rate at which depository institutions lend balances held at the Federal Reserve to other depository institutions overnight. Short term interest rates are the paramount factor in currency valuation - traders look at most other indicators merely to predict how rates will change in the future.
==========
Credit Suisse, Credit Agricole and some other int'l financial institutions are forecasting the ranging volatile market condition during and after FOMC mettings because of the following:
- they predict for Federal Funds Rate actual value to be 0.50% compare with the 0.25% as the previous one, and if actual > forecast (or previous one) = good for currency (for USD in our case), but
- they are expecting less hawkish (more dovish tone) during the FOMC Statement, and as we know: less hawkish is bad for currency (for USD in our case).
Thus, we may see the ranging condition in intra-day basis for the major currency pairs.
What does it mean for EUR/USD, AUD/USD and GBP/USD for example?
==========
EUR/USD H4: Ranging. The price is on ranging condition located near and above 100 SMA/200 SMA within the following key reversal support/resistance levels:
- 1.1059 resistance located above 100 SMA/200 SMA in the bullish area of the chart, and
- 1.0520 support level located below 100 SMA/200 SMA in the primary bearish area of the chart.
According to above mentioned forecast - the price will continuing with the ranging condition within the levels.
==========
AUD/USD H4: Ranging on bearish reversal. The price is on ranging condition located near 200 SMA on the border between the primary bearish and the primary bullish trend on the chart within the following key reversal support/resistance levels:
- 0.7384 resistance located above 100 SMA/200 SMA in the bullish area of the chart, and
- 0.7159 support level located below 100 SMA/200 SMA in the primary bearish area of the chart.
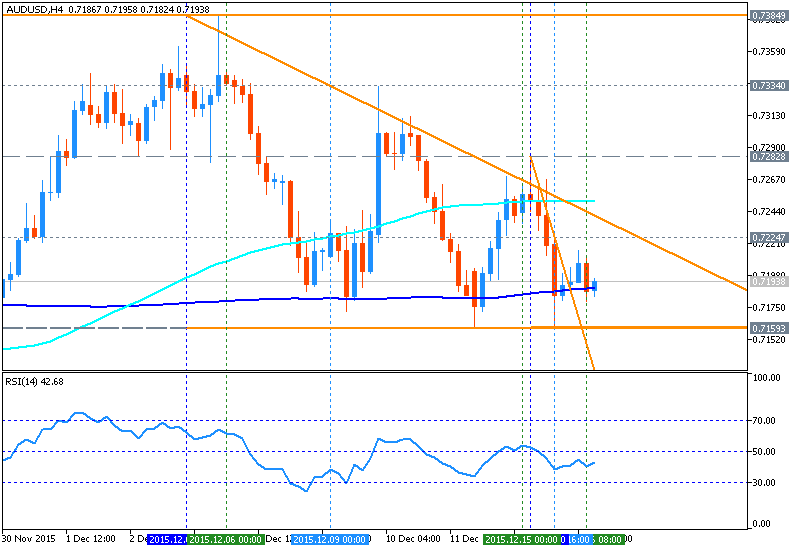
Thus, we can foresee the price to break 200 SMA from above to below for 0.7159 as the next bearish target which means the reversal of intra-day price movement to the primary bearish market condition.
==========
GBP/USD H4: Ranging. The price is located near and below 100 SMA/200 SMA for the ranging market condition within the following key reversal support/resistance levels:
- 1.5239 resistance located above 100 SMA/200 SMA in the bullish area of the chart, and
- 1.4894 support level located below 100 SMA/200 SMA in the primary bearish area of the chart.
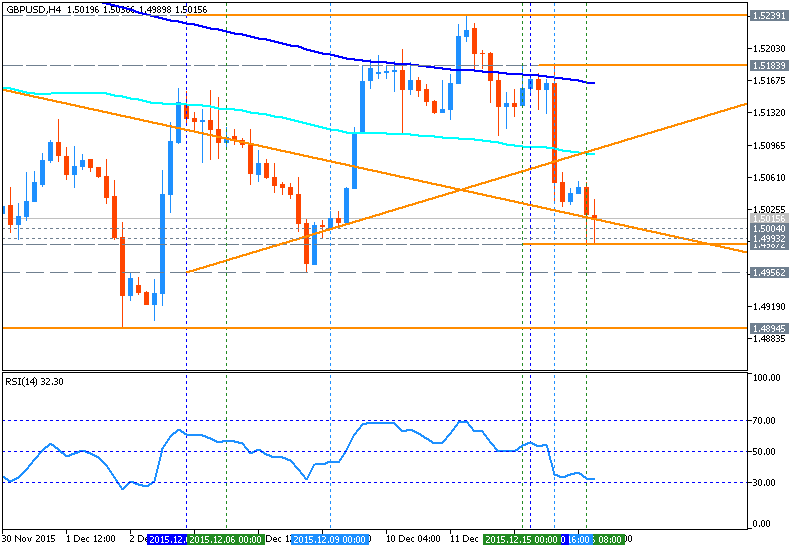
The most likely scenario for the intra-day price is to be moved during and immediate after FOMC meetings with the ranging condition within the levels, and in long-term situation - bearish market condition by 1.49/1.48 support area to be broken.
Forum on trading, automated trading systems and testing trading strategies
Sergey Golubev, 2015.12.16 18:11
Trading News Events: Federal Open Market Committee (FOMC) Interest Rate Decision (based on the article)
Based on Fed Funds Futures, market participants are pricing a 76%
probability for a rate-hike a the Federal Open Market Committee’s (FOMC)
December 16 interest rate decision, and the fresh updates coming out of
the central bank may instill a bullish U.S. dollar outlook for 2016
should Chair Janet and Co. outline a more detailed exit-strategy.
What’s Expected:
Why Is This Event Important:
Even though the FOMC remains on course to shift gears, a split decision
to implement higher borrowing-costs accompanied by a downward revision
in the central bank’s updated forecasts may drag on rate expectations,
and the dollar stands at risk of facing near-term headwinds over the
remainder of the month should the ‘data dependent’ Fed highlight a
wait-and-see approach for the year ahead.
However, subdued wage growth paired with the ongoing weakness in
household consumption may push the FOMC to temper market expectations,
and the greenback may struggle to hold its ground should the committee
outline a more shallow path for interest rates.
How To Trade This Event Risk
Bullish USD Trade: Fed Lifts Benchmark Interest Rate, Warns of Higher Borrowing-Costs in 2016
- Need red, five-minute candle following the rate decision to consider a short EUR/USD position.
- If market reaction favors a bullish dollar trade, sell EUR/USD with two separate position.
- Set stop at the near-by swing high/reasonable distance from cost; at least 1:1 risk-to-reward.
- Move stop to entry on remaining position once initial target is met, set reasonable limit.
- Need green, five-minute candle to favor a long EUR/USD trade.
- Implement same strategy as the bullish dollar trade, just in the opposite direction.
EURUSD Daily
- Despite bets for the first Fed rate-hike in nearly a decade, the near-term rally in EUR/USD following the European Central Bank (ECB) interest rate decision may gather pace in the days ahead especially as the Relative Strength Index (RSI) appears to be breaking out of the bearish formation carried over from back in August.
- Interim Resistance: 1.1052 (November high) to 1.1090 (50% retracement)
- Interim Support: Interim Support: 1.0380 (78.6% expansion) to 1.0410 (61.8% expansion)
- Free trading apps
- Over 8,000 signals for copying
- Economic news for exploring financial markets
You agree to website policy and terms of use
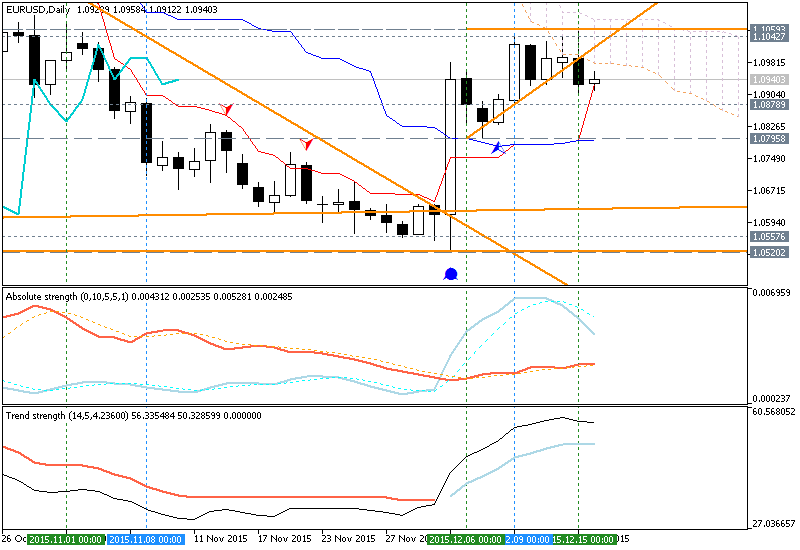
Daily price was on local uptrend as the bear market rally within the primary bearish market condition: the price broke resistance levels on the way to uptrend, and it was stopped near & below Ichimoku cloud and 'reversal' Senkou Span line which is the virtual border between the primary bearish and the primary bullish trend on the chart.
The price is started to be ranging within the following key support/resistance lines:
Chinkou Span line is crossing the price to above for the possible bullish reversal, Trend Strength indicator is estimating the local uptrend to be continuing, and Absolute Strange indicator is evaluating the price movement as the secondary ranging condition to be started.
If D1 price will break 1.0795 support level on close bar so the bearish trend will be continuing with secondary ranging up to 1.0520 level as the next bearish target.
If D1 price will break 1.1052 resistance level on close bar from below to above so the reversal of the price movement from the primary bearish to the ranging bullish condition will be started.
If D1 price will break 1.1494 resistance level on close bar so the price will be fully reversed to the bullish market condition located to be above Ichimoku cloud in the bullish area of the chart.
If not so the price will be on ranging within the levels.
SUMMARY : ranging within reversal area
TREND : ranging