MetaTrader 5 Python User Group - how to use Python in Metatrader
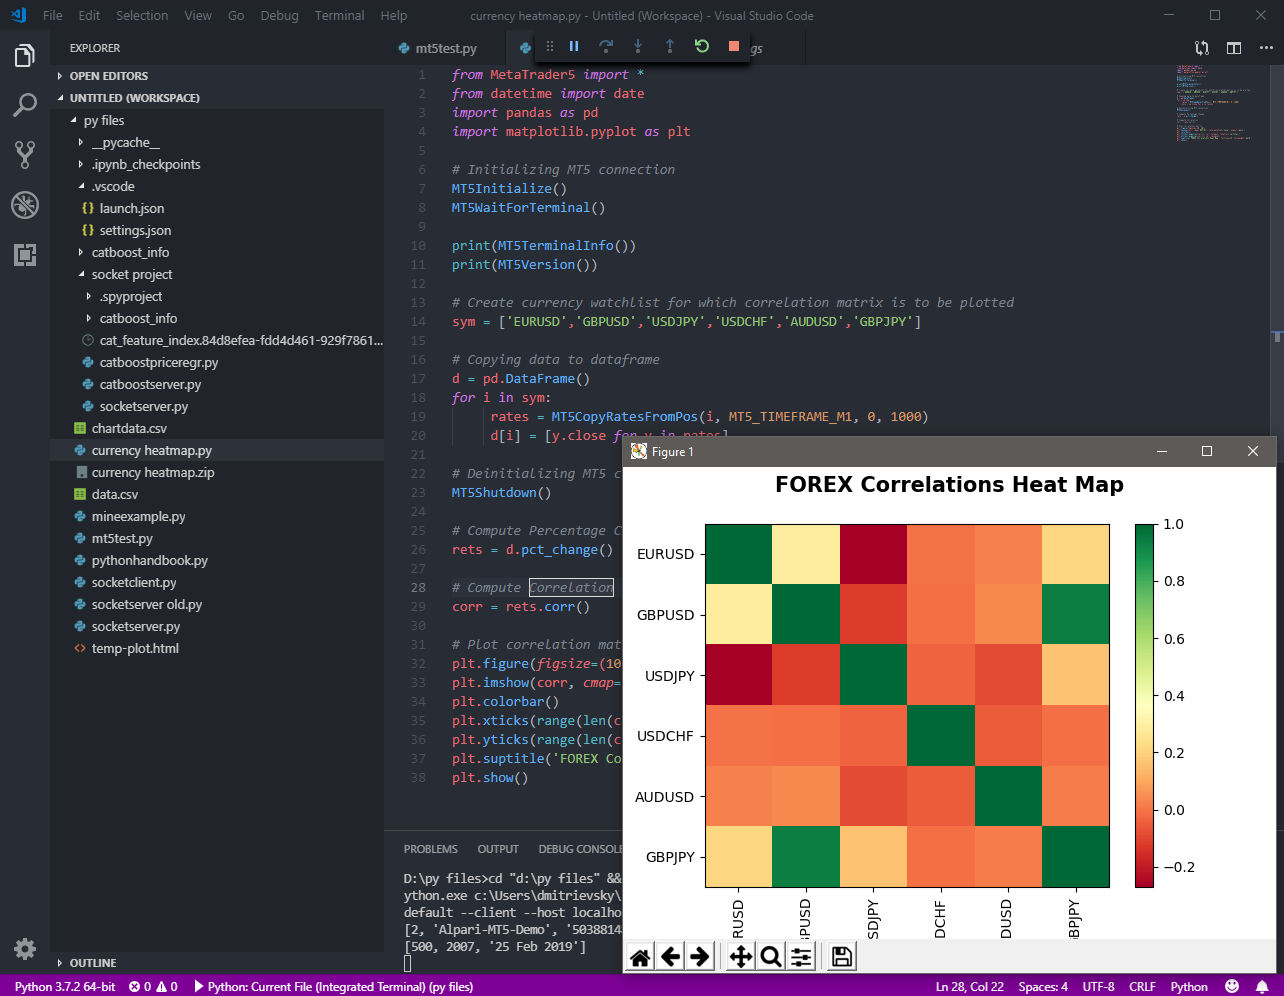
An example of a quick drawing of a correlation matrix:
from MetaTrader5 import *
from datetime import date
import pandas as pd
import matplotlib.pyplot as plt

# Initializing MT5 connection
MT5Initialize()
MT5WaitForTerminal()

print(MT5TerminalInfo())
print(MT5Version())

# Create currency watchlist for which correlation matrix is to be plotted
sym = ['EURUSD','GBPUSD','USDJPY','USDCHF','AUDUSD','GBPJPY']

# Copying data to dataframe
d = pd.DataFrame()
for i in sym:
     rates = MT5CopyRatesFromPos(i, MT5_TIMEFRAME_M1, 0, 1000)
     d[i] = [y.close for y in rates]

# Deinitializing MT5 connection
MT5Shutdown()

# Compute Percentage Change
rets = d.pct_change()

# Compute Correlation
corr = rets.corr()

# Plot correlation matrix
plt.figure(figsize=(10, 10))
plt.imshow(corr, cmap='RdYlGn', interpolation='none', aspect='auto')
plt.colorbar()
plt.xticks(range(len(corr)), corr.columns, rotation='vertical')
plt.yticks(range(len(corr)), corr.columns);
plt.suptitle('FOREX Correlations Heat Map', fontsize=15, fontweight='bold')
plt.show()
When a history request comes from Python, is the corresponding hst and tkc generated in Terminal?
I would like to understand how it is possible to work with a thousand symbols simultaneously(AMPGlobalUSA-Demo), for each of which a hundred megabytes' worth of ticks are loaded.
If anyone knows, show me how to quickly create a semblance of MT5 chart from historical data in Python. I.e. interactive, not a static picture.
https://plot.ly/~pari/67/stock-chart-for-netflix-inc/#//
https://plot.ly/python/candlestick-charts/
plot.ly in general
https://plot.ly/~pari/67/stock-chart-for-netflix-inc/#//
https://plot.ly/python/candlestick-charts/
plot.ly in general.
I'm a complete zero in Python. I would like to get a motivational push that shows the simplicity and usability of MT5-Python. There will be an example of such a connection, please share the code.
It looks very cool. Would like to see a working code for MT5.I am a complete zero in Python. Would like to get a motivational push that sees the simplicity and usability of MT5-Python. There will be an example of such a connection, please share the code.
I'm for MO mostly, hardly ever visualise anything. Modern MO stuff is unrealistic to rewrite naturally, only use ready-made. I.e. the obvious motivation for me is this.
It looks very cool. I would like to see a working code for MT5.
can be coded later... in fact there are ready examples in the links
Sometimes I need to quickly view the ticks in more or less handy form, I use ZoomPrice indicator for that. But visualization is much better on links. If it is very simple to transfer from MT5 to Python and get a cool tick chart - that's not a bad motivation for many people.
At the moment any info (other than quotes) can be sent/returned via real-time sockets. The only limitation is that they don't work in the tester yet.
At the moment any info (other than quotes) can be sent/returned via real-time sockets. The only limitation is that it doesn't work in the tester yet.
Unfortunately, without source codes, this feature is just words to me. Very much I don't know, and the start of self-study should probably be something practical to start with, which can be spun right away.
- Free trading apps
- Over 8,000 signals for copying
- Economic news for exploring financial markets
You agree to website policy and terms of use
We are preparing MetaTrader 5 module for Python.
As with the R package, we are testing on simple functions to extract data from a running copy of the terminal.
How you can test how it works:
Test code:
We will add more functions later and place the package in a public repository of Python packages, so you can install it normally.