Something Interesting in Financial Video March 2014
Average True Range (ATR) for Intraday Trading
Other video :
- Breakouts with the ATR
- Trading Risk Management - Tight Stops
- How to Use the Average True Range (ATR) To Set Stops
- Money Management and ATR explained
Forum on trading, automated trading systems and testing trading strategies
Indicators: Average True Range (ATR)
newdigital, 2013.08.29 09:18
Average True Range (ATR) Technical Indicator
Developed by J. Welles Wilder
The Average True Range (ATR) indicator is a measure of volatility. The ATR indicator measures the range of price movement for a particular price period. The ATR is a directionless indicator and it does not indicate the direction of the Forex trend.
High ATR values indicated market bottoms after a sell off.
Low ATR values
Low ATR values indicated extended periods of sideways price movement- Price Range, such as those found at market tops and consolidation periods. Low ATR values are typical for the periods of sideways movement of long duration which happen at the top of the market and during consolidation.
Calculation
The ATR is calculated using the following:
- Difference between the current high and the current low
- Difference between the previous closing price and the current high
- Difference between the previous closing price and the current low
The final Average is calculated by adding these values and calculating the average.
The indicator of Average True Range is a moving average of values of the true range
Technical Analysis of True Average Range (ATR)
True Average Range can be interpreted using the same principles as other volatility indicators.
Possible trend change signal - The higher the value of the ATR indicator, the higher the probability of a trend change;
Measure of trend momentum - The lower the indicator’s value, the weaker the trend movement.
Forum on trading, automated trading systems and testing trading strategies
newdigital, 2013.10.23 18:52
An Easy and Advanced Way to Set Stops
Talking Points:
- Stops are a necessity because no trading strategy wins 100% of the time
- Traders can use ATR to calculate stop distances based on recent price activity
- Price Action can be used to set stops in trending, or ranging market environments
But in the field of trading, risk management isn’t just a preference; it’s a necessity.
And the reason for this is simple: Because you cannot tell the future. And this means that no matter how hard you try, or how great a trader you become, you will simply never be able to avoid losing entirely. And as a natural extension of that fact, since you will lose on some trades, having sloppy risk management means that one or two losers can wipe away the gains of many small winners.
I know this may sound too simplistic; but this is exactly what was found to be The Number One Mistake that Forex Traders Make: They often win more frequently than they lose - but they lose so much when they are wrong that it wipes away all of the gains from their winners and then some.
Average losses (in red) far outpace average wins (in blue) :
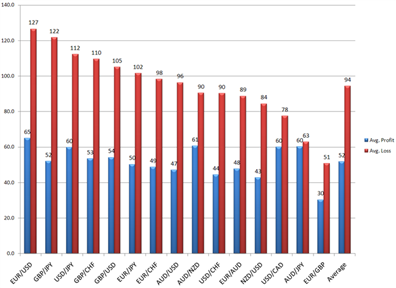
The first step to avoiding The Number One Mistake Forex Traders Make is to set a stop. This allows you to cap the risk on any one trade, so that if it doesn’t go in your direction, you can stem the bleeding before it becomes too unbearable.
Below, we’re going to look at two popular, yet different ways of setting stops. One easy way that is often employed by professional traders for the sake of simplicity; and another more advanced method that may suit certain trading styles more adequately.
The Easy Way
First off, just because this is an easier way of setting a stop does not make it any less valid. This is classified as ‘the easy way’ simply because most traders can pick this up right now, and begin using it instantly with a minimum of instruction.
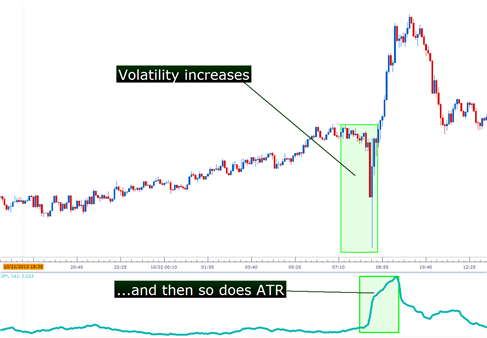
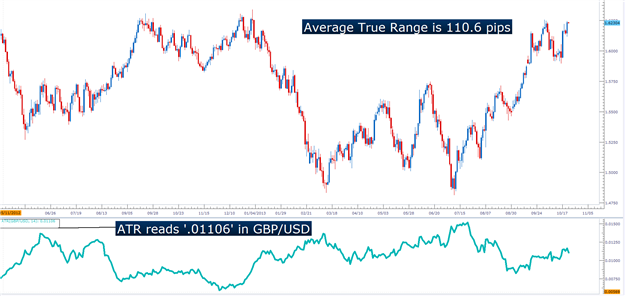
Average True Range is a favorite indicator of many professional traders, and one of the great things about it is that it’s rather simple in its design. While many indicators wear multiple hats and try to do a few different things at once, ATR is just a measure of price movements over a specific period of time.
If those movements increase in value, ATR goes up. If those movements decrease, ATR goes down (see below).
ATR measures volatility, and this allows traders to set stops based actual market behavior :
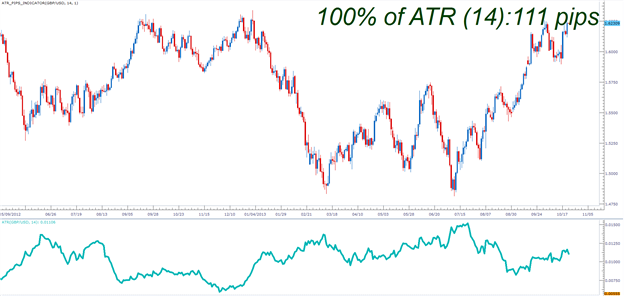
There are a few nuances of ATR that traders need to know before applying. We cover these, in depth in the article Managing Risk with ATR. The first is the format with which the indicator displays values. While it looks like an oscillator like RSI, and moves similar to an indicator like ADX; the real value of ATR is in its value. It will measure the ‘Average True Range’ of the last x periods, where x is the input you choose. The default, and most common input for ATR is 14 periods. The value of ATR will read in the price format of the currency pair being analyzed. So, for instance; if a value of .00760 is shown on EURUSD, that means 76 pips (4th place to the right of the decimal is a single pip in the quote).
ATR displays values in the format of the currency pair’s price :

There is a slightly easier option, and for traders that are using short-term techniques this can be extremely helpful. There is a custom indicator available for Trading Station desktop that automatically calculates, and displays ATR on the chart in a very easy-to-read format. This is completely free, and can be downloaded from the FXCM App Store at this link (link). As you can see below, not only does it display ATR, but it even rounds the ‘.6’ fractional pip as appropriate.
The ‘ATR_Pips’ Indicator displays Average True Range in an easy-to-read format :
The Advanced Way
Price Action can have a huge impact on a trader’s performance. Inclusion of price action into an approach will often take place regardless of the trader or type of trading being done. Price action can help traders read trends, find support and resistance, and perhaps most importantly - manage risks.
Because, after all - if prices are trending higher, and we’re seeing continuous higher-highs, and higher-lows, wouldn’t it be reasonable to consider closing the trade if the trend reversed?
Remember, this is the number one mistake traders make, and this is the reason stops are so important. If the trend reverses, the trader’s best advice is often to close the trade and look for greener pasture elsewhere... because if the reversal continues against the trader, one loss can wipe away a lot of gains.
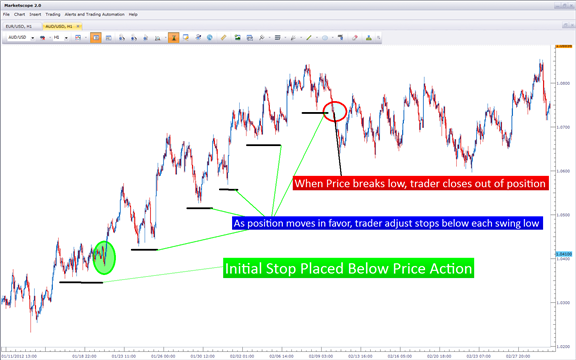
If traders are trading a trend, they can look to the previous opposing-side swing for stop placement. So, if an up-trend is being traded, we should be able to see higher-highs, and higher-lows. If we are buying to take part in the up-trend, we can look to place our stop below the prior swing-low (see picture).
During an up-trend, stops can be placed below the previous swing-low :
On the other hand, if we’re selling in a down-trend, we would want to look to place our stop above the prior swing-high.
During down-trend, stops can be placed above the previous swing-high
In How to Analyze and Trade Ranges with Price Action, we look at stop placement in
range-bound markets. If a range is being traded, the ‘peak-high’ and ‘peak-low’ should be identified (see below).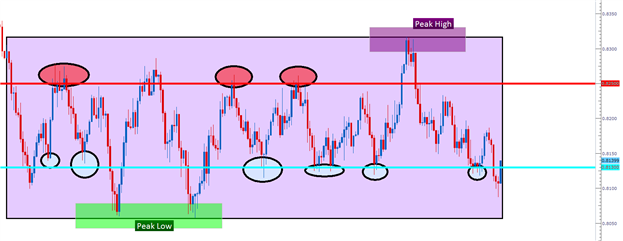
Traders can look to place their stop just outside of the peak of the opposing side of their position. So, if buying, traders would look to place their stop just below the peak-low; and if selling just above the peak-high. This way, if the range turns into a breakout against the trader, the bleeding can be stopped before one loser wipes away the gains from a lot of winners.
If you’d like to become a better Price Action trader, we’ve put together the basics into a Brainshark curriculum. The link below will take you directly to the lesson, and after filling in a few pieces of information into the guestbook the session will begin.
Ichimoku technical analysis & online day trading strategies
In this online trading education course, Ichimoku Kinko Hyo (Pronounced: Ichiii...Mooooo...Kuuuu) is a technical trend based system that powerfully illustrates support and resistance values in a simplified form and is considered an extension of the very popular candlestick charting system. In fact, this system was built on the idea that at "one glance" you should be able to easily determine whether an instrument is in equilibrium (consolidation) or out of equilibrium (trending).
More video on this subject:
- Ichimoku - about this indicator in general, what every line of this indicator means.
- Ichimoku cloud, how to use it with trading
- Ichimoku Trading - Ichimoku Training - Support and Resistance with the Ichimoku Cloud Trading
- Kumo Breakout Trading with the Ichimoku System.
- Ichimoku vs Moving Average Trade Analysis.
- Ichimoku vs Moving Average Trade Analysis
- Technical Analysis Course - Module 10: Cloud Charts: the Ichimoku Technique
- Ichimoku - Drawbacks Of Ichimoku Kinko Hyo
- Ichimoku - Ideal Ichimoku ScenariosIchimoku - Kumo Cloud Studies I
- Ichimoku - Multiple Confirmation
==============
Ichimoku threads/posts on mql5.com forum
- The theory of the signals
- Ichimoku alert indicator with arrows
- Ichimoku alert indicator improved : warning alert mode was fixed and autosettings feature was added
=============
Ichimoku indicator description
- Tenkan Sen - moving average of the highest high and lowest low over the last 9 trading days. (Highest high + Lowest low) / 2 over the last 9 trading days
- Kijun Sen - moving average of the highest high and lowest low over the last 26 trading days. (Highest high + Lowest low) / 2 over the last 26 trading days.
- Senkou Span A - the average of the Tenkan Sen and Kijun Sen, plotted 26 days ahead. (Tenkan Sen + Kijun Sen) / 2 plotted 26 days ahead
- Senkou Span B - the average of the highest high and lowest low over the last 52 days, plotted 26 days ahead. (Highest high + Lowest low) / 2 over the last 52 trading days plotted 26 days ahead.
- Chikou Span - the closing price plotted 26 days behind.
=============
Forum on trading, automated trading systems and testing trading strategies
Something Interesting to Read February 2014
newdigital, 2014.02.25 16:46
Cloud Charts : Trading Successful with the Ichimoku Technique by David Linton
David Linton, the author of Cloud Charts, had his interest in Ichimoku charts `sparked' during a presentation by Rick Bensignor at the 2004 IFTA conference in Madrid. David had heard of the method prior to the conference but credits Rick with presenting it in an `understable' way. David set out on a quest for Ichimoku knowledge. He researched the internet, questioned Japanese delegates at subsequent IFTA conferences, sought out Rick Bensignor at conferences and meetings and even flew to Tokyo. The fruit of that quest is the book, Cloud Charts.
The Ichimoku method is now fast becoming popular in Western trading rooms and is available on almost all technical analysis software. David must take some credit for turning what seemed to be an exotic and complicated method into an easily understandable and robust trading and analysis tool for non-Japanese speaking technical analysts.
So, what is Ichimoku? The full name of the method is Ichimoku Kinko Hyo which means 'at one glance balance bar chart'. Ichimoku charts were devised by Goichi Hosoda , a Tokyo journalist, who believed that once the method was fully understood, one could comprehend the exact state of a market at a glance. Most of the Ichimoku indicators represent equilibrium in one time frame or another and price action is generally analysed with regard to whether the market is in equilibrium, moving away from it or reverting back to it. By their nature, the various indicators also offer dynamic areas of support or resistance.
Cloud Charts is divided into three parts. The first is for the novice technical analyst and is designed to give them an understanding of many basic technical analysis concepts involved with not only Ichimoku analysis but also traditional techniques. More experienced technical analysts may wish to skip this part.
Part two introduces the reader to the basic indicators used in Ichimoku charts (David calls them cloud charts). This section deals with the derivation and interpretation of:
1. The Turning Line (also called the Conversion Line)
2. The Standard Line ( also called the Base Line)
3. The Cloud Span A ( also called the Cloud Span 1)
4. The Cloud Span B (also called the Cloud Span 2)
5. The Lagging Line ( also called the Lagging Span)
Part two offers a guide to applying Ichimoku charts in a multiple time frame sense, as well as the often overlooked Wave Principle, Price Targets and Time Span Principle. However, the application of Ichimoku charts to price and time projection is very subjective and for that reason alone the projections are quite often not utilised by even experienced analysts.
Looking at an Ichimoku chart, it's no surprise that analysts are sometimes turned off by the busyness of the chart. It can look like chaos to the uninitiated but the key to getting past that is understanding the formula to each indicator, how they combine with each other, how they represent a consensus of price action in different time frames and colour-coding. In part two David explains construction and interpretation of the charts in a manner that is easy for any newcomer to technical analysis let alone a professional on a trading desk.
Part three, is where we are encouraged to think outside of the box. Here, the use of Ichimoku charts are combined with other technical analysis techniques, alternative time inputs into the indicators are suggested and the application to market breadth analysis is considered. There is also a chapter on back testing for the quantitative traders to consume.
Overall, this book, in an easily read manner, brings together the body of knowledge of a Japanese technical analysis method which was once thought of as exotic and over-complicated. It has potential to become the definitive English language text on the Ichimoku Kinko Hyo technical analysis method.
Boosting RSI with the Modified Inverse Fisher Transform (MIFT) - Part 1
Upside price action can be in sharp contrast to what is experienced to the downside. "The market goes down like an elevator but up like an escalator," as prices tend to fall faster than they rise. At the same time, technical indicators, such as the well-known Relative Strength Index (RSI), treat rising prices the same as falling prices. Adjusting the indicator distribution with the Modified Inverse Fisher Transform (MIFT) helps to account for those differences and provides new trading applications. This paper will introduce the TSLabs: Modified Inverse Fisher Transform custom indicator with practical examples to explore and apply in trading.
=======
The article : Applying The Fisher Transform and Inverse Fisher Transform to Markets Analysis in MetaTrader 5
=======
Indicators from MT5 CodeBase :
=======
Case shows slides about what strategies to use in high and low implied volatility situations. Her and Tom talk about how the market conditions affect the types of plays she makes.
Forum on trading, automated trading systems and testing trading strategies
Market Condition Evaluation based on standard indicators in Metatrader 5
newdigital, 2013.09.01 21:06
This my post? red dotted lines are for possible sell stop trade, blue dotted lines are are possible buy stop ...
=============
Anyway - I just copied some latest summary from this thread :
=============
Market Condition Evaluation
story/thread was started from here/different thread
================================
Market condition
- the theory with examples (primary trend, secondary trend) - read staring from this post till this one
- Summary about market condition theory is on this post
- Practical examples about every market condition case by indicators: starting from this page till this one
- trendstrength_v2 indicator is here,
- AbsoluteStrength indicator new version is here
- AbsoluteStrength indicator old version is on this post
- AbsoluteStrengthMarket indicator is here to download.
- good feature in Metatrader 5: moving stop loss/take profit by mouse on the chart (video about howto)
================================
3 Stoch MaFibo trading system for M5 and M1 timeframe
- trading examples
- template to download
- explanation how to trade and more explanation here
- how to install
- 2stochm_v4 EA is on this post.
================================
PriceChannel ColorPar Ichi system.
================================
MaksiGen trading system
- indicator to download
- some explanation about the system in general how to use
- Trading examples with MT5 statement, more trading is here.
- Paramon trading system iis on this post; How to trade the system - manual trading with live examples - read this page.
================================
Merrill's patterns are on this page.
================================
Divergence - how to use, explanation and where to read about.
================================
Scalp_net trading system
- template/indicators and how to use are on this comment.
- scalp_net_v132_tf EA is on this post with optimization results/settings for EURUSD M5 timeframe
- possible settings #1 for this EA for EURUSD M5 timeframe with backtesting results is on this post.
================================
MTF systems
more to follow ...
================================
MA Channel Stochastic system is here.
================================
Ichimoku
- The theory of the signals
- Ichimoku alert indicator with arrows
- Ichimoku alert indicator improved : warning alert mode was fixed and autosettings feature was added
Correctly Using MACD/Fibonacci Technical Analysis
It is mostly related to trading options (same with previous video) but it is interesting to watch because it is real practical example.
=========
Most traders use MACD/Fibonacci analysis wrong. Here's the right way to use these indicators along with some live examples!
Question - Should I Hold My Trade Over the Weekend?
Ichimoku Currency Forex Trading Strategies And Education
Forum on trading, automated trading systems and testing trading strategies
Something Interesting in Financial Video March 2014
newdigital, 2014.03.03 12:02
Ichimoku technical analysis & online day trading strategies
In this online trading education course, Ichimoku Kinko Hyo (Pronounced: Ichiii...Mooooo...Kuuuu) is a technical trend based system that powerfully illustrates support and resistance values in a simplified form and is considered an extension of the very popular candlestick charting system. In fact, this system was built on the idea that at "one glance" you should be able to easily determine whether an instrument is in equilibrium (consolidation) or out of equilibrium (trending).
More video on this subject:
- Ichimoku - about this indicator in general, what every line of this indicator means.
- Ichimoku cloud, how to use it with trading
- Ichimoku Trading - Ichimoku Training - Support and Resistance with the Ichimoku Cloud Trading
- Kumo Breakout Trading with the Ichimoku System.
- Ichimoku vs Moving Average Trade Analysis.
- Ichimoku vs Moving Average Trade Analysis
- Technical Analysis Course - Module 10: Cloud Charts: the Ichimoku Technique
- Ichimoku - Drawbacks Of Ichimoku Kinko Hyo
- Ichimoku - Ideal Ichimoku ScenariosIchimoku - Kumo Cloud Studies I
- Ichimoku - Multiple Confirmation
==============
Ichimoku threads/posts on mql5.com forum
- The theory of the signals
- Ichimoku alert indicator with arrows
- Ichimoku alert indicator improved : warning alert mode was fixed and autosettings feature was added
=============
Ichimoku indicator description
- Tenkan Sen - moving average of the highest high and lowest low over the last 9 trading days. (Highest high + Lowest low) / 2 over the last 9 trading days
- Kijun Sen - moving average of the highest high and lowest low over the last 26 trading days. (Highest high + Lowest low) / 2 over the last 26 trading days.
- Senkou Span A - the average of the Tenkan Sen and Kijun Sen, plotted 26 days ahead. (Tenkan Sen + Kijun Sen) / 2 plotted 26 days ahead
- Senkou Span B - the average of the highest high and lowest low over the last 52 days, plotted 26 days ahead. (Highest high + Lowest low) / 2 over the last 52 trading days plotted 26 days ahead.
- Chikou Span - the closing price plotted 26 days behind.
=============
This is stock market how-to information
===========
A variety of integration gateways to liquidity providers and stock exchanges have recently been developed for MetaTrader 5 trading platform. Using these solutions, brokers now can greatly improve their business and enter new markets. We have decided to summarize the first integration results and make a list of already working MetaTrader 5 gateways.
Liquidity Providers (ECNs)ECNs (Electronic Communication Networks) provide liquidity when using MetaTrader 5. We have developed gateways to the most well-known providers, and any MetaTrader 5 broker can now make use of their services:
- Integral
- CitiFX Pro
- Hotspot FX
- FastMatch
- Currenex
Our gateways not only give access to liquidity providers but also provide maximum speed of executing operations. Moreover, these gateways are fairly simple and secure solutions allowing brokers to quickly connect to a provider and use its services.
Stock ExchangesMetaTrader 5 has been developed as a multi-market platform. Nowadays, it can be used not only for arranging Forex trading but also for working on stock exchanges:
- Moscow Exchange (former RTS)
- Singapore Mercantile Exchange (SMX)
- Dubai Gold and Commodities Exchange (DGCX)
- Global Board of Trade (GBOT)
- BM&FBOVESPA (Brazilian stock exchange)
- Ukrainian Exchange
- Chicago Mercantile Exchange (CME)
- Warsaw Stock Exchange (WSE)
- Australian Securities Exchange (ASX)
- Turkish Derivatives Exchange (TURKDEX)
MetaTrader 5 platform's versatility makes it easy to expand the brokerage business and enter new markets. For example, any Forex broker can start working on a stock exchange, as well as a stock broker can launch the platform on an exchange and then enter Forex market. In any of these cases, all MetaTrader 5 technologies and services (social, mobile and algorithmic trading, as well as the market of trading robots) retain their functionality and remain attractive to traders.
The platform's features go beyond the proposed list, and the works on integration of MetaTrader 5 with other stock exchanges and liquidity providers are currently underway. Besides, Gateway API allows brokers to develop a gateway to any system or exchange on their own. Some brokers have already done that, while the proposed interfaces have greatly simplified their work. Moreover, API allows development of a hybrid ECN engine with multiple providers. That engine will act as trading server's own ECN platform.
===========
How to use Moving Averages effectively for Intraday, Momemtum and position Trading.
Forum on trading, automated trading systems and testing trading strategies
Indicators: Custom Moving Average
newdigital, 2013.07.31 07:53
Short-term Forex Trading with Moving AveragesShort term trading will use short period moving averages such as the 10 and 20 moving average.
In the example below we use 10 and 20 moving averages to generate Forex signals; the signals generated are able to identify the trend as early as possible.
Scalper Trading Using Moving Averages
One of the most widely used method of technical analysis used to trade price fluctuations in scalp trading is the use of moving averages. moving averages is an indicator that provides a profitable chart structure for scalp trader.
The idea behind moving averages is to simply enhance analysis before taking a signal to enter the market. Planning and setting goals in the short-term according to moving averages helps a trader to identify interests in the market and thus trade accordingly.
Most of the targets can be established using a specific period on MA. The moving averages determines whether the trader will scalp in a short-term long-term. In addition, the price action above or below the price determines the state of the market for the trading day.
If a large part of the price action is considered to be below the MA, then bias trade/forex trend for the day is short. Most traders the use the MA as support or resistance to determine where to enter a trade, if price touches the MA in the direction of the forex trend a trade is then opened.
The moving averages are plotted and the intersection point with the price action can be used to determine the appropriate entry and exit times in the market. Since there is always oscillation in the forex trends and activities of the price action on the market, the price will repeat this process of oscillating and bouncing off the MA and this can be used to generate forex trading signals.
Scalp trader use moving averages define the price floor in an upward Forex trend and price ceiling in a downward Forex trend.
Simple moving averages are calculated and their approach is based on the observation of price within a particular period of time using sufficient data to calculate the moving averages is what moving average are all about? The interpretation of the moving averages has provided many scalp traders with lots of tips on how and when to trade a currency.
Medium-term Trading with Moving Average
Medium term trading will use the 50 period MA.
The 50 period MA acts as support or resistance level for the price.
In an uptrend the 50 period MA will act as a support, price should always bounce back up after touching the MA. If price closes below the MA then it is an exit signal.
50 period MA Support
In a downtrend the 50 period MA will act as a resistance, price should always go down after touching the moving average. If price closes above the moving average then it is an exit signal.
50 Day Moving Average Analysis in the Forex Market
As your currency pair moves up in price, there is a key line you want to watch. This is the 50 day moving average. If your currency pair stays above it, that is a very good sign. If your currency pair drops below the line in heavy volume, watch out, there could be reversal ahead.
A 50 day MA line takes 10 weeks of closing price data, and then plots the average. The line is recalculated everyday. This will show a currency pair's price trend. It can be up, down, or sideways.
You normally should only buy currency pairs that are above their 50 day MA. This tells you the currency pair is trending upward in price. You always want to trade with the trend, and not against it. Many of the world's greatest traders, past and present, only trade or traded in the direction of the trend.
When a successful currency pair corrects in price, which is normal, it may drop down to its 50 day MA.
Winning currency pairs normally will find support over and over again at that line. Big trading institutions such as mutual funds, pension funds, and hedge funds watch top currency pairs very closely. When these big volume trading entities spot a great currency pair moving down to its 50 day line, they see it as an opportunity, to add to, or start a position at a reasonable price.
What does it mean if your currency pair price slices downward through its 50 day line. If it happens on heavy volume, it is a strong signal to sell the currency pair. This means big institutions are selling their shares, and that can cause a dramatic drop in price, even if fundamentals still look solid. Now, if your currency pair drops slightly below the 50 day line on light volume, watch how the currency pair acts in the following days, and take appropriate action if necessary
Long-term Trading with Moving Average
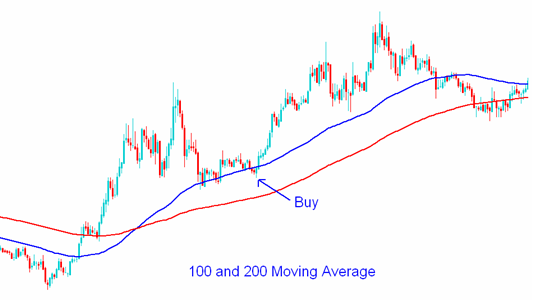
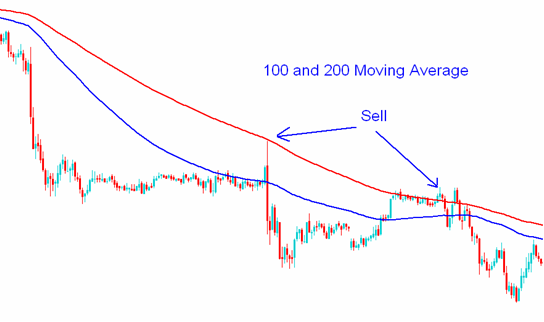
Long term trading will use long period moving averages such as the 100 and 200 moving average.
These moving averages act as long term support and resistance levels. Since many traders use the 100 and 200 moving averages price will often react to these support and resistance levels.
Learn about the 200 day MA
In Forex Trading, investors can use both fundamental analysis and technical analysis to help determine whether a currency pair is a good buy or sell.
In technical analysis technique traders looking to gauge supply and demand for a currency use the 200 day moving average to examine data in different ways.
Traders are most familiar with the basic analysis of MA. The 200 day moving average is used to plot the long term support or resistance level. If price is above 200 day MA then price is bullish, and if it is below then it is bearish.
One of the ways to measure supply and demand is to calculate the average closing price over the last 200 trading sessions. this accounts for each day going back in time and shows how this 200 day average has moved hence the term 200 day MA.
The reason why the average 200 day MA in particular is so popular in technical analysis is because historically has been used with profitable results for trading in the forex market. A popular timing strategy is used to buy when price action is above its moving average of 200 days and sell when it goes below it.
With individual currency pairs, investors can benefit from being notified when a currency pair rises above, or falls below its 200 day Moving Average and then use fundamental analysis to help determine if the signal is an opportunity to go long or short.
Forum on trading, automated trading systems and testing trading strategies
Indicators: Custom Moving Average
newdigital, 2013.07.31 07:58
20 Pips Price Range Moving Average Forex StrategyThe 20 pips price range moving average strategy is used with the 1 Hour and 15 minute Trading charts. On this chart time-frames we use the 100 and 200 simple moving average indicator.
Both the 1 Hour and 15 minute chart time-frames will use the 100 and 200 SMA (SMA Indicator) to determine the direction of the Forex trend.
The 1 Hour chart time-frame checks the long term direction of the Forex trend, upward or downward trend, depending on the direction of the moving averages. All trades taken should be in this direction.
We then use the 15 minute price chart to find the optimal point to enter trades. Trades are opened only when the price is within 20 pips range of the 200 simple MA, if price is not within this pip range trades are not opened.
Buy Signal - Forex Uptrend/Bullish Market
To generate Forex buy (bullish signals) using the 20 pips moving average Forex trading strategy, we shall use the 1hour and 15 minute chart time-frame.
On the 1 hour Forex chart time-frame the price of the currency pair should be above both the 100 and 200 simple moving average. We then move to a lower chart time-frame, the 15 minute chart time-frame to generate a trade signal.
On 15 minute chart time-frame, when price reaches the 20 pips range above the 200 SMA, we open a buy trade and place a stop loss 30 pips below the 200 SMA. Stop loss can be adjusted to the amount of Pips that are suitable for your risk but to avoid being stopped out by normal Forex volatility its best to use 30 pips stop loss.
A buy trade can also be opened when price touches the 100 Simple moving average, provided it’s not very far from the 200 SMA. Normally the 100 SMA will be within the 20 pips range of the 200 SMA.
Sell Signal – Forex Downtrend/Bearish Market
To generate Forex sell (short signals) using the 20 pips moving average Forex trading strategy, we shall also use the 1hour and 15 minute chart time-frame.
On the 1 hour chart time-frame, the price should be below both the 100 and 200 simple moving average. We then move to the 15 minute chart time-frame to generate a Trading Signal.
On 15 minute chart, when price reaches the 20 pips range below the 200 SMA, we open a sell trade and place a stop loss 30 pips above the 200 simple moving average.
With this method price will generally bounce of these levels because many traders watch these levels, and open similar trades at around the same point.
These levels act as short term resistance or support levels within the currency price charts.
Profit Taking level For This Trading Strategy
With this trading strategy the price will bounce and make a move in the direction of the original Forex trend. This move will range from 70 - 100 pips.
The best profit taking level would therefore be considered to be 80 pips from the 200 simple moving average.
Forum on trading, automated trading systems and testing trading strategies
Indicators: Custom Moving Average
newdigital, 2013.07.31 07:48
How to choose a moving average to trade withA trader can choose a moving average based on the time frame that he is trading; the trader might choose the moving average to measure minute chart, hourly charts, day charts or even weekly.
The trader can also choose to average the closing price, opening price or median price.
Moving average is commonly used devices to measure strength of trends. The data is precise and its output as a line can be customized to ones preferences.
Using the moving average is one of the basic ways to generate buy and sell signals which are used to trade in the direction of the trend, since the moving average is a lagging and a trend following indicator. The Moving average indicator as a lagging indicator means that it will tend to give late signals as opposed to leading indicators. However, the Moving average as a lagging indicator gives more accurate signals and is less prone to whipsaws compared to leading indicators.
Traders choose the moving average period to use depending on the type of trading they do; short-term, medium-term and long-term.
- Short-term: 10 -50 Period Moving Average
- Medium-term: 50 - 100 Period Moving Average
- Long-term: 100 - 200 Period Moving Average
Short term moving averages are sensitive to price action and can spot trends signals faster than the long term moving averages. line more closely than a long term (200 period) average. Shorter term moving averages are also more prone to whipsaws compared to long term ones.
Long term averages help avoid whipsaws, but are slower in spotting new trends and reversals.
Because long term moving averages calculate the average using more price data, it does not reverse as fast as a short term moving average and it is slow to catch the changes in the trend. However the longer term moving average is better when the trend stays in force for a longer time.
The work of a trader is to find a moving average that will identify trends as early as possible while at the same time avoiding fake-out signals (whipsaws).
- Free trading apps
- Over 8,000 signals for copying
- Economic news for exploring financial markets
You agree to website policy and terms of use
Trading and training video (from youtube for example) about forex and financial market in general.
Please upload forex video you consider as interesting one. No direct advertising and no offtopic please.
The comments without video will be deleted.