Indicators: Average True Range (ATR)
In the money management module you need to use ATR with a specified period and currency pair. I took an example using ATR. Trying to compile the Expert Advisor I get more than 100 errors.
Here is the description of the standard library:
Class CiATR
Class CiATR is a class for working with the technical indicator "Average True Range".
Description
Class CiATR provides creation, configuration and access to data of the indicator "Average True Range".
Declaration
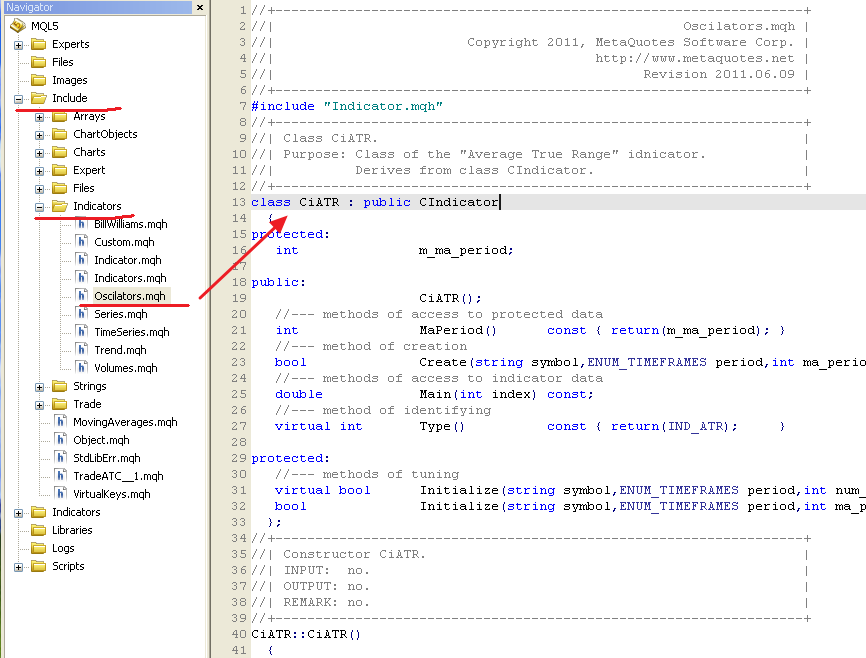
class CiATR: public CIndicator
Title
#include <Indicators\Oscilators.mqh>
This CiATR is nowhere to be found in the library!!! How do I implement the programme please give me a working example.
I am interested in access to data.
There is no CiATR anywhere in the library!!!! How do I implement the programme, please give me a working example.
I'm interested in access to data.
There should be, look for it. I've just checked it for myself.
Good afternoon, gentlemen. Help with solving the problem. MT4 terminal. Task, it is necessary to place two ATR indicators with different periods for example (5) and (20) in one window. Solution: drag and drop indicators into one window. Problem indicator readings displayed graphically, diverge from the data displayed in the table of numerical values.
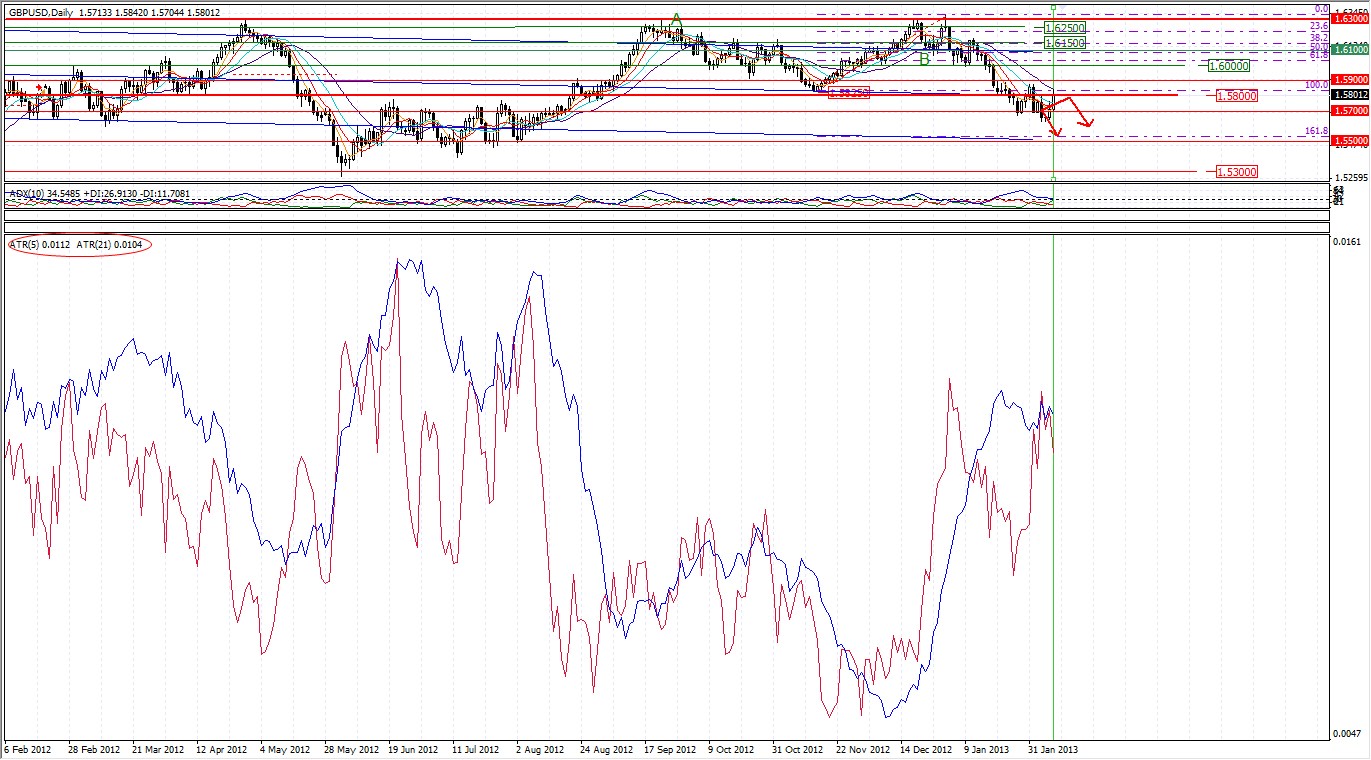
ATR (5) red - 0.0112 ATR(20) - 104 As you can see in the figure, the red line is below the blue line. Help to fix this bug, if possible.
It's not a bug. Each indicator has its own scale.
Well each indicator has its own scale, how do I align the scale of these indicators, in order to first of all visually determine the position of the indicator? That is, I want the location of the indicators to correspond to their values. Is this possible?
Write an indicator that combines the two ATRs, or fix the scale, ie set the same minimums maximums for both indicators.
I'm in the process of building an Expert Adviser. This has brought me to this ATR indicator so that I can verify the iATR() results.
Much to my surprise, the results were sometimes 50, sometimes more than 250 basis points off.
Has anyone else experienced this?
CipherPips
The loop seems to work without this line ExtATRBuffer[i]=0.0; of the code.
double firstValue=0.0;
for(i=1;i<=ExtPeriodATR;i++)
{
ExtATRBuffer[i]=0.0;
firstValue+=ExtTRBuffer[i];
}
//--- calculating the first value of the indicator

- Free trading apps
- Over 8,000 signals for copying
- Economic news for exploring financial markets
You agree to website policy and terms of use
Average True Range (ATR):
Average True Range (ATR) is a technical indicator that shows market volatility.
It was introduced by Welles Wilder in his book "New concepts in technical trading systems". This indicator has been used as a component of numerous other indicators and trading systems ever since.
Average True Range can often reach a high value at the bottom of the market after a sheer fall in prices occasioned by panic selling. Low values of the indicator are typical for the periods of sideways movement of long duration which happen at the top of the market and during consolidation.
Average True Range can be interpreted according to the same principles as other volatility indicators. The principle of forecasting based on this indicator can be worded the following way: the higher the value of the indicator, the higher the probability of a trend change; the lower the indicator’s value, the weaker the trend’s movement is.
Author: MetaQuotes Software Corp.