Something Interesting in Financial Video March 2014 - page 3
You are missing trading opportunities:
- Free trading apps
- Over 8,000 signals for copying
- Economic news for exploring financial markets
Registration
Log in
You agree to website policy and terms of use
If you do not have an account, please register
Forum on trading, automated trading systems and testing trading strategies
Something Interesting in Financial Video September 2013
newdigital, 2013.09.17 07:20
115. Forex Trading Fundamentals Quiz - Test Your KnowledgeAs we now have a basic understanding of how trade flows and capital flows move the forex market, the next step is to look at each of the individual currencies we will be focusing on so we can gain an understanding of their backgrounds, and the makeup of their economies. Once we have an understanding of this it will become clear what fundamental factors are the most important drivers of individual currencies, and therefore what we as traders should watch for.
Before we get into this however it is very important that everyone has a sound understanding of how trade flows and capital flows move the forex market (which is covered in module 3 of this course) as well as the following concepts, all of which are covered in module 8 of our free basics of trading course:
- We all need to understand what the business cycle is.
- The difference between monetary and fiscal policy.
- What a central bank is and how they go about changing interest rates. In module 8 of the basics of trading course we cover the Federal Reserve which is the central bank in the United States. While the central banks that we are going to be covering going forward may differ in how aggressive they are with monetary policy in relation to the Federal Reserve, the methods they use to conduct monetary policy, and the reactions of the forex market that monetary policy generates, is basically the same no matter what central bank you are looking at.
- The first currency we will be covering will be the US Dollar, so you should have a good understanding of the basic components of the US Economy.
I am going to give everyone 10 questions here that you should now have the knowledge to answer if you have been through module 8 of my free basics of trading course, and module 3 of this course. To help make it interesting for everyone, I will offer a free copy of Kathy Lien's excellent book Day Trading the Currency Market, to the first person that posts the correct answers to all 10 questions in the comments section of this lesson on InformedTrades.com. If you are watching this video on Youtube you can find a link to this lesson on InformedTrades to the right of the video. Ok so here we go:
1. If inflation is low and a Central Bank is concerned about recession, what would the expected monetary policy response be?
2. If inflation and growth are both high what would the expected monetary policy response be?
3. If a central bank raises interest rates, what affect if any is this expected to have on the currency of that country, all else being equal?
4. If a central bank lowers interest rates, what affect if any is this expected to have on the currency of that country, all else being equal?
5. If a country's imports grow and all other trade and capital flows remain equal, what affect would this have on the current account and what would be the expected affect on the currency if any?
6. If a country's exports grow and all other trade and capital flows remain equal, what affect would this have on the current account and what would be the expected affect on the currency if any?
7. If a country is a major exporter of gold and the price of gold moves up by 50% over the course of a year, what would be the expected affect if any on that country's currency all else being equal?
8. Japan is a major importer of oil and Canada is a major exporter of oil. If the price of oil goes up by 50% over the course of a year, then what affect if any should this have on the CAD/JPY currency pair all else being equal?
9. Traders who follow US Dollar fundamentals pay particular attention to any numbers which reflect the overall health of the consumer. Why?
10. The US Economy in the past was referred to as an Industrial Economy, now it is referred to more as a ________________ Economy.
Using RSI for Intraday, momemtum and swing trading.
Forum on trading, automated trading systems and testing trading strategies
Indicators: Relative Strength Index (RSI)
newdigital, 2013.08.07 12:55
RSI Indicator Forex Trading StrategyRelative Strength Index or RSI is the most popular indicator used in Forex trading. It is an oscillator indicator which oscillates between 0 -100. The RSI is a trend following indicator. It indicates the strength of the trend, values above 50 indicate a bullish trend while values below 50 indicate bearish Forex trend.
The RSI measures momentum of a currency.
The centerline for the RSI is 50,crossover of the centerline indicate shifts from bullish to bearish and vice versa.
Above 50, the buyers have greater momentum than the sellers and price of a currency will keep going up as long as RSI stays above 50.
Below 50, the sellers have greater momentum than the buyers and price of a currency will keep going downwards as long as RSI stays below 50.
In the example above, when the RSI is below 50, the price kept moving in a downward trend. The price continues to move down as long as RSI was below 50. When the RSI moved above 50 it showed that the momentum had changed from sell to buy and that the downtrend had ended.
When the RSI moved to above 50 the price started to move upwards and the trend changed from bearish to bullish. The price continued to move upwards and the RSI remained above 50 afterwards.
From the example above, when the trend was bullish sometimes the RSI would turn downwards but it would not go below 50, this shows that these temporary moves are just retracements because during all these time the price trend was generally upwards. As long as RSI does not move to below 50 the trend remains intact. This is the reason the 50 mark is used to demarcate the signal between bullish and bearish.
The RSI uses 14 day period as the default RSI period, this is the period recommended by J Welles Wilders when he introduced the RSI. Other common periods used by forex trader is the 9 and 25 day moving average.
The RSI period used depends on the time frame you are using, if you are using day time frame the RSI 14 will represent 14 days, while if you use 1 hour the RSI 14 will represent 14 hours. For our example we shall use 14 day moving average, but for your trading you can substitute the day period with the time frame you are trading.
To Calculate RSI:- The number of days that a currency is up is compared to the number of days that the currency is down in a given time period.
- The numerator in the basic formula is an average of all the sessions that finished with an upward price change.
- The denominator is an average of all the down closes for that period.
- The average for the down days are calculated as absolute numbers.
- The Initial RS is then turned into an oscillator.
Sometimes very large up or down movement in price in a single price period may skew the calculation of the average and produce a false signal in the form of a spike.Center-line: The center-line for RSI is 50. A value above 50 implies that a currency is in a bullish phase as average gains are greater than average losses. Values below 50 indicate a bearish phase.
Overbought and Oversold Levels:Wilder set the levels at which currencies are overextended at 70 and 30
Forum on trading, automated trading systems and testing trading strategies
Indicators: Relative Strength Index (RSI)
newdigital, 2013.08.07 13:15
RSI Indicator Divergence Trading Setups
Divergence is one of the trade setups used by Forex traders. It involves looking at a chart and one more indicator. For our example we shall use the RSI indicator.
To spot this setup find two chart points at which price makes a new swing high or a new swing low but the RSI indicator does not, indicating a divergence between price and momentum.
Example:
In the chart below we identify two chart points, point A and point B (swing highs)
Then using RSI indicator we check the highs made by the RSI, these are the highs that are directly below Chart points A and B.
We then draw one line on the chart and another line on the RSI indicator.
How to spot divergence
In order to spot divergence we look for the following:
First let us look at the illustrations of these terms
There are two types of divergence:
MACD, RSI, Stochastics - stock indicators
You may have heard about Fibonacci, the man who discovered a set of numbers who that have a major affect on the market. So who is this Fibonacci fellow, and why are his findings so important in the market place?
The mathematical findings by this thirteenth century Italian man has yielded a useful technical analysis tool which is used in technical analysis and by scientists in a large array of fields. Born Leonardo of Piza, he is better known in the trading community as Fibonacci. Fibonacci's best known work is Liber Abaci which is generally credited as having introduced the Arabic number system which we use today.
Fibonacci introduced a number sequence in Liber Abaci which is said to be a reflection of human nature. The series is as follows: 1, 1, 2, 3, 5, 8, 13, 21, 34, 55, 89, 144 and on to infinity. The series is derived by adding each number to the previous. For example, 1+1=2 , 2+1=3, 3+2=5, 5+3=8, 8+5=13, and so on.
Fibonacci retracements show where support and resistance might come into the market. It is also useed to enter or add onto a position.
Forum on trading, automated trading systems and testing trading strategies
Indicators: Fibonacci retracement
newdigital, 2013.11.21 12:06
Fibonacci Retracements (based on stockcharts article)
Introduction
Fibonacci Retracements are ratios used to identify potential reversal levels. These ratios are found in the Fibonacci sequence. The most popular Fibonacci Retracements are 61.8% and 38.2%. Note that 38.2% is often rounded to 38% and 61.8 is rounded to 62%. After an advance, chartists apply Fibonacci ratios to define retracement levels and forecast the extent of a correction or pullback. Fibonacci Retracements can also be applied after a decline to forecast the length of a counter trend bounce. These retracements can be combined with other indicators and price patterns to create an overall strategy.
The Sequence and RatiosThis article is not designed to delve too deep into the mathematical properties behind the Fibonacci sequence and Golden Ratio. There are plenty of other sources for this detail. A few basics, however, will provide the necessary background for the most popular numbers. Leonardo Pisano Bogollo (1170-1250), an Italian mathematician from Pisa, is credited with introducing the Fibonacci sequence to the West. It is as follows:
0, 1, 1, 2, 3, 5, 8, 13, 21, 34, 55, 89, 144, 233, 377, 610……
The sequence extends to infinity and contains many unique mathematical properties.
1.618 refers to the Golden Ratio or Golden Mean, also called Phi. The inverse of 1.618 is .618. These ratios can be found throughout nature, architecture, art and biology. In his book, Elliott Wave Principle, Robert Prechter quotes William Hoffer from the December 1975 issue of Smithsonian Magazine:
….the proportion of .618034 to 1 is the mathematical basis for the shape of playing cards and the Parthenon, sunflowers and snail shells, Greek vases and the spiral galaxies of outer space. The Greeks based much of their art and architecture upon this proportion. They called it the golden mean.
Alert ZonesRetracement levels alert traders or investors of a potential trend reversal, resistance area or support area. Retracements are based on the prior move. A bounce is expected to retrace a portion of the prior decline, while a correction is expected to retrace a portion of the prior advance. Once a pullback starts, chartists can identify specific Fibonacci retracement levels for monitoring. As the correction approaches these retracements, chartists should become more alert for a potential bullish reversal. Chart 1 shows Home Depot retracing around 50% of its prior advance.
The inverse applies to a bounce or corrective advance after a decline. Once a bounce begins, chartists can identify specific Fibonacci retracement levels for monitoring. As the correction approaches these retracements, chartists should become more alert for a potential bearish reversal. Chart 2 shows 3M (MMM) retracing around 50% of its prior decline.
Keep in mind that these retracement levels are not hard reversal points. Instead, they serve as alert zones for a potential reversal. It is at this point that traders should employ other aspects of technical analysis to identify or confirm a reversal. These may include candlesticks, price patterns, momentum oscillators or moving averages.
Common RetracementsThe Fibonacci Retracements Tool at StockCharts shows four common retracements: 23.6%, 38.2%, 50% and 61.8%. From the Fibonacci section above, it is clear that 23.6%, 38.2% and 61.8% stem from ratios found within the Fibonacci sequence. The 50% retracement is not based on a Fibonacci number. Instead, this number stems from Dow Theory's assertion that the Averages often retrace half their prior move.
Based on depth, we can consider a 23.6% retracement to be relatively shallow. Such retracements would be appropriate for flags or short pullbacks. Retracements in the 38.2%-50% range would be considered moderate. Even though deeper, the 61.8% retracement can be referred to as the golden retracement. It is, after all, based on the Golden Ratio.
Shallow retracements occur, but catching these requires a closer watch and quicker trigger finger. The examples below use daily charts covering 3-9 months. Focus will be on moderate retracements (38.2-50%) and golden retracements (61.8%). In addition, these examples will show how to combine retracements with other indicators to confirm a reversal.
Moderate RetracementsChart 3 shows Target (TGT) with a correction that retraced 38% of the prior advance. This decline also formed a falling wedge, which is typical for corrective moves. The combination raised the reversal alert. Chaikin Money Flow turned positive as the stock surged in late June, but this first reversal attempt failed. Yes, there will be failures. The second reversal in mid July was successful. Notice that TGT gapped up, broke the wedge trend line and Chaikin Money Flow turned positive (green line).
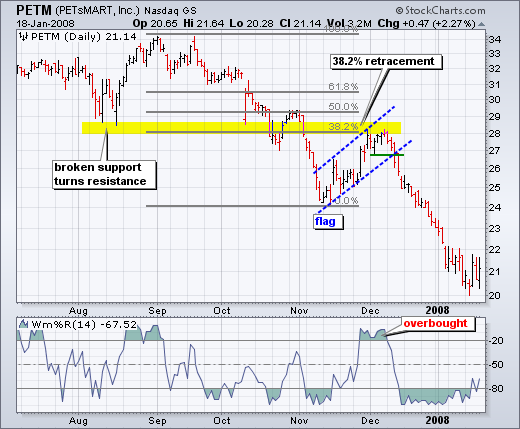
Chart 4 shows Petsmart (PETM) with a moderate 38% retracement and other signals coming together. After declining in September-October, the stock bounced back to around 28 in November. In addition to the 38% retracement, notice that broken support turned into resistance in this area. The combination served as an alert for a potential reversal. William %R was trading above -20% and overbought as well. Subsequent signals affirmed the reversal. First, Williams %R moved back below -20%. Second, PETM formed a rising flag and broke flag support with a sharp decline the second week of December.
Golden RetracementsChart 4 shows Pfizer (PFE) bottoming near the 62% retracement level. Prior to this successful bounce, there was a failed bounce near the 50% retracement. The successful reversal occurred with a hammer on high volume and follow through with a breakout a few days later.
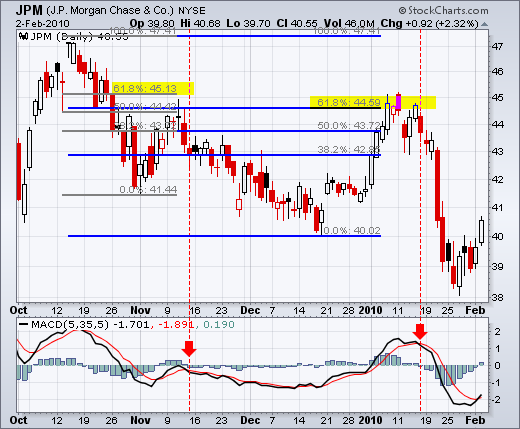
Chart 5 shows JP Morgan (JPM) topping near the 62% retracement level. The surge to the 62% retracement was quite strong, but resistance suddenly appeared with a reversal confirmation coming from MACD (5,35,5). The red candlestick and gap down affirmed resistance near the 62% retracement. There was a two day bounce back above 44.5, but this bounce quickly failed as MACD moved below its signal line (red dotted line).
ConclusionsFibonacci retracements are often used to identify the end of a correction or a counter-trend bounce. Corrections and counter-trend bounces often retrace a portion of the prior move. While short 23.6% retracements do occur, the 38.2-61.8% covers the more possibilities (with 50% in the middle). This zone may seem big, but it is just a reversal alert zone. Other technical signals are needed to confirm a reversal. Reversals can be confirmed with candlesticks, momentum indicators, volume or chart patterns. In fact, the more confirming factors the more robust the signal.
Forum on trading, automated trading systems and testing trading strategies
Indicators: Fibonacci retracement
newdigital, 2014.01.31 11:05
The 3 Step Retracement Strategy (adapted from dailyfx article)
Find A Trendline
Before we can consider trading a pricing swing, we need to first be able to find market direction as well as support or resistance. This issue can be solved by creating a trendline. These areas can be found on a chart by either connecting to highs or lows, then extrapolating their direction on the chart. In a downtrend traders should look for price action to be declining under trendline resistance, while in uptrend prices should be advancing above trendline support.
Fibonacci Retracements
Once market direction and trendline resistance is identified, we need to identify an area to enter into the market. This can be done by finding a confluence of resistance using a Fibonacci retracement. These retracement values are displayed as a percentage of the previous move as measured from swing high/low in a downtrend. Much like our previously drawn trendline, these retracements can pinpoint areas where the market may turn. Traders should look to see where these two values converge and then plan to enter the market.
Exiting Positions
Now that we have a plan to enter the market on a price swing, traders will need to identify when it is time to exit the market. This is always the third and final step of any successful strategy! In order to manage risk, traders should first consider where to set a stop order. In a downtrend like the USDJPY daily chart, traders should consider placing this value above resistance. On the chart below stop orders have been placed outside of resistance, above our current trendline and previous swing high.
Full text of video :
==========
Basic Set-ups and Stop Placement
Most price action traders place buy or sell stop orders with a pre-determined stop loss level, and a take profit or target level. The buy or sell stop sets the level that price much reach for the order to be filled; the stop loss level sets the margin of loss that a trader will accept before closing the position; the take profit level sets the level at which to automatically close a successful position.
Basically, you determine risk based on where you are placing your stop, and then determine your target with regard to this risk level; commonly, traders will aim for at least a 1:3 risk to reward ratio, although scalpers and those who trade on shorter time frames often have to accept smaller ratios.
The buy or sell stop, or entry level, is typically set at a significant support or resistance level so that it will only be filled when price has broken definitively in the desired direction; by setting strategic entry levels in their orders, traders can ensure that they enter trades with the momentum of the market.
Perhaps the most basic set-up is the pinbar, which, if you remember has an open and close within the previous bar, and a wick at least 3 times the length of the candle body, protruding beyond the levels of prior bars.
The long wick and short body implies that traders have made a strong attempt to push price in one direction, but price has returned to earlier levels, often indicating the possibility of a reversal in trend direction.
The basic way to trade a pinbar is to place the stop loss level at the extreme of the wick, and to place your entry level above the body in a bullish scenario, and below the body in a bearish scenario. the target is set relative to the risk level represented by the stop loss, often at a resistance level in a bullish scenario, or at a support level in a bearish scenario.
Another basic strategy is the inside bar, a bar or series of bars contained by the preceding bar; since the shrinking candle size implies consolidation, it can mean that a big move is on the way, either a strong continuation of the current trend, or a reversal. Because the price direction is uncertain, traders often place a orders on both sides of the inside bar, so that a downward movement will trigger a sell, and an upward movement will trigger a buy. A liberal entry point would be set just beyond the high or low of the inside bar; a more conservative entry point would be at the open or close of the preceding mother bar.
Inside bars are more effective to trade on larger time frame charts because they are so common on faster chart.
Two Examples
To conclude, we have two actual filled orders from trader Simit Patel. The first is a pin-bar style order placed on the Canadian Dollar/Swiss Franc pair on January 6th to sell at .85341, the black line, with a stop loss at .85995, both of which are historical resistance levels. the take profit level is set at .823333.
We can see that later on in the same day of simit's order, price reached the sell stop level at .85341, before dropping almost exactly to simit's target level of 8.23333
This second trade as in inside-bar style order place on the euro/british pound pair on December 12th. Simit sets his sell stop order at the black line, .84026, and his stop loss at the red line, about .84750, and his target the green line down at .80978. we can see that after his order was place, price did reach his sell stop order, just before a major reversal in price, allowing Simit to take profit when price begins to look bullish again, around .82800
==========
Basic Terms for Price Behavior:
Trend: 2 successively higher tops and bottoms (uptrend) / 2 successively lower tops and bottoms (downtrend)
Other names for a positive trend: run up/bull run/rally
Other names for a negative trend: run down/bear run/decline
Trading range: the market moves up and down within a consistent range without establishing a definitive trend in one direction
Consolidation: the range of price's movement constricts as the market becomes directionless
Reversal: the market moves in the opposite direction from the previous trend, implying the end of that trend
Retrace: the market moves some amount in the opposite direction from the previous trend before the trend is eventually reinstated
2 Attempts Rule: the idea that if the market attempts to do something twice and fails, the opposite will happen
Support and Resistance
In a trading range, or even within a trend, price action frequently seems influenced by or adherent to levels that have previously been significant turning points in its history; on the price action trader's charts, these levels are marked as lines offering potential support and resistance to future price action; lines drawn above the current price constitute resistance, while lines drawn below it are support. If either of these levels are broken, the function of the line is reversed, so, for example, if price breaks through a resistance line, that line can now be understood as a support line to future price action.
Support and resistance lines are typically horizontal, but when they are diagonal along a trend they are known as trend lines.
As an example (see video), I marked some significant support and resistance levels on this chart of the euro US dollar pair. This lowest level at about 1.34 is established as the point where the initial trend in mid September is arrested and turns briefly bearish. After the first bullish bear tops out at this level, the two bearish bars thereafter max out as though they are experiencing resistance from the same level before a break-through on September 16th. At this point, the resistance becomes support, and we can see that two months later, in mid November, this support level is tested and holds, as price rises back up for the rest of the month. If you recall the two-attempt rule that I explained, we can see that in action with this highest resistance level at about 1.383. We would draw this line in because it represents the height of the bullish trend extending from the beginning of this chart to late October. We can see that price returns close to this level in the next trend peak in mid December, and then finally tests it with the wick of this candle at the end of the month. Since the level is reached, but price fails to definitively break through, we can expect a reversal based on the two-attempt rule, and that's exactly what we've seen since the end of December.
So, the basic idea behind using support and resistance effectively in a trading range is to buy at the support level and sell at resistance in an uptrend, or to sell at resistance and buy at support in a downtrend; so, we're not necessarily hoping for a break-out through the established levels, because a break-out means that the market isn't behaving predictably enough to allow for safe bets on its future performance. Instead, the most conservative or reliable trades are those that occur as the market fluctuates between identifiable support and resistance levels, allowing you, in an uptrend, to buy when a retracement of bearish leg has brought prices down to a support level, and then sell when price returns to the resistance level, or, in a downtrend, to sell when price is maxed out at a reliable resistance level. The reason we are looking to buy in an uptrend and sell in a downtrend is that price action trading is all about playing the odds, so trading with the trend rather than against it is usually a better idea since a trend is statistically more likely to continue than to reverse
So, before we move on to some basic set-ups and stop placement, here are a few more important terms now that we have a sense of support and resistance.
Break-out: the market breaks out of a trading range or a resistance level
Clear-out: the market's break-out in one direction is quickly followed by its movement in the opposite direction
Throwback: retracement after a break above
Pullback: retracement after a break below
Introduction into the value of keeping your trading plan and trading practices as simple as possible. I will delve into discussions on how some traders fall into the trap of complicating a strategy that already works and how also to avoid doing it yourself. Keep it simple, keep it real and lastly keep it profitable.
Forum on trading, automated trading systems and testing trading strategies
Press review
newdigital, 2014.03.29 12:05
USDJPY Fundamentals (based on dailyfx article)
Fundamental Forecast for Japanese Yen: NeutralForex Trading Video: Yen Crosses and S&P 500 Checked Lower, Break Risk? :
Forum on trading, automated trading systems and testing trading strategies
Press review
newdigital, 2014.03.29 12:33
Forex Strategy Video: Stick to the Plan...Especially When the Trade is On• Many trading pitfalls occur after the trade is already on
• When the reason for taking the trade has evaporated, probabilities fade fast
• We look at the temptations, hazards and making the right calls with GBPUSD and EURUSD examples
A trade that has been put through the ringer for its fundamental, technical and market conditions merits should skew probabilities in our favor. When we make exceptions, our strategy starts breaking down. Tantalizing technical setups with no fundamental chance or event-driven volatility with no definable guidance in price cater to our emotions rather than our bottom line. But sticking to the plan isn't just for the pre-flight check. Many will alter the plan mid-trade or decide to ignore changing circumstances to revert to hope. Hope is not a trading plan. We look at how sticking to the plan both before and during a trade is important using GBPUSD and EURUSD examples in the weekend Strategy Video.
Forum on trading, automated trading systems and testing trading strategies
Press review
newdigital, 2014.03.29 18:43
Crude Oil forecast for the week of March 31, 2014, Technical AnalysisThe light sweet crude market rose during the week, breaking well above the $100 level again. The fact that the previous week had formed a hammer was a clue that we could be going higher, but the actual confirmation came once we cleared the top of that candle. It looks as if the market is still somewhat bullish, and as a result we will more than likely head towards the $104.50 level given enough time. We think that this market will be one that can be bought on dips, simply because there’s so much in the way of support below.
With that being said, we believe that the $105 level will continue to be massive resistance, and as a result we feel that the area will more than likely cause a bit of selling. A break above that area of course would be significant in the sense that it would free the market to go much higher, but at the end of the day we still believe that there’s a bit to go before even get to that issue. We are bullish.
Brent
The Brent markets rose during the week as well, but don’t look quite as bullish of the light sweet crude market. Nonetheless, it appears that we are heading towards the $112 level given enough time, although we would expect some choppiness right around the $108.50 level, an area that did in fact cause a bit of resistance this past week.
Any pullback at this point time should end up being a relatively positive thing, as buyers should step into the marketplace. The $105 level offered enough support to push the market higher last time, and we believe that will continue to be the case. So having said all of this, even if we pullback at this point time, we would fully anticipate this market been somewhat supported. With that in mind, we are not interested in selling, and believe that ultimately we will hit the aforementioned $112 level, but it may take quite a bit of chopping around.