Forum on trading, automated trading systems and testing trading strategies
Sergey Golubev, 2017.04.03 08:23
Google: Surprisingly Finish Up On The Week (based on the article)
Daily price was blunced from Senkou Span line of Ichimoku indicator to above for the bullish market condition to be resumed: the price is on breaking 833.00/851.95 resistance levels for the daily bullish trend to be continuing.
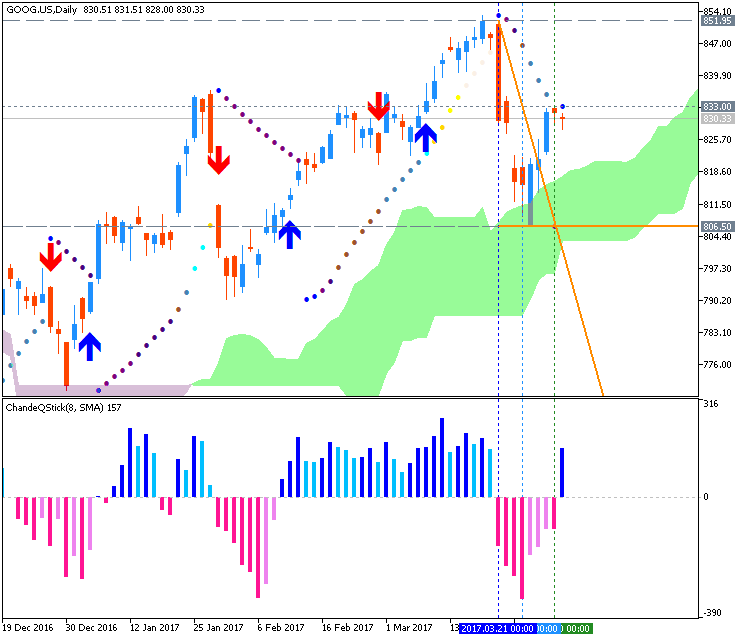
- "Wall Street earnings estimates for Google have been left mostly unchanged, ad controversy notwithstanding, at roughly $33 and change per share for 2017 and $39 and change per share for 2018 and rightly so given the minimal overall impact expected."
- "Estimates for Google are also conservative at present and if the company were to be able to show better than expected earnings and provide better guidance in a few weeks, when it will report earnings for Q1:17, look for estimates to rise and for the share price to catch (exceed?) its peer group and the Nasdaq."
- "Until then, the currently under-performing shares of Google could be presenting a big buying opportunity for those investors who have been waiting to step in and/or to add to their Google holdings."
Forum on trading, automated trading systems and testing trading strategies
Sergey Golubev, 2017.04.30 09:30
Why Did Google Pop And Amazon Drop (based on the article)
H4 shares broke Ichimoku cloud for the bullish breakout: the price broke Senkou Span line together with key resistance levels to above for the reversal to the primary bullish market condition. The priuce is testing 916.79 resistance level for the bullish trend to be continuing.
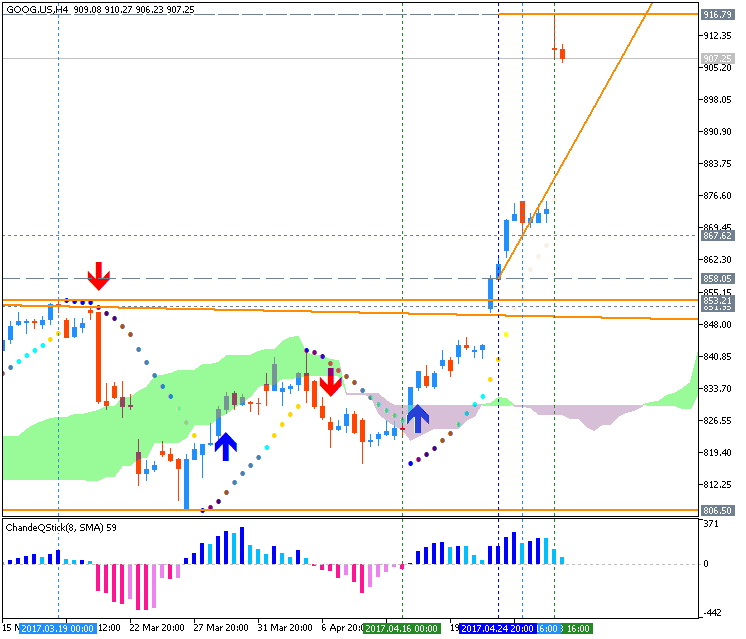
- "On Thursday night, Google reported earnings that handily beat Street consensus. The company reported earnings of $7.73 per share on revenues of $24.75 billion for the March quarter. The Street had been looking for earnings of $7.40 per share on revenues of $24.2 billion going in to the earnings event. A sizable beat by any count especially if one considers the size of the company."
- "The same night Amazon also reported its March quarter results that came in ahead of Street consensus. The online retail behemoth reported earnings of $1.48 per share on revenues of $35.75 billion versus Street expectations of $1.13 per share and $35.31 billion going into the earnings event."
- "Google ended the day higher by 3.7% or $33.08 per share at $924.52 per share after hitting an intra-day high of $935.88 per share. So, Google closed roughly $11 points lower than its intra-day high. Google shares traded at 2.3x its average daily volume of the last 90 days."
Forum on trading, automated trading systems and testing trading strategies
Sergey Golubev, 2017.06.06 09:07
Nasdaq will hit 10,000 in the very near future (based on the article)
Google share price is located far above Ichimoku cloud in the bullish area of the chart: daily price is breaking 978 resistance level to above for the bullish trend to be continuing.
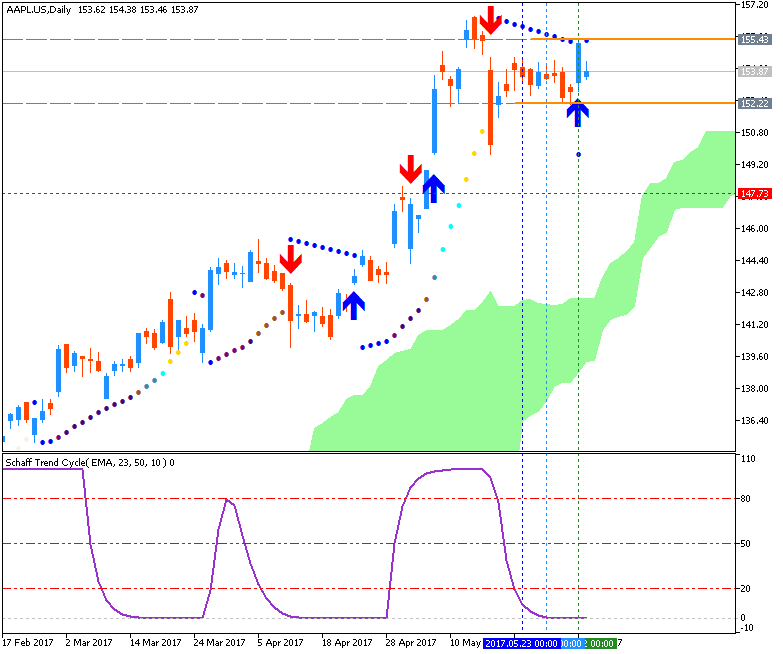
Apple shares are on bullish ranging within 155/152 s/r level to be above Ichimoku cloud: the price is testing 155 resistance to above for the bullish trend to be resumed.
- "Are we ready to concede the fact that the Nasdaq will hit 10,000 in the very near future? Probably within the next couple years."
- "Amazon just hit $1000/share. Google $975. Apple is likely to become the first company ever to have a total valuation of $1trillion dollars. If you don’t think it’s worth it, remember that stock ownership means you own a small piece of the company. And the company owns $250billion of cash. One quarter of the $1trillion valuation is in cold, hard cash. Only three quarters of the value is in floating stock."
Forum on trading, automated trading systems and testing trading strategies
Sergey Golubev, 2017.07.24 08:14
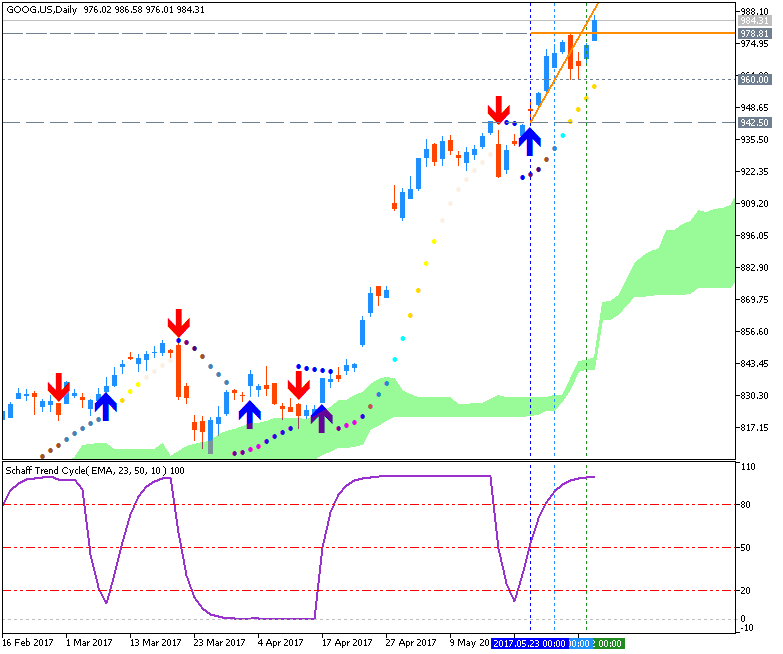
Google shares - daily bullish reversal; 975 is the key (based on the article)
Price on the daily chart broke Ichimoku cloud together with Senkou Span line to above for the reversal from the ranging to the primary bullish market condition. Price is breaking 975.73 resistance level to above for the daily bullish trend to be continuing
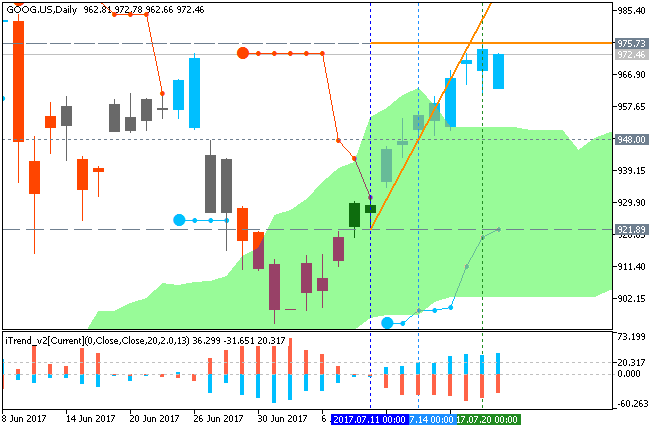
- "Wall Street expects Google to report $8.25 per share on revenues of $25.6 billion for the June quarter. Current Street consensus is for earnings of $8.45 per share on revenues of $26.7 billion for the current quarter ending in September"
- "Google shares are up 7.5% in the three months or so since the the day after the company reported results for its first quarter in 2017, on April 27, 2017. Google's shares are only slightly ahead of the QQQ's which are up 6.2% in that same period and the Nasdaq which is up 5.6% since then."
Forum on trading, automated trading systems and testing trading strategies
Sergey Golubev, 2017.09.22 21:08
Google shares - weekly ranging bullish; 903.00 support is the key (based on the article)
Price on the weekly chart is above Ichimoku cloud in the primary bullish area of the chart for the ranging within the following support/resistance levels:
- 998.09 resistance level located in the beginning of the bullish trend to be resumed after ranging, and
- 903.00 support level located in the beginning of the secondary correction to be started.
Trend Strength indicator is estimating the trend as the future possible correction, and Absolute Strength indicator is evaluating the trend as the ranging in the near future for example.
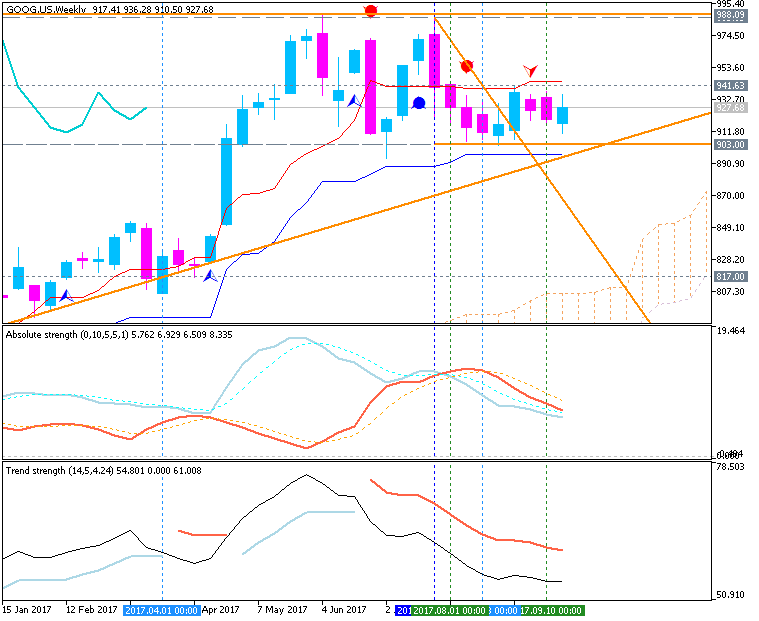
- "Google (NASDAQ: GOOG) recently announced that it was acquiring part of HTC’s mobile phone business for $1.1 billion. This is the second time Google has made an acquisition in the handset space. While the first acquisition of Motorola was primarily for the patent portfolio, the HTC deal appears to be more for the hardware and design team than intellectual property. Through this acquisition, Alphabet will once again try to challenge incumbents Apple and Samsung for the premium segment of the hardware smartphone market. This time, the company could pose a credible challenge to these companies, as Google’s Pixel handsets have been positively received. Below we explore why this acquisition makes sense."
-----------
The chart was made on D1 timeframe with Ichimoku market condition setup (MT5) from this post (free to download for indicators and template) as well as the following indicators from CodeBase:
- Price prediction by Nearest Neighbor found by a weighted correlation coefficient - indicator for MetaTrader 5
- MaksiGen_Range_Move MTF - indicator for MetaTrader 5
Forum on trading, automated trading systems and testing trading strategies
Sergey Golubev, 2017.10.05 10:28
Google - intra-day bullish breakout; 962.26 is the key (adapted from the article)
The price on H4 chart broke Ichimoku cloud to be reversed to the primary bullish market condition: price is testing 962.26 resistance level to above for the bullish trend to be continuing.
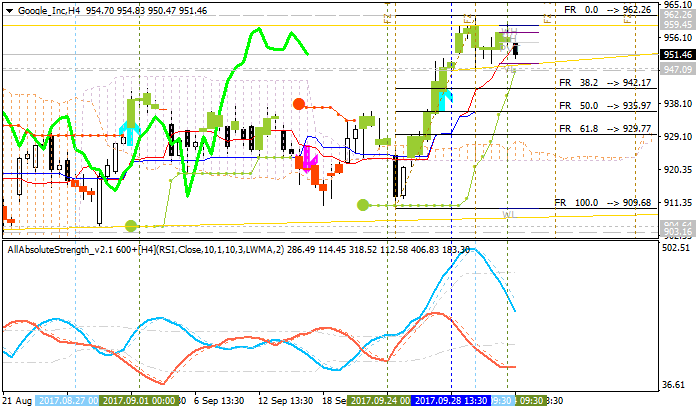
- "On Wednesday morning the company revealed Google Pixel Buds, intelligent wireless earbuds linked by a cloth cord that run Google Assistant. Touch controls on the right earbud to activate Google Assistant and control audio. Google says Pixel Buds are optimized for audio (obviously), but the slickest feature by far is translation. Tethered to an Android phone, the buds can do nearly real-time translation in 40 languages. An onstage demo at the company's Oct. 4 event was simple but impressive: an English/Swedish conversation translated in real time."
- "It's impossible to predict how Google Pixel Buds will be received when they arrive at market, but their real-time translation feature is certainly a powerful differentiator if it works as smoothly as it appeared to onstage today. That may not be an easy feat in the wild — a busy street or night market is a very different scenario from the controlled onstage one we saw today."
==========
The chart was made on H4 timeframe with standard indicators of Metatrader 4 except the following indicators (free to download):
- AllAbsoluteStrength - indicator for MetaTrader 4
- MaksiGen_Range_Move - indicator for MetaTrader 4
- iFibonacci - indicator for MetaTrader 4
- PriceChannel_Stop - indicator for MetaTrader 4
Forum on trading, automated trading systems and testing trading strategies
Sergey Golubev, 2017.10.23 13:20
Google - daily bullish ranging with narrow levels for direction; 997/978 are the keys (based on the article)
Daily share price is far above Ichimoku cloud in the bullish area of the chart. The price is on ranging within the narrow s/r level for the direction of the bullish trend to be resumed (997 resistance level) or for the secoindary correction to be started (978 support level).
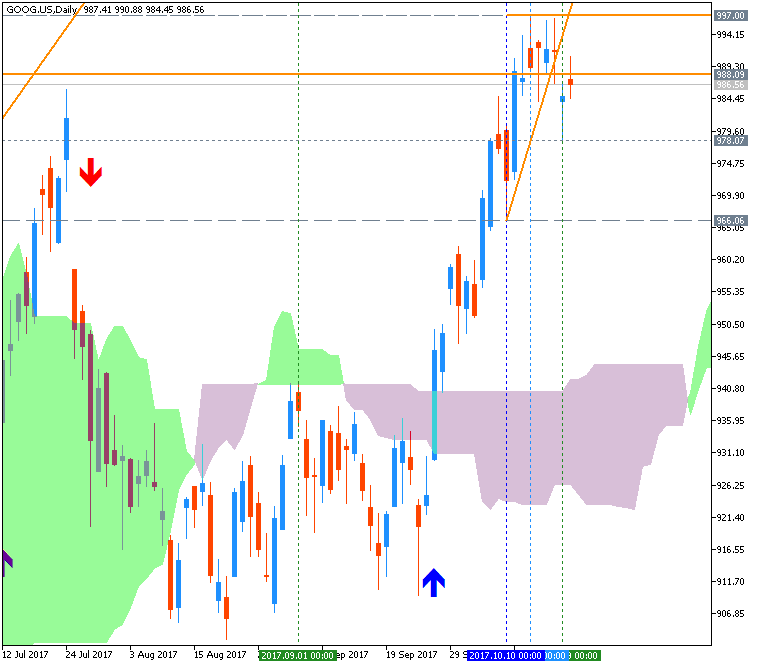
- "The Financial Times first reported Sunday that the cornerstone company of tech giant Alphabet is developing a new system that would help drive potential subscribers toward news publishers as part of a revenue-split agreement. According to the Times, Google has been negotiating with big names in news on such an arrangement for a while now, and specifically on using its signature ad-targeting tricks to help discover fresh subscribers for news sites."
- "In an interview with the Times, Google's news chief Richard Gringas said that any such arrangement would offer news publishers a better deal than the company gives on its advertising model, which directs 70% of revenue to visited websites."
============
Chart was made on MT5 with BrainTrading system (MT5) from this thread (free to download) as well as the following indicators from CodeBase:
- BrainTrend2Sig indicator from Codebase (free to download)
- Ichimoku Cloud - indicator for MetaTrader 5
- MaksiGen_Range_Move MTF - indicator for MetaTrader 5
All about BrainTrading system for MT5:
- BrainTrending indicators to download with template.
- Rules to trade manually
- How to install
Forum on trading, automated trading systems and testing trading strategies
Sergey Golubev, 2018.02.12 15:49
Google Is Getting Ahead Of Apple (based on the article)


- "Alphabet, Google’s parent company, is getting ahead of Apple on Wall Street lately. Alphabet’s shares have gained 27.54% over the last twelve months and 171.64% over the last five years, compared to 18.54% and 137.93% of Apple over the corresponding periods."
- "To be fair, Apple is ranked slightly above Google in the Drucker’s Institute list, but that has to do with Apple’s financial strength -- which may not last if the company fails to keep up with innovation."
- "Alphabet’s innovation lead over Apple can be further attributed to the company’s ability to better engage employees. Alphabet’s Employee Engagement and Development Score is 82 vs 61.8 for Apple. Alphabet’s ability to engage employees is also reflected in a number of best employer lists, where the company receives top scores, ahead of Apple. Alphabet ranks number 1 on Forbes’s World’s Best Employers list, number 1 on Fortune’s Best Companies to Work For, and number 5 on Glassdoor’s Top Places To Work For."
----------------
The charts were made on W1 timeframe with Ichimoku market condition setup (MT5) from this post (free to download for indicators and template) as well as the following indicator from CodeBase:
- Price prediction by Nearest Neighbor found by a weighted correlation coefficient - indicator for MetaTrader 5
- Fibo Bar MT5 - indicator for MetaTrader 5
----------------
My comment: if we look at the weekly chart so we can see the following:
- Google (Alphabet) stock weekly price is on the secondary correction to be started, and the weekly bearish reversal levels (942/908) are very far from the market price, that means that the bearish reversal is very unlikely for the seeveral coming months.
- Apple weekly stock price is testing support level at 150 which is the bearish weekly reversal level so if the price breaks this level to below on close weekly price so the bearish reversal will be started.
Can someone recommend a broker to me?
The reply is on ths small thread by few posts: Which is the Best Forex Broker to Trade with Please Suggest
- Free trading apps
- Over 8,000 signals for copying
- Economic news for exploring financial markets
You agree to website policy and terms of use
Google April-June 2017 Forecast: weekly ranging to be stated or the secondary correction to be continuing; 853 resistance is the key
The weekly shares price is on secondary correctional movement within the primary bullish market condition: the price is located above Ichimoku cloud for the correction to be started in the middle of March this year by bouncing from 853.21 to below for 808.81 support level to be testing for the correction to be continuing.
Chinkou Span line is above the price indicating the ranging condition by direction, Trend Strength indicator is estimating the trend as a primary bullish, and Absolute Strength indicator is evaluating the trend as a ranging. Non-lagging Tenkan-sen/Kijun-sen signal is for bullish market condition to be resumed for now and in the near future for example.
If W1 price breaks 790.38 support level to below on close bar so the secondary correction within the primary bullish market condition will be continuing.
If weekly price breaks 853.21 resistance level to above on close bar so the bullish trend will be resumed.
If not so the price will be on bullish ranging within the levels.
SUMMARY: bullish
TREND: ranging to correction