LiteForex Analytics
AUD/USD: Analysis and forecast (07.05.2013)
1. Current trend
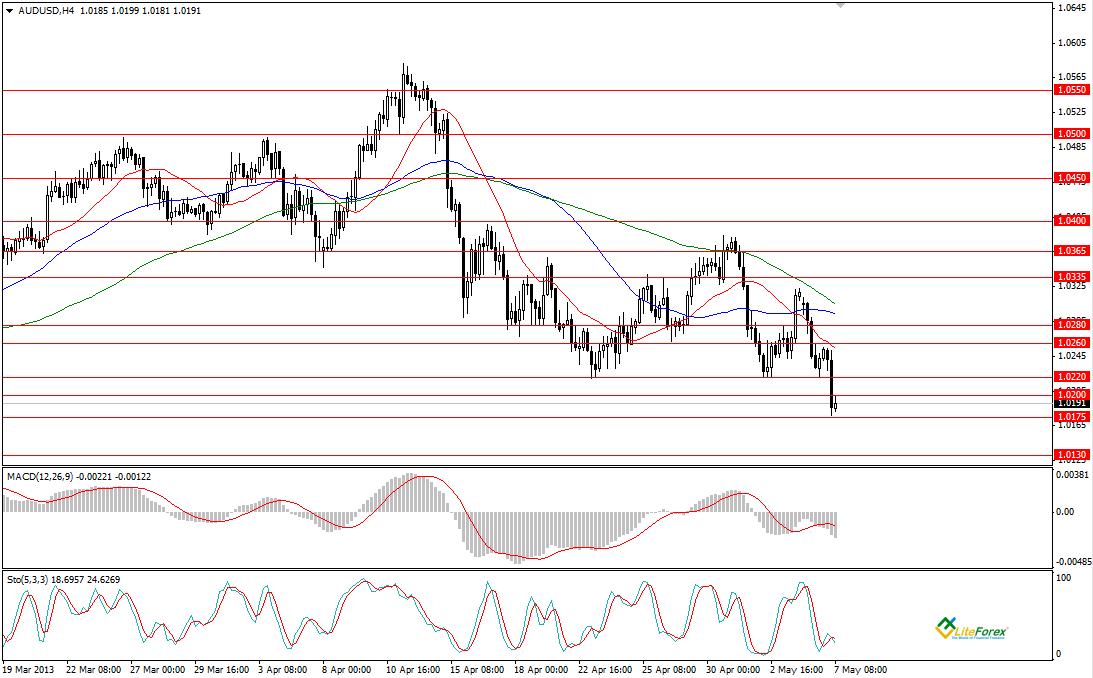
The pair AUD/USD has been declining for a month. At today’s meeting the Reserve Bank of Australia has lowered interest rate by 0.25%, from 3% to 2.75%. Therefore, although many analysts predicted that interest rate would be left unchanged, the Bank of Australia decided to make the change. Before that the pair traded near the level of 1.0240, but after the news was announced, the rate fell to the level of 1.018. Later, the rate corrected to the level of 1.02 and trading is likely to take place below this level.
Technical indicators do not show significant decline. On the most timeframes Stochastic is in the oversold zone. The signal line and histogram of MACD indicator are in the negative zone, indicating sideways movement. All three moving average lines are directed downward.
2. Levels of support and resistance
The nearest resistance level is 1.02, which is being actively tested by the “bulls” at the moment; however, it is unlikely that the “bulls” will break this level down. Nevertheless, if this level is successfully broken down, next resistance levels will be 1.0220 and 1.0260. The nearest support level is 1.0175, after that the “bears” will target at 1.0130.
3. Trading tips
The most feasible scenario is further decline in rate. Short positions are recommended starting from the level of 1.020, but do not forget about protective orders.
Ilya Lashenko
Analyst of LiteForex Group of Companies
liteforex, one of the worst brokers i have ever traded with in my 4 years of trading.
incessant requotes
freezing of platforms during news
trade not closing at take profit
deduction of equity
some closed trades disappearing from account history
different price feeds on different computers even on same account
different price feed on mt4 and mt5
the list is much, careful folks, this market makers have eaten more than $20,000 from me. funny enough, it all reduced when i dumped them for another broker though it was very late
USD/CAD: The data from Canadian labour market can trigger decline in the pair
1. Current trend of the currency pair USD/CAD
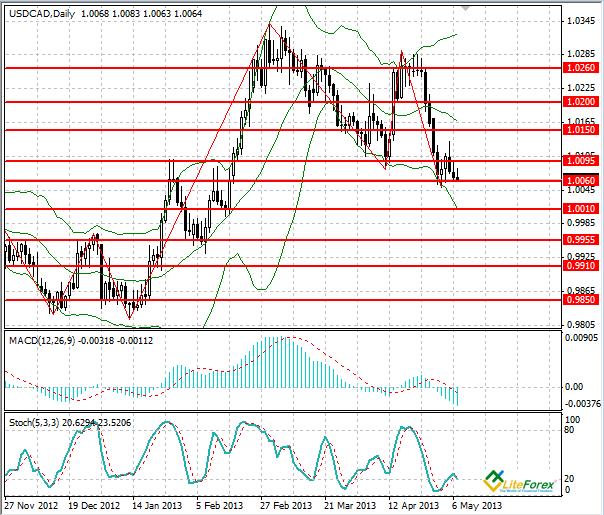
The currency pair USD/CAD has traded in the range of 1.0095-1.0060 since the beginning of the week. Last Friday the pair went down due to positive statistics on the American labour market and the number of jobs, excluding agricultural sector that increased by 165 thousand in April. Unemployment rate fell to 7.5%. The Canadian dollar is also supported by the data on Canadian construction sector: number of permit to construct in Canada increased up to 8.6%, giving hope that business activity in construction sector will increase, which will trigger downward movement in the pair.
2. Important levels (support and resistance)
Despite positive news, the pair USD/CAD still traded in the range of 1.0095-1.0060 and this trend will continue in the near future. Market is consolidating, preparing for Friday, when fundamental data on employment and unemployment rate in Canada for April will be known. If the data will be positive, as has been predicted, the price may go down to the levels of 1.0010, 0.9955 and 0.9910. Otherwise, reversal will be possible and the price may go up to the levels of 1.0150, 1.0200 and 1.0260. It is likely that short-term trading in the channel will take place. If the price consolidates below the level of 1.0060-1.0050, short positions can be opened with profit taking at the level of 0.9910.
3. Technical indicators
On the daily chart “Bollinger bands” indicator demonstrates divergence of the lines, indicating downtrend. The price chart is in the bottom band. MACD histogram is in the oversold zone, volumes continue to increase. The lines of Stochastic are directed downward and will form a sell signal in the near future.
Dmitriy Zolotov
Analyst of LiteForex Group of Companies
1. Current trend
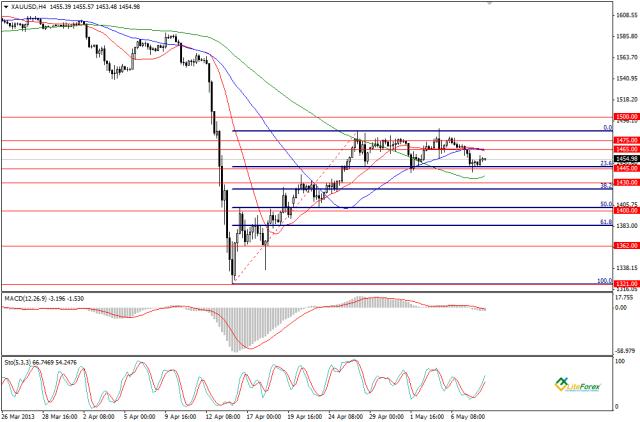
Gold still traded in the narrow range of 1475.00-1445.00 USD per troy ounce. Yesterday the metal was under pressure and the price fell to the bottom limit of the channel. Investors put a stop to gold trade, focusing on the American stock market, where stocks have demonstrated growth lately. It is likely that the price will rebound from the level 23.6 Fibonacci and go up to the top limit of the channel. Stochastic indicator is in the overbought zone, indicating growth. MACD shows sideways movement: the signal line and histogram are near the zero line.
2. Levels of support and resistance
Yesterday, the pair tested support level of 1445.00, which was strong and prevented further decline in price. Next support level is 1430.00. The nearest resistance level is 1465.00. If this level is broken down the price will go up to 1475.00 and 1490.00.
3. Trading tips
The most feasible scenario is the rise in gold; therefore it makes sense to open long positions with the target to take profit near 1475.00.
Ilya Lashenko
Analyst of LiteForex Group of Companies
BRENT: Analysis and forecast (10.05.2013)
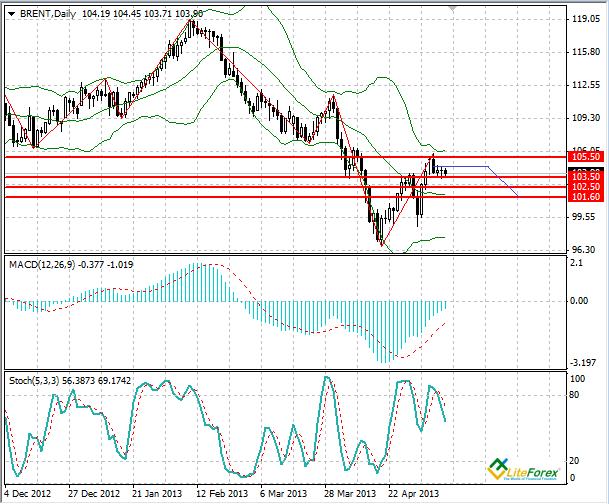
1.Current trend of Brent rate
Crude oil Brent has traded in the range of 105.50-103.50 this week. Sideways movement of oil quotes is explained by some uncertainty in the market. On the one hand, investors are concerned about deterioration of economic situation in EU countries. Situation in China is not very optimistic either; economic indices of the country are declining, which shows slowdown in economic pace. On the other hand, oil process are supported by tension in the Middle East and signs of economic recovery in the USA, which can lead to revision and curtailing of the Quantitative easing program by the U.S. Fed.
2. Important levels (support and resistance); best entry/exit points
At the moment, oil traded near the boundary of the range at the level of 103.90. Sideways movement can continue in future and the price may go down to the levels of 102.50 and 101.60. It is advisable to place short positions from the level of 103.50 with profit taking near 101.60.
Technical indicators give mixed signals, showing uncertainty of the market. On the daily chart “Bollinger bands” indicator demonstrates sideways movement of the lines. The price chart is tending to the moving average, giving a chance of downward movement in price to the level of 101.60. MACD histogram can cross the zero line from bottom to top in the near future and form a buy signal; while the lines %D and %K of Stochastic are directed downward, giving a signal of possible downward movement in price.
Dmitriy Zolotov
Analyst of LiteForex Group of Companies
AUD/USD: The pair is weakening in advance of the speech of the U.S. Fed chairman
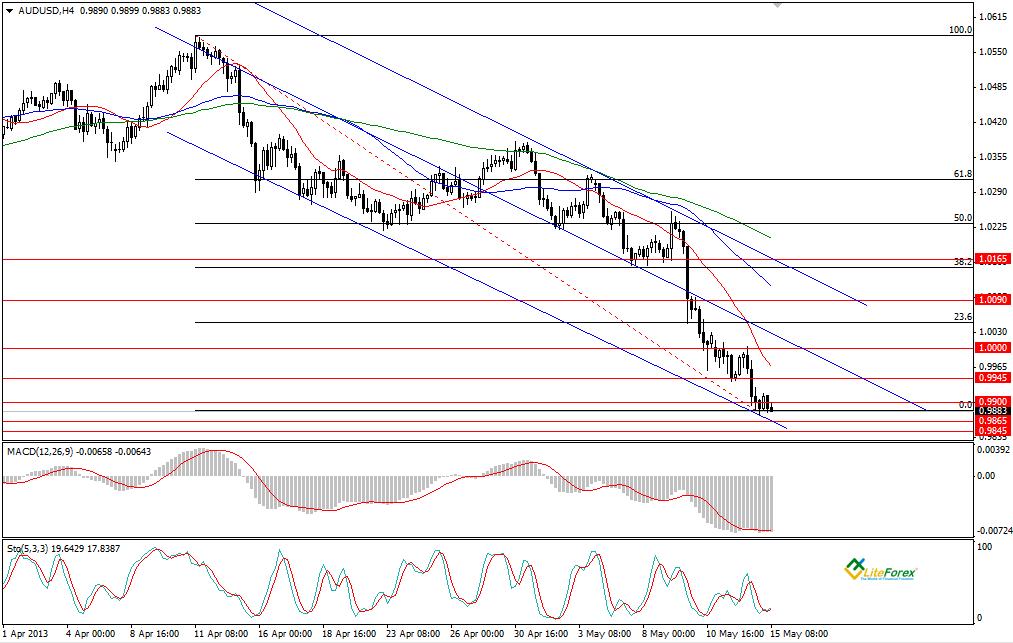
1.Current trend of the currency pair AUD/USD
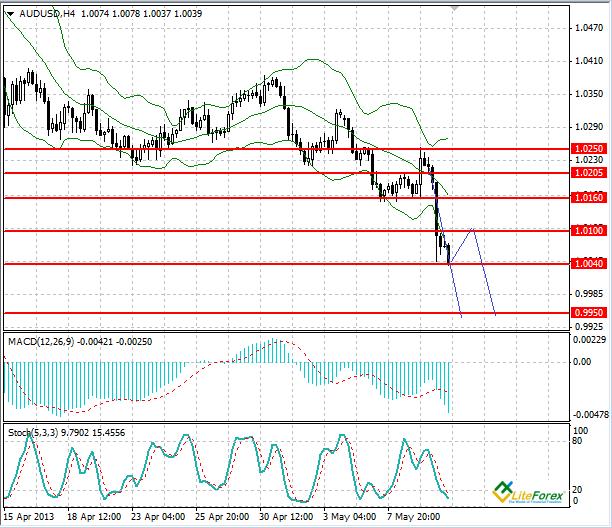
The currency pair AUD/USD has traded in the narrow range of 1.0205-1.0160 since Tuesday; however on Thursday, after the release of positive data from Australian labour market, the price tried to reach resistance level of 1.0250, as part of ascending correction, but failed to break it down. After that the pair rapidly declined and within 24 hours it lost about 200 points, reaching the lows since June last year. The rise in demand for the USD among investors was triggered by assumption that improvement of American economy and decline in unemployment rate up to 7.5% in April, will lead to curtailing of quantitative measures by the U.S. Fed.
2.Important levels (support and resistance)
At the moment the pair is actively testing support level of 1.0050-1.0040, and if this level is exceeded, the price can fall to 0.9950 and 0.9800. During the day ascending correction to the level of 1.100 may take place, however it will not affect general downward movement. In the current situation it is advisable to place short positions from the level of 1.0030 with profit taking at the level of 0.9800.
3.Technical indicators
On the four-hour chart “Bollinger bands” indicator does not demonstrate divergence of the lines, confirming continuation of the downtrend. The price chart has recently broken down the lower line, giving a chance of temporary ascending correction. Histogram of MACD indicator is in the oversold zone and volumes are increasing. The lines of Stochastic have crossed oversold line (20), suggesting that price will continue to decline.
Dmitriy Zolotov
Analyst of LiteForex Group of Companies
XAG/USD: Technical analysis of 15.05
1. Current trend
After the sharp decline of silver price in the middle of last month, XAG/USD seemed to move to correction phase, starting to regain from losses; however this period had a short-run and at the moment the metal is in the “bearish” phase. The pair is approaching the lower boundary of the channel, therefore correction may take place in the near future. Histogram and the signal line of MACD indicator are in the negative zone, indicating, however, that sideways movement is likely to take place. Stochastic is in the oversold zone, the line %D has crossed %K, giving a sell signal.
2. Levels of support and resistance
At the moment the pair traded at the level of 61.8 Fibonacci; in case of breakdown of this level, the pair will go down to the levels of 22.90 and 22.60. The nearest resistance levels are 50.0 and 38.2 Fibonacci.
3. Trading tips
The pair traded in the rather narrow channel, therefore it is advisable to place limits at the boundaries of the channel at 22.90 and 23.80.
Ilya Lashenko
Analyst of LiteForex Group of Companies
USD/JPY: technical analysis of 20.05
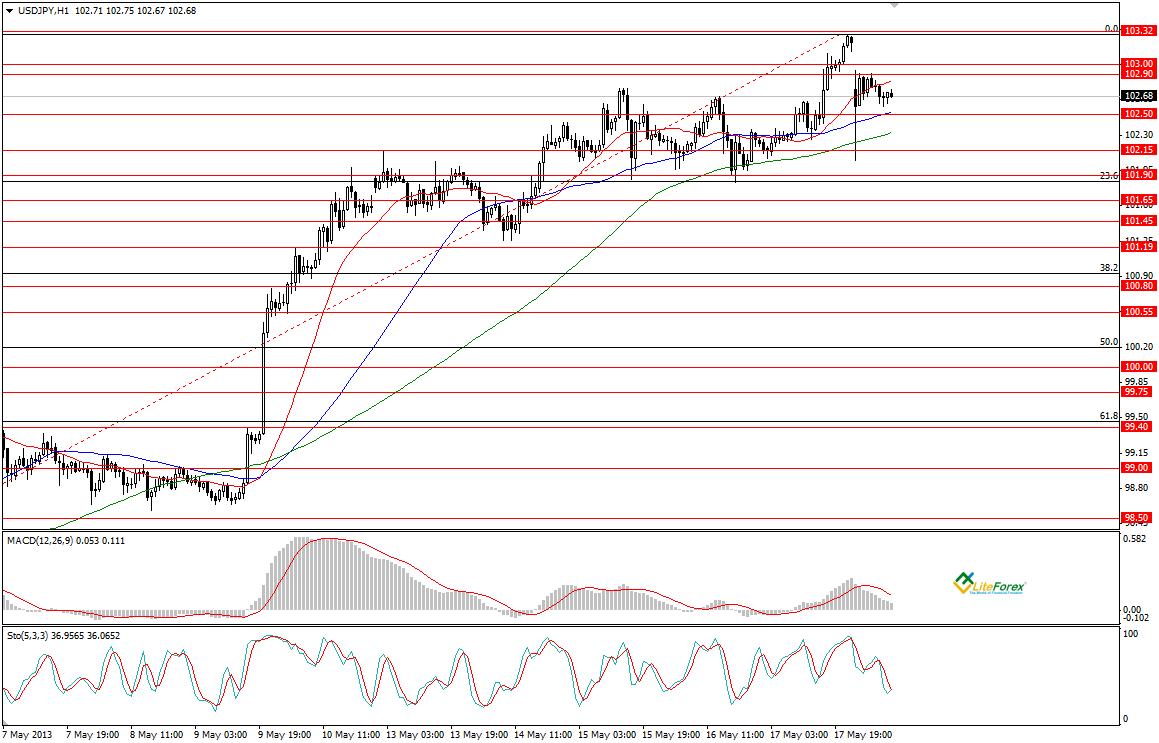
1. Current trend
Last week the pair reached new highs at the level of 103.30 and completed trading session at the level of 103.10. Opening session started with the gap and the price almost immediately fell to 102 yen per USD; however later the price went up to the level of 102.7, and is still trading at this level.
Technical indicators give mixed signals. MACD shows the decline: the signal line is directed down, volumes continue to decrease. Stochastic is near the moving average line and is giving a buy signal.
2. Levels of support and resistance
The nearest support level is 102.5, if this level is broken down, the price will go down to 102.15 and 101.9. Resistance is the level of 102.9. This level has been tested today and prevented the rise in price. The main target of the bulls is the level of 103.30.
3. Trading tips
It is likely that the price will move in the channel 103.00-101.90. It makes sense to place pending orders and trade from the boundaries of the channel.
Ilya Lashenko
Analyst of LiteForex Group of Companies
USD/CAD: Two-week growth may shift into the decline
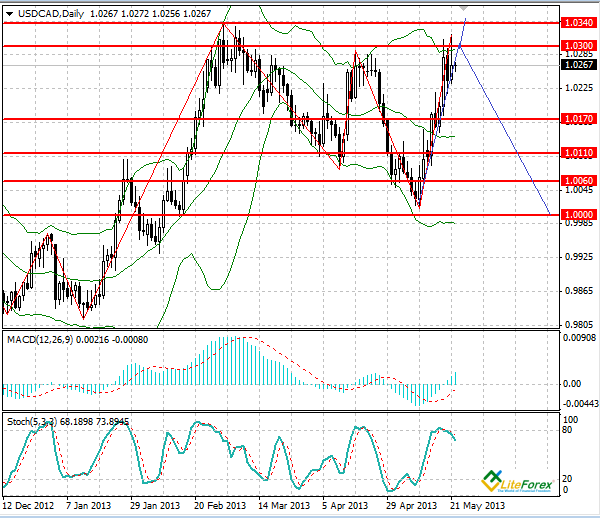
1. Current trend of the currency pair USD/CAD
This week the currency pair USD/CAD has traded in the range of 100 points. The pair went up and reached three-month highs at the level of 1.0340 due to expectations that the U.S. Federal Reserve would curtail some of the incentive measures. However, after the statements of several American senior officials that bond purchase program should be continued, the price has corrected and at the moment traded at the level of 1.0270.
2. Important levels (support and resistance)
It is likely that the price will continue go up to 1.0300, as the Canadian currency is under pressure from the decline in commodity prices and expectations of the decrease of retail sales volume in Canada. The level of 1.0300 seems as the key one, and the price may push off from this level and start long-term downward movement to the levels of 1.0170, 1.0110, 1.0060 and 1.0000.
Note, that chairman of the U.S. Federal Reserve Ben Bernanke will give a speech today and minutes of the last meeting of the Federal Reserve will be released. The minutes can shed the light on the further actions of the American monetary authorities. It is expected that quantitative easing program will not be curtailed so far, which can trigger downward movement in the pair.
In the current situation it is advisable to open short-term buy positions from the level of 1.0280, sell positions are recommended starting from the level of 1.0300 with profit taking near 1.0170.
3. Technical indicators
On the daily chart “Bollinger bands” indicator does not show significant divergence of the line; the price chart has reached the top line, giving a chance of reversal movement to the moving average. MACD histogram is in the overbought zone, its volumes are increasing. Stochastic lines are directed downward and are forming a signal of downward movement in price.
Dmitriy Zolotov
Analyst of LiteForex Group of Companies
Forex: Ichimoku Clouds: Review of XAU/USD
XAU/USD, H4
Look at the four-hour chart. The line Tenkan-Sen has crossed Kijun-Sen from bottom to top under the cloud, forming the pattern “Golden cross”. The line Chinkou Span is approaching the price chart from below; current cloud is descending. The price has gone above the line Tenkan-Sen, which becomes the nearest support level (1380.42). Next obstacle on the upward way of price is the bottom boundary of the cloud (1416.45-1407.86).
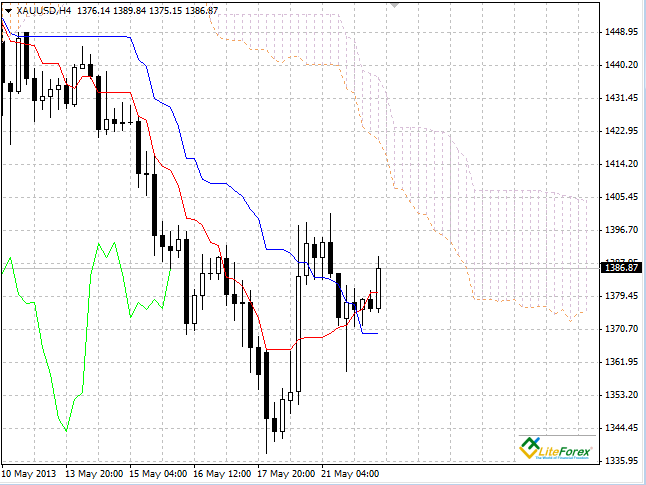
XAU/USD, D1
On the chart with the timeframe D1 the line Tenkan-Sen is below Kijun-Sen, and is directed sharply downward. The line Chinkou Span is above the price chart; current cloud remains downward. The nearest resistance level is the line Tenkan-Sen (1406.89). Estimated level of support is one of the previous extremums of the line Chinkou Span (1385.46).

Key levels
Resistance levels: 1416.45-1407.86 and 1406.89.
Support levels: 1380.42 and 1385.46.
Trading tips
On the four-hour chart the price went up above the levels of Tenkan-Sen and Kijun-Sen because of pressure from the “Golden cross,” however, failed it to reach the lower boundary of the cloud. It is the best moment for opening long positions with the targets of 1416.45-1407.86. The chart of the higher timeframe has not yet confirmed trend reversal, as the price was not able to consolidate above the level of Kijun-Sen.
Anastasiya Glushkova
Analyst of LiteForex Group of Companies
- Free trading apps
- Over 8,000 signals for copying
- Economic news for exploring financial markets
You agree to website policy and terms of use
XAU/USD: Technical analysis (02.05.2013)
1. Current trend
After sharp decline in the gold price in the middle April, gold is gradually regaining from losses. After reaching the level of 1584 USD per troy ounce, gold suspended growth and is presently in the consolidation phase. It is likely that today’s meeting of the Central Bank will have an impact of the price movement, as the interest rate will to be probably reduced by 25 basis points at the meeting. Tomorrow the data on the U.S. labour force excluding agricultural sector is scheduled for the release.
Technical indicators give mixed signals. MACD indicator shows the decline: the signal line is directed downward, volumes are decreasing. Stochastic is on the contrary shows the rise: both lines are directed upward.
2. Levels of support and resistance
The nearest support level is 1445.00, which coincides with the level 23.6 Fibonacci. Next support levels are 1430.00 and 1400.00. Resistance levels are 1475.00 and 1500.00.
3. Trading tips
If consolidation continues, trading can start from the channel boundaries of 1445.00-1480.00. Buy orders can be placed if the price consolidates above the level of 1500.00.
Ilya Lashenko
Analyst of LiteForex Group of Companies