Join our fan page
- Views:
- 28029
- Rating:
- Published:
- Updated:
-
Need a robot or indicator based on this code? Order it on Freelance Go to Freelance
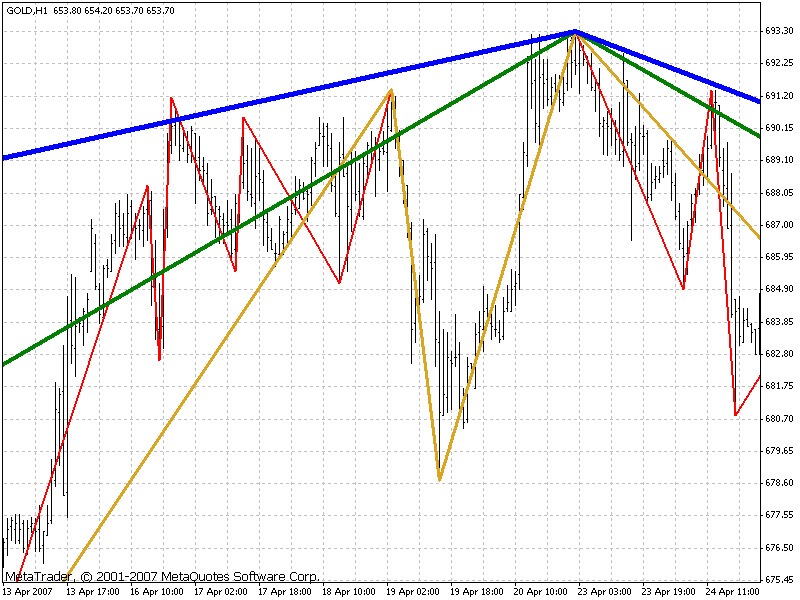
For the fans of ZigZag: a small indicator that draws multiple ZigZags from different timeframes on one timeframe. Four ZigZags are implemented (H1, H4, D1, W1). The timeframe should be selected as the minimal of the displayed ones, i.e. here it is H1. On all other timeframes it is drawn incorrectly, there are no timeframe checks.
Almost the same is present in ZUP by nen (DT mode). I decided to make a separate indicator to demonstrate the algorithm itself, which allows to display the indicators from other timeframes on the current one. Please note the checks in the start() function: they are required for the correct display of the "other" ZigZags, to make sure there are no plateaus near their extremums.
The ZigZag edited by Rosh is also attached. The code is not large, so replacing this ZigZag with other is not difficult. For that it is enough to make changes to the external parameters and to the ZZ() function: all the ZigZag parameters are "hidden" within function. If the parameters need to be changed depending on the timeframe, it will be a little more difficult, but not daunting.
The ZigZag colors correspond to the rainbow colors in ascending order («Richard Of York Gave Battle In Vain»): red - H1, orange (here - Goldenrod) - H4, green - D1, blue - W1.

Multiple ZigZags in a single window
Translated from Russian by MetaQuotes Ltd.
Original code: https://www.mql5.com/ru/code/7223
 ShowOrdersOnChart
Small indicator for monitoring the history of closed and the status of open orders on the chart. Red - unprofitable order, green - profitable.
 ACD_PV
Belongs to the Pivot group.
 MCVA - Multichart Visual Analyser
The script helps to perform the visual analysis of multiple currency pairs on a custom time frame.
 Avg Daily Range
The Avg Daily Range indicator.