Join our fan page
- Views:
- 25298
- Rating:
- Published:
-
Need a robot or indicator based on this code? Order it on Freelance Go to Freelance
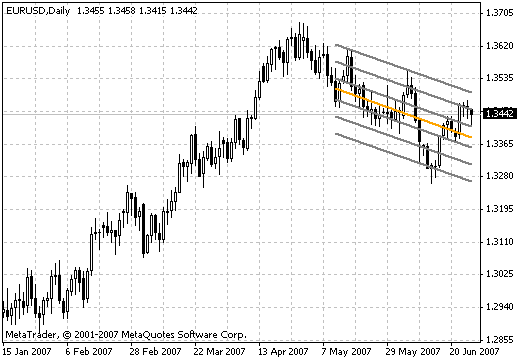
When applied to financial markets this method is usually used to determine the moments of prices extreme deviation from the "standard" level.
Plotting of a trend line using linear regression is based on the least squares method. This method assumes that a straight line is plotted that passes through the price points so that the distance between the price points to the line is minimal. In an attempt to predict tomorrow prices, it is logical to assume that they will be located close to the values of today's prices. If there is an uptrend, the best guess would be that the price value will be close to the current one with a certain upward deviation. Regression analysis provides statistical confirmation of these assumptions.

Translated from Russian by MetaQuotes Ltd.
Original code: https://www.mql5.com/ru/code/7197
 T3_adx_+di_-di_burst
Smoothing for the ADX indicator. Recalculates the specified number of bars at every tick (not optimized)
 BW-wiseMan-1
The first version of the wlxBWWiseMan indicator. Displays the candles of trend changes.
 T3 TRIX (ROC of T6)
The TRIX indicator represents the rate-of-change percentage, smoothed by the exponential МА of the closing price.
 StrangeIndicator
This indicator belongs to the oscillator group.