Join our fan page

PriceChanges - indicator for MetaTrader 5

- Views:
- 2858
- Rating:
- Published:
-
 You are missing trading opportunities:
- Free trading apps
- Over 8,000 signals for copying
- Economic news for exploring financial markets
Registration Log inYou agree to website policy and terms of use
If you do not have an account, please register -
 Need a robot or indicator based on this code? Order it on Freelance
Go to Freelance
Need a robot or indicator based on this code? Order it on Freelance
Go to Freelance
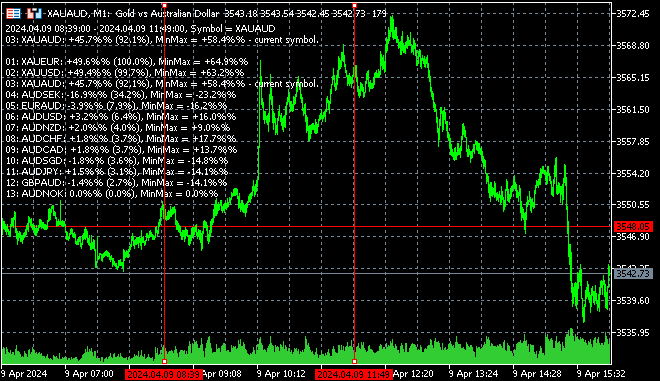
This multi-symbol indicator shows the price changes of symbols from the Market Watch between two dates defined by vertical lines.
This provides a convenient opportunity to evaluate what and how much has moved/moves to better/faster represent the market situation as a whole.
Management.
The dates are supposed to be managed with the mouse. And display - through the keyboard by following keys.
#define  KEYCODE_KEY_C          67 // |C| - KEY_C
#define  KEYCODE_NUMPAD_0       96 // |0| - NUMPAD_0
#define  KEYCODE_OPEN_BRACKET  219 // |[| - OPEN_BRACKET
#define  KEYCODE_CLOSE_BRACKET 221 // |]| - CLOSE_BRACKET
That allows you to quickly switch between the corresponding symbols. Convenience can be felt only by launching and trying it.
Features.
The indicator restarts itself at startup. And self-starts when it changes the symbol.
Translated from Russian by MetaQuotes Ltd.
Original code: https://www.mql5.com/ru/code/49132
Second Bars
The indicator draws an arbitrary second timeframe on the chart.
Uniformity Factor Indicator
This is a simple analytical (non-signal, one-time calculated) indicator that allows you to test the hypothesis that price timeseries represent a "random walk", specifically Gaussian "random walk". This can help to construct a parametric transformation of price increments into evenly distributed, more stable and predictable time series, at least in terms of volatility.
Chande Kroll Stop
Chande Kroll Stop indicator - stop levels for short and long positions.
 CTsLogger - Simple and Flexible Logger
A logger with the ability to log specific modules or code sections