Join our fan page

Chande Kroll Stop - indicator for MetaTrader 5

------------------------------------------------
Reliable, high quality. Help you check your strategy in StrategyTester, offer options to increase profitability. I write as a tester, and for demo and live trading.
- Views:
- 4395
- Rating:
- Published:
-
 You are missing trading opportunities:
- Free trading apps
- Over 8,000 signals for copying
- Economic news for exploring financial markets
Registration Log inYou agree to website policy and terms of use
If you do not have an account, please register -
 Need a robot or indicator based on this code? Order it on Freelance
Go to Freelance
Need a robot or indicator based on this code? Order it on Freelance
Go to Freelance
Chande Kroll Stop indicator is an indicator for determining the level of stop loss setting. It represents two lines on the price chart. The red line represents the stop level for a short position, while the green line represents the stop level for a long position.
- Theline for long positions (blue) shows at what level a stop loss should be set for long positions. If the asset starts to fall and reaches the level of this line, it may be a signal to close purchases.
- Theline for short positions (red), on the contrary, indicates the level at which short positions should be closed. If the price of an asset starts to rise and touches this line, it may be a signal to close sales.
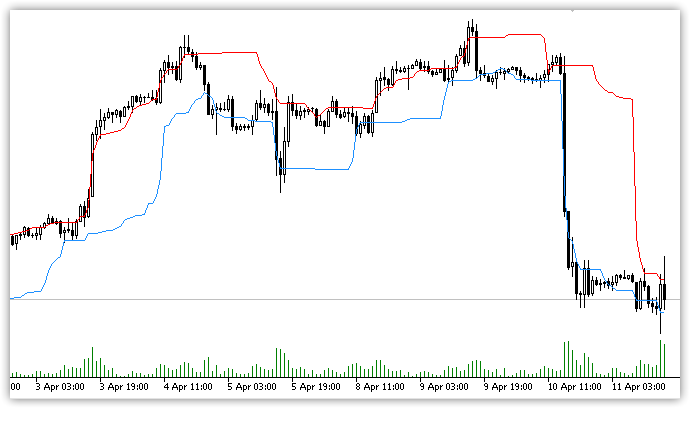
Chande Kroll Stop is calculated on the basis of the true range and therefore is positioned as an indicator independent of the instrument volatility.
The indicator was first discussed and implemented in "The New Technical Trader" written by Tushar Chande and Stanely Kroll.
Designed as a trend following indicator, the Chande Kroll Stop indicates stop levels for the trader by calculating the average true range of the market trend while taking into account any market volatility.
The indicator calculation is based on the maximum and minimum price values for a certain period, and the standard deviation (ATR). These data allow the indicator to "feel" the market and adjust its values according to the current market situation.
Market volatility plays a key role in the calculation of the indicator. At high volatility, the Chande Kroll Stop lines will be located further away from the current price, giving the investor more room for market fluctuations. At low volatility, on the contrary, the lines will be closer to the price, which allows to react faster to any changes.
Translated from Russian by MetaQuotes Ltd.
Original code: https://www.mql5.com/ru/code/49175
PriceChanges
changing character prices on an interval
Second Bars
The indicator draws an arbitrary second timeframe on the chart.
 CTsLogger - Simple and Flexible Logger
A logger with the ability to log specific modules or code sections
 Indiana Jones Mean Reversion EA
This is a simple mean reversion EA