Watch how to download trading robots for free
Find us on Telegram!
Join our fan page
Join our fan page
You liked the script? Try it in the MetaTrader 5 terminal
- Views:
- 8942
- Rating:
- Published:
-
Need a robot or indicator based on this code? Order it on Freelance Go to Freelance
Author:
Eli hayun
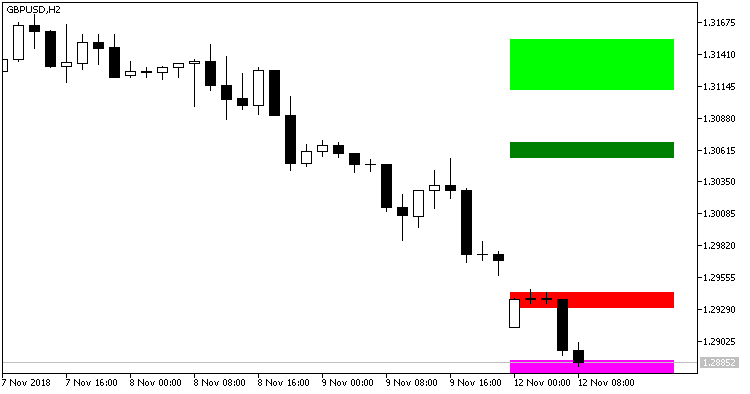
The indicator shows possible resistance and support zones in the form of colored rectangles.
//+----------------------------------------------+
//| Indicator input parameters                   |
//+----------------------------------------------+
input ENUM_TIMEFRAMES Timeframe=PERIOD_D1;  //Indicator timeframe used for calculations
input uint   NumberofBar=1;                 //Bar number for the indicator calculation
input double Ratio1 = 0.618;                //First ratio
input double Ratio2 = 1.382;                //Second ratio
input color  Color_Res2 = clrLime;          //The color of the second resistance zone
input color  Color_Res1 = clrGreen;         //The color of the first resistance zone
input color  Color_Sup1 = clrRed;           //The color of the first support zone
input color  Color_Sup2 = clrMagenta;       //The color of the second support zone
input uint   RightTail=60;                  //Projection of the rectangles to the right beyond the zero bar, in minutes
input uint   LeftTail=60;                   //Projection of the rectangles to the left beyond the starting bar, in minutes
This indicator was first implemented in MQL4 and published in the Code Base at mql4.com on 30.01.2008.

Fig.1. The Fib_SR indicator
Translated from Russian by MetaQuotes Ltd.
Original code: https://www.mql5.com/ru/code/23195
 SpearmanRankCorrelation_Histogram_Alerts
The SpearmanRankCorrelation_Histogram indicator with the ability to send alerts, emails and push notifications when trading signals emerge
 SignalTable_Sar_MFI_TEMA
The indicator shows Buy and Sell signals of three indicators (iSAR, iMFI и iTEMA) located in nine timeframes, with full settings
 Fib_SR_6
The Fib_SR indicator with two additional support and resistance zones.
 jMaster RSI
The Expert Advisor is based on the RSI Custom Smoothing indicator.