Join our fan page

Slope_Direction_Line_Bar - indicator for MetaTrader 5
- Views:
- 9794
- Rating:
- Published:
-
 You are missing trading opportunities:
- Free trading apps
- Over 8,000 signals for copying
- Economic news for exploring financial markets
Registration Log inYou agree to website policy and terms of use
If you do not have an account, please register -
 Need a robot or indicator based on this code? Order it on Freelance
Go to Freelance
Need a robot or indicator based on this code? Order it on Freelance
Go to Freelance
Trend-following Slope Direction Line / Moving Average confirmation bars signal indicator is an equivalent of Slope Direction Line / Moving Average confirmation candles indicator. It compares direction of two moving averages: Moving Average and Slope Direction Line and displays colored signal pointers in a separate window. Their colors correspond to the match/mismatch of Slope Direction Line and Moving Average lines direction.
It has six input parameters:
- MA period - Moving Average calculation period
- MA method - Moving Average calculation method
- MA applied price - Moving Average calculation price
- SDL period - Slope Direction Line calculation period
- SDL method - Slope Direction Line calculation method
- SDL applied price - Slope Direction Line calculation price
- If Moving Average and Slope Direction Line are directed upwards:
- the green signal pointer is set
- If Moving Average and Slope Direction Line are directed downwards:
- the red signal pointer is set
- In any other case, the gray signal pointer is placed.
Slope Direction Line indicator is not required - it is calculated by the indicator independently.
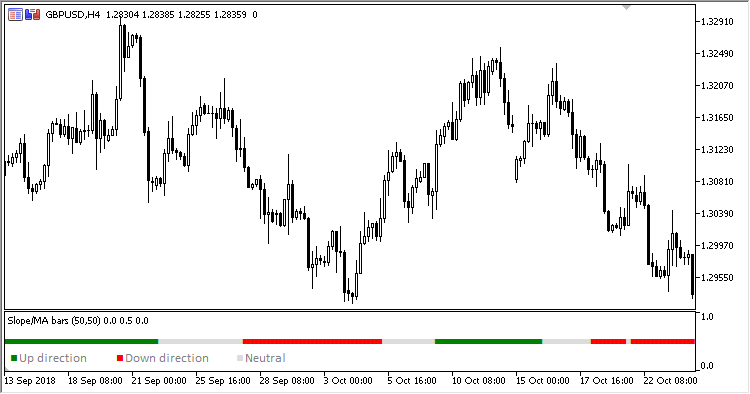
Fig. 1. Slope Direction Line / Moving Average confirmation bars
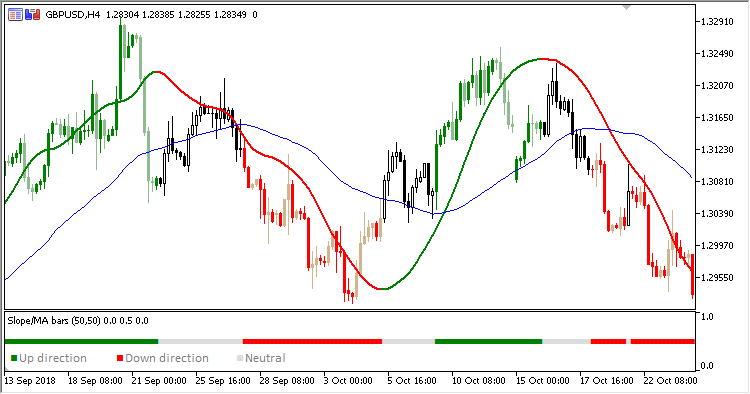
Fig. 2. Slope Direction Line / Moving Average confirmation bars + Slope Direction Line / Moving Average confirmation candles
Translated from Russian by MetaQuotes Ltd.
Original code: https://www.mql5.com/ru/code/22946
VGridLine_Custom
The indicator plots one vertical line per day in a specified moment of time
ColorRSI_X20
RSI_X20 indicator is able to color each line depending on its position relative to overbought and oversold areas
Slope_MA_Confirmation
Slope Direction Line / Moving Average confirmation candles indicator
Moving Average applied price
Now you can test the indicator and select the price type from the ENUM_APPLIED_PRICE enumeration