Join our fan page
- Views:
- 23527
- Rating:
- Published:
-
Need a robot or indicator based on this code? Order it on Freelance Go to Freelance
Almost every trader used or at least took a look at Gerald Appel's MACD. Looking at our Old Bag of Tricks we rescued a technique several traders used/use which is adding additional filters to MACD in order to avoid false or weak entry signals over traditional crossovers.
We cannot recall in the material we rescued where/when this technique was created and who was the author, so if you know that, please tell us and we will credit him/her properly.
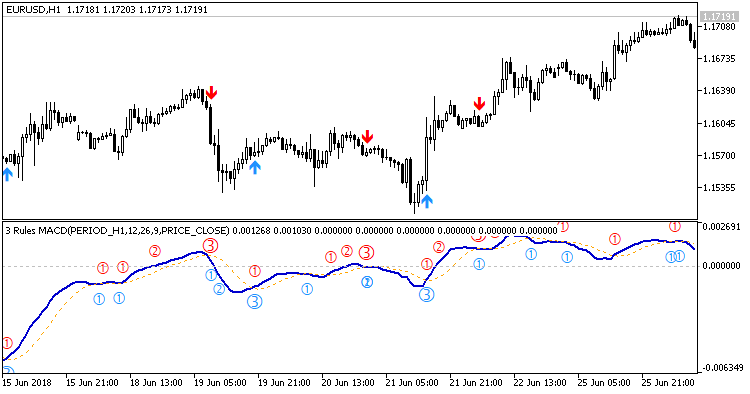
The rules are quite simple and we split the indicator in 2 parts, so the user can use the first part as a starting point for a trading setup - for manual trading or plugging in into an EA - and the second one as a visualizer for the patterns being found in the chart. We love visual cues so we did the maximum in this second part so the users willing to use this indicator as a part of a setup (or filter) in a manual trading operation gaining visual aids as the entry point is arriving.
Buy Signal
- When MACD line (blue) crosses below the Signal line (dotted orange), AND.
- When MACD line crosses below Zero line, AND.
- When MACD line crosses above the Signal line.
Sell Signal
- When MACD line (blue) crosses above the Signal line (dotted orange), AND.
- When MACD line crosses above Zero line, AND.
- When MACD line crosses below the Signal line.
Indicator 1 Minions.3RulesMACD_Signal can be used alone and/or be plugged in as a entry signal or a filter. It shows on a chart the theoretical BUY and SELL signals as colored arrows.
Indicator 2 - Minions.3RulesMACD_Patterns can be added to the chart along with indicator 1 or used alone. Both indicators have no internal bond between them. This indicator 2 will open in a sub window, plot the traditional MACD in a 2-line format (no Histogram) and additionally will plot in colors the formations of the entry points, numbering them as 1-2-3, being 3 the climax, that corresponds the the arrows found in Signal indicator 1.

Hope this indicator will be useful to the community!
Please feel free to post bugs, comments, ideas and tips on what type of markets, stocks and timeframes this indicator performs well.
 DEMA_Range_Channel
A channel formed by two Double Exponential Moving Averages based on averaged High and Low timeseries
 Exp_BrainTrend2_AbsolutelyNoLagLwma_MMRec
Two independent trading systems using indicators BrainTrend2 and AbsolutelyNoLagLWMA within one EA, with an option of changing the size of the future trade depending on the results of the previous ones for this trading system
 Intraday Channel Breakout
Indicator that is checking for intra-day channel values and breakouts of those channels.
 Accumulative Swing Index Smoothed
This version of the Accumulative Swing Index indicator is attempting to add some more functionality to it by producing much smoother results.