Join our fan page

Cumulative_Volume - indicator for MetaTrader 5
- Views:
- 7619
- Rating:
- Published:
-
 You are missing trading opportunities:
- Free trading apps
- Over 8,000 signals for copying
- Economic news for exploring financial markets
Registration Log inYou agree to website policy and terms of use
If you do not have an account, please register -
 Need a robot or indicator based on this code? Order it on Freelance
Go to Freelance
Need a robot or indicator based on this code? Order it on Freelance
Go to Freelance
This oscillator indicator provides an interesting method for presenting volume data. It displays the total volume over the selected period.
Volume data can be represented in several ways:
- Combined
- Absolute
- Relative
- Separated
- Absolute
- Relative
Volumes can be displayed in relative or absolute values, as well as in a combined or a separated way.
The indicator has three input parameters:
- Period - calculation period;
- Combined - show data either in a combined or in a separated way (Yes/No);
- Relative - choose between relative/absolute values (Yes/No).
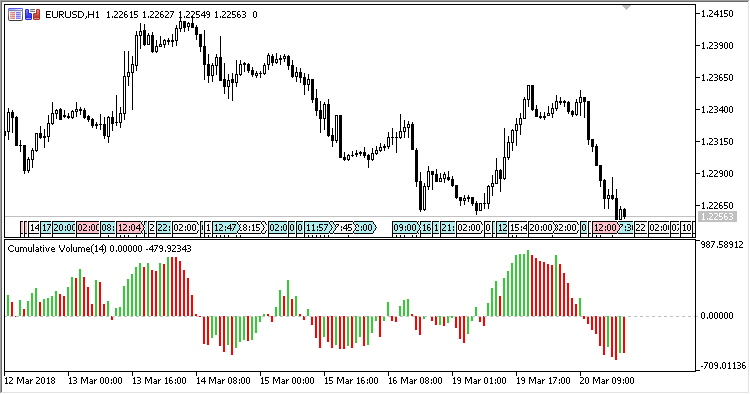
Fig.1. Combined, relative representation
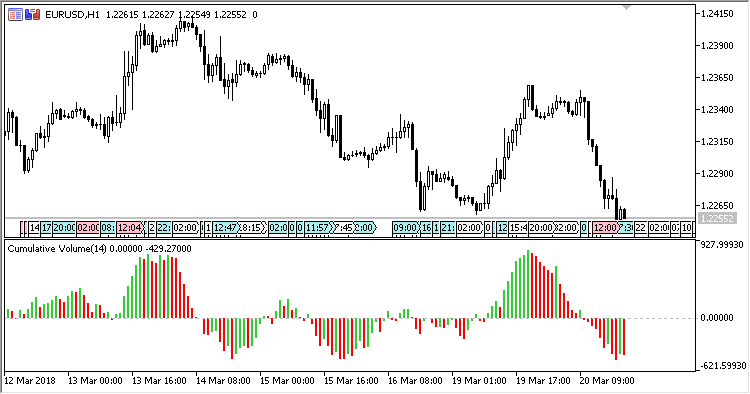
Fig.2. Combined, non-relative representation
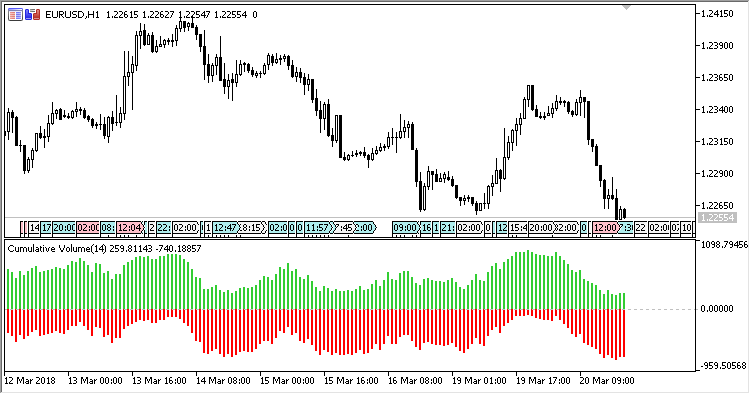
Fig.3. Non-combined, relative representation
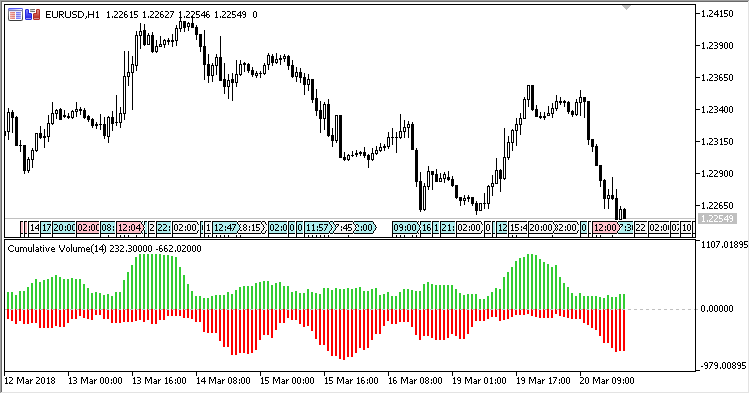
Fig.4. Non-combined, non-relative representation
Translated from Russian by MetaQuotes Ltd.
Original code: https://www.mql5.com/ru/code/20267
SHL_MA_Band
A trend indicator: Smoothed High/Low Linear regression band.
HL_MA_Band
A trend indicator: High/Low Linear regression band.
MA_Difference
An oscillator indicator showing a difference between MA and the price.
Period_Open_Line
The indicator shows the open price of a period.