Join our fan page

Conqueror - indicator for MetaTrader 5
- Views:
- 7643
- Rating:
- Published:
-
 You are missing trading opportunities:
- Free trading apps
- Over 8,000 signals for copying
- Economic news for exploring financial markets
Registration Log inYou agree to website policy and terms of use
If you do not have an account, please register -
 Need a robot or indicator based on this code? Order it on Freelance
Go to Freelance
Need a robot or indicator based on this code? Order it on Freelance
Go to Freelance
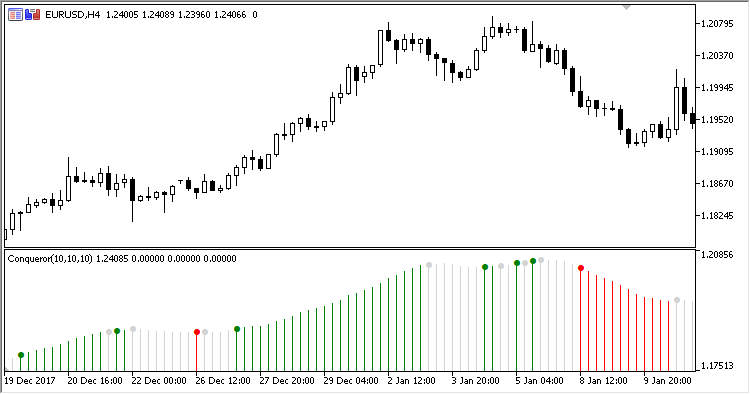
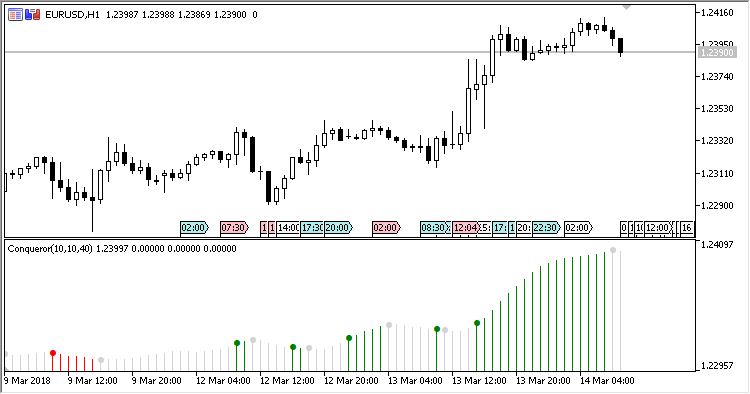
A signal histogram indicator. Draws a histogram with signal marks in a separate window. The histogram has three colors to determine buying, selling and the neutral state. Signal marks are drawn to indicate the change or completion of the current trend.
The indicator has three input parameters:
- Period - MA calculation period;
- First Range period - the first range (10 days by default);
- Second Range period - the second range (40 days by default).
Calculation of a Buy signal:
- Last Close > MAClose10 (10-day moving average of Close prices);
- Current MAClose10 > MAClose10 10 days ago;
- Last Close > Close 40 days ago.
A buy signal is formed when all the three conditions are met. Opposite conditions apply for selling.
Translated from Russian by MetaQuotes Ltd.
Original code: https://www.mql5.com/ru/code/20220
XBarClearCloseTrend
A trend signal indicator.
LR_Ratio
The indicator displays the ratio of two LSMAs.
OnChart_Stochastic
Stochastic on the price chart.
 Improve
An Expert Advisor based on two iMAs (Moving Average,MA) and one iRSI (Relative Strength Index, RSI). It tracks virtual profit. Works on two symbols.