Join our fan page

Nonlinear Kalman filter - indicator for MetaTrader 5

- Views:
- 8693
- Rating:
- Published:
-
 You are missing trading opportunities:
- Free trading apps
- Over 8,000 signals for copying
- Economic news for exploring financial markets
Registration Log inYou agree to website policy and terms of use
If you do not have an account, please register -
 Need a robot or indicator based on this code? Order it on Freelance
Go to Freelance
Need a robot or indicator based on this code? Order it on Freelance
Go to Freelance
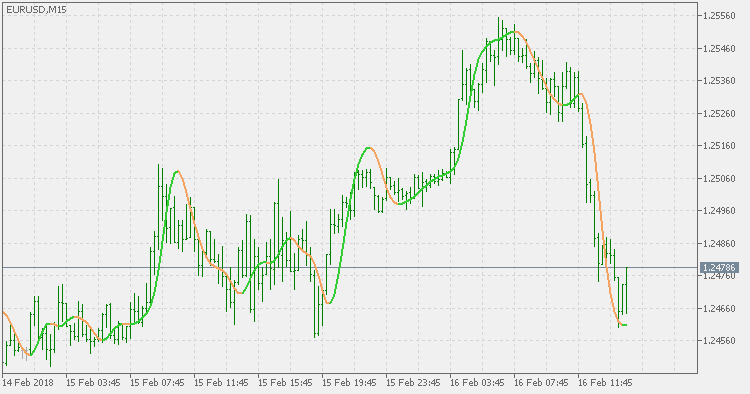
One more from the creations of John Ehlers.
Best described by Ehlers himself:
John Ehlers:
- Take EMA of price (better, a 3 Pole filter).
- Take the difference (delta) between Price and its EMA.
- Take an EMA of delta (or a 3 Pole filter):
- Smoothing will help reduce whipsaws.
- Ideally, smoothing introduces no major trend mode lag because delta is detrended.
- Add the smoothed delta to EMA for a zero lag curve.
- Add 2*(smoothed delta) to EMA for a smoother predictive line.
Kalman bands
This is a conversion of Kalman bands originally developed by Igor Durkin. Values are the same as MetaTrader 4 version except that we are using possibilities that MetaTrader 4 does not have to make the indicator easier to use.
DSL - TEMA MACD
Variation of a long known and useful MACD indicator using TEMA (Triple Exponential Moving Average) instead of using EMA (Exponential Moving Average) for MACD calculation, and DSL (Discontinued Signal Lines) and instead of using one signal line uses two.
DSL - WPR
The DSL version of Williams' Percent Range does not use fixed levels for oversold and overbought levels, but is having a sort of dynamic (discontinued signal lines) calculated to identify those levels. That makes it a bit more responsive to market changes and volatile markets.
DSL - stochastic
The DSL (Discontinued Signal Line) version of Stochastic does not use a moving average in a classical way for signals, but is instead calculating the signal lines depending on the value(s) of the stochastic. Thus, we are having two things : a signal line and a sort of levels that can be used for overbought and oversold estimation.