Join our fan page

TTM trend - indicator for MetaTrader 5

- Views:
- 13518
- Rating:
- Published:
-
 You are missing trading opportunities:
- Free trading apps
- Over 8,000 signals for copying
- Economic news for exploring financial markets
Registration Log inYou agree to website policy and terms of use
If you do not have an account, please register -
 Need a robot or indicator based on this code? Order it on Freelance
Go to Freelance
Need a robot or indicator based on this code? Order it on Freelance
Go to Freelance
There is already one TTM trend in the code base, but this one is doing the calculation in a different way.
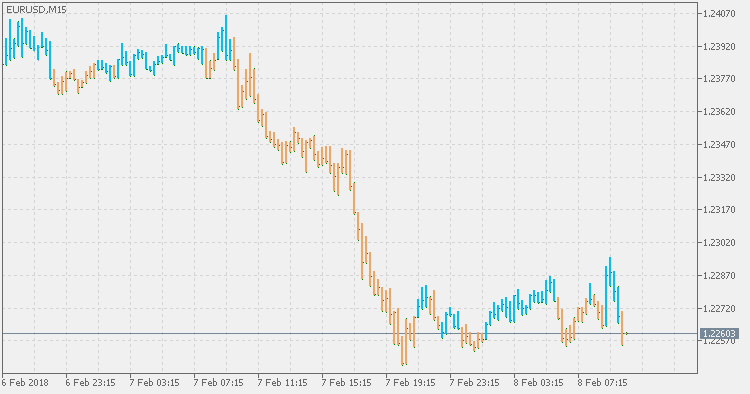
The TTM (Trade The Markets) Trend is basically an easier way to look at candlesticks. It is the The Heikin-Ashi method. Literally translated Heikin is "average" or "balance,", while Ashi means "foot" or "bar." The TTM trend is a visual technique that eliminates the irregularities from a normal candlestick chart and offers a better picture of trends and consolidations.
The TTM Trend can be modified to suit your trading personality or style. If look back bars closes above the 50% mark of the average for the past look back candlesticks, it changes color to bearish. If look back bars closes below the 50% mark of the average for the past look back candlesticks, the TTM Trend changes color to bullish. It is simple, but the TTM Trend is definitely an easier way to look at charts.
MACD TEMA
MACD TEMA is even a bit more "faster" than MACD DEMA so, depending on the parameters, in scalping mode (short calculating periods) or trending mode (when longer periods are used. Never forget that MACD is primarily a momentum indicator and that it is the main goal of MACD.
MACD DEMA
MACD that is using DEMA fo calculation.
Directional Efficiency Ratio
The Efficiency Ratio (ER) was first presented by Perry Kaufman in his 1995 book "Smarter Trading". It is calculated by dividing the price change over a period by the absolute sum of the price movements that occurred to achieve that change. The resulting ratio ranges between 0 and 1 with higher values representing a more efficient or trending market.
Stochastic Momentum Index
The Stochastic Momentum Index (SMI) was developed by William Blau and was introduced in the January 1993 issue of Technical Analysis of Stocks & Commodities magazine. It incorporates an interesting twist on the popular Stochastic Oscillator. While the Stochastic Oscillator provides you with a value showing the distance the current close is relative to the recent x-period high/low range, the SMI shows you where the close is relative to the midpoint of the recent x-period high/low range.