Join our fan page

Directional Efficiency Ratio - indicator for MetaTrader 5

- Views:
- 11448
- Rating:
- Published:
-
 You are missing trading opportunities:
- Free trading apps
- Over 8,000 signals for copying
- Economic news for exploring financial markets
Registration Log inYou agree to website policy and terms of use
If you do not have an account, please register -
 Need a robot or indicator based on this code? Order it on Freelance
Go to Freelance
Need a robot or indicator based on this code? Order it on Freelance
Go to Freelance
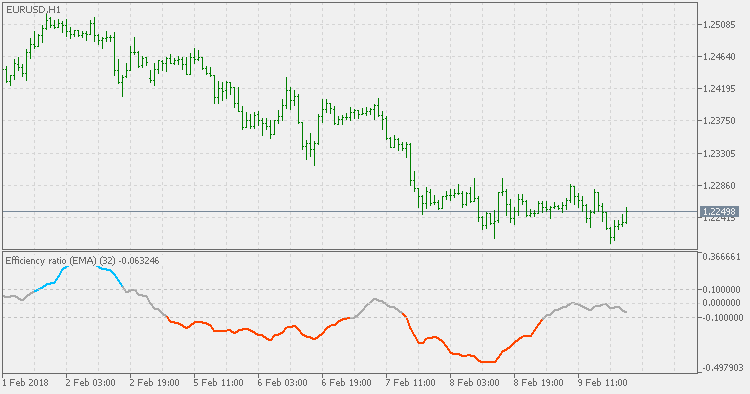
The Efficiency Ratio (ER) was first presented by Perry Kaufman in his 1995 book "Smarter Trading". It is calculated by dividing the price change over a period by the absolute sum of the price movements that occurred to achieve that change. The resulting ratio ranges between 0 and 1 with higher values representing a more efficient or trending market.
This version is different from the original. The original efficiency ratio is not showing the direction / trend of the price changes. This version is showing the direction and is adding a levels criteria to estimate if the market is trending or ranging. That way the indicator becomes a tool not only to show if the market is trending but to show the direction of the market as well. To help the estimation, smoothing option is added. With very mild smoothing, it is much easier to estimate the trend and a lot of false signals are avoided. To avoid smoothing, set the smoothing period to <= 1.
TTM trend
The TTM (Trade The Markets) Trend is basically an easier way to look at candlesticks. It is the The Heikin-Ashi method. Literally translated Heikin is "average" or "balance,", while Ashi means "foot" or "bar." The TTM trend is a visual technique that eliminates the irregularities from a normal candlestick chart and offers a better picture of trends and consolidations.
MACD TEMA
MACD TEMA is even a bit more "faster" than MACD DEMA so, depending on the parameters, in scalping mode (short calculating periods) or trending mode (when longer periods are used. Never forget that MACD is primarily a momentum indicator and that it is the main goal of MACD.
Stochastic Momentum Index
The Stochastic Momentum Index (SMI) was developed by William Blau and was introduced in the January 1993 issue of Technical Analysis of Stocks & Commodities magazine. It incorporates an interesting twist on the popular Stochastic Oscillator. While the Stochastic Oscillator provides you with a value showing the distance the current close is relative to the recent x-period high/low range, the SMI shows you where the close is relative to the midpoint of the recent x-period high/low range.
T3 Stochastic Momentum Index
This version is doing the calculation in the same way as the original Stochastic Momentum Index, except in one very important part: instead of using EMA (Exponential Moving Average) for calculation, it is using T3. That produces a smoother result without adding any lag.