Join our fan page
- Published by:
- Views:
- 11160
- Rating:
- Published:
- Updated:
-
 You are missing trading opportunities:
- Free trading apps
- Over 8,000 signals for copying
- Economic news for exploring financial markets
Registration Log inYou agree to website policy and terms of use
If you do not have an account, please register -
 Need a robot or indicator based on this code? Order it on Freelance
Go to Freelance
Need a robot or indicator based on this code? Order it on Freelance
Go to Freelance

Real author:
TrendLaboratory
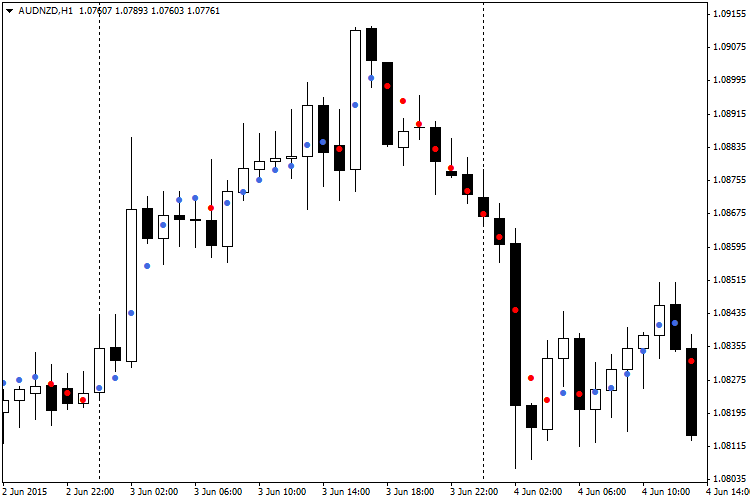
The Dots indicator is based on an indicator developed by TrendLaboratory in 2006. The indicator shows current trend direction by placing colored dots on the main chart. Blue dots indicate an uptrend, red dots indicate a downtrend.
Although the indicator calculation is not based on standard MetaTrader platform indicators, it uses the iMA (Moving Average) function to get prices of a specified type (Open, Close, Maximum, Minimum, Typical etc.). The calculation is based on cosine of a price change angle. The user can set several input parameters.
Input parameters:
- Length (by default = 10) — indicator period. The higher this value, the higher the time lag, and the fewer false signals are displayed.
- AppliedPrice (by default = PRICE_CLOSE) — price type to use in calculations.
- Filter (by default = 0) — useful parameter allowing to filter price surges without adding display lags.
- Deviation (by default = 0) — vertical indicator shift.
- Shift (by default = 0) — horizontal indicator shift.
Tips:
- Recommended strategy is to wait for 2 identical dots and open positions by trend. Unfortunately, sometimes it fails. A suitable alternative would be to use one dot as a signal with Filter parameter set as Spread x 3.
Translated from Russian by MetaQuotes Ltd.
Original code: https://www.mql5.com/ru/code/13180
 ColorZerolagRVI
This RVI oscillator analogue is calculated based on four Relative Vigor Index indicators.
WRB
The indicator determines and marks WRB (Wide Range Bars or Wide Range Bodies).
ColorZerolagStochs_HTF
The ColorZerolagStochs indicator with the timeframe selection option available in the input parameters.
GainLossInfo
Shows current gain and loss for all candlesticks on the chart.