Join our fan page
- Views:
- 5064
- Rating:
- Published:
- Updated:
-
Need a robot or indicator based on this code? Order it on Freelance Go to Freelance
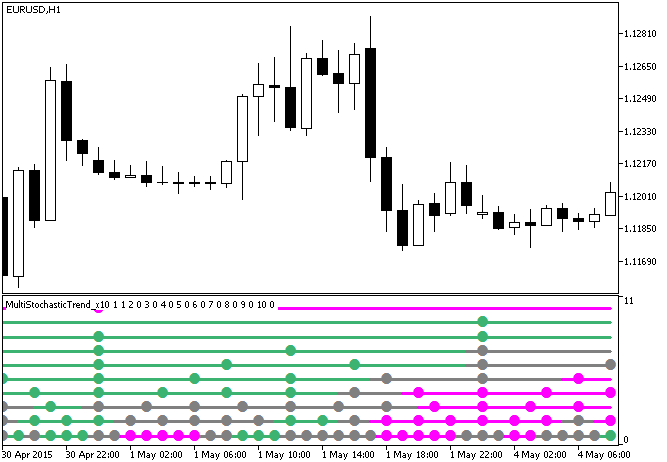
The MultiStochasticTrend_x10 indicator shows information on current trends using the Stochastic oscillator position from ten different timeframes.
Each of the ten indicator lines corresponds to a separate indicator. If the oscillator is positioned lower than the oversold level, the lines are painted in pink, if it's higher than the overbought level, the lines are painted in dark green. Otherwise, the lines are gray. Colored dots on lines appear when the bar of the corresponding timeframe changes.

Fig.1. The MultiStochasticTrend_x10 indicator
Translated from Russian by MetaQuotes Ltd.
Original code: https://www.mql5.com/ru/code/12995
 MultiMFITrend_x10
The MultiMFITrend_x10 indicator shows information on current trends using the MFI oscillator position from ten different timeframes.
 MFITrend_x10
The MFITrend_x10 indicator shows the MFI oscillator position from ten different timeframes.
 BinaryWave_HTF_Signal
The BinaryWave_HTF_Signal indicator shows a trend direction or a signal based on the BinaryWaveSign indicator.
 BlauTVI_HTF
The BlauTVI indicator with the timeframe selection option available in the input parameters.