Join our fan page
- Views:
- 4655
- Rating:
- Published:
- Updated:
-
Need a robot or indicator based on this code? Order it on Freelance Go to Freelance
Real author:
Gregory A. Kakhiani
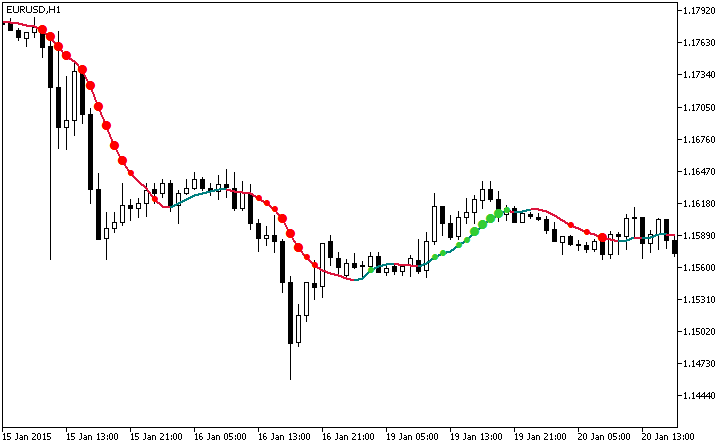
The Gaus_MA indicator with additional trend strength indication using colored dots based on the standard deviation algorithm.
If the standard deviation of the Gaus_MA indicator is between the dK1 and dK2 parameter values, then a small colored dot appears on the moving average. Its color corresponds to the current trend direction.
input double dK1=1.5;  // Square-law filter coefficient 1
input double dK2=2.5;  // Square-law filter coefficient 2
If the standard deviation becomes higher than the dK2 input parameter value, then the dot size increases. Thus, we get 3 levels of trend strength indication:
- Weak — no dots;
- Medium — small colored dots;
- Strong — big colored dots.

Fig.1. The Gaus_MA_StDev indicator
Translated from Russian by MetaQuotes Ltd.
Original code: https://www.mql5.com/ru/code/12935
 BBflat_sw_HTF
The BBflat_sw indicator with the timeframe selection option available in the input parameters.
 Bezier_HTF
The Bezier indicator with the timeframe selection option available in the input parameters.
 ATRratio_HTF
The ATRratio indicator with the timeframe selection option available in the input parameters.
 ATR_MA_Oscillator_HTF
The ATR_MA_Oscillator indicator with the timeframe selection option available in the input parameters.