JET TPO Profile PRO is a paid indicator for MetaTrader 5 that draws a time-price profile (TPO) for each session on the price chart. Each period of the session gets a letter on every price it reached, so you see at which prices the market spent the most time, where the value of the session was, how the initial balance developed and where the auction was left incomplete. It adds a panel, alerts and data for Experts. It is an indicator only: it never opens, closes or changes orders.
The profile
- One profile per session, starting at the session open, over the candles of that session. The number of sessions drawn is set by Days drawn (10 by default).
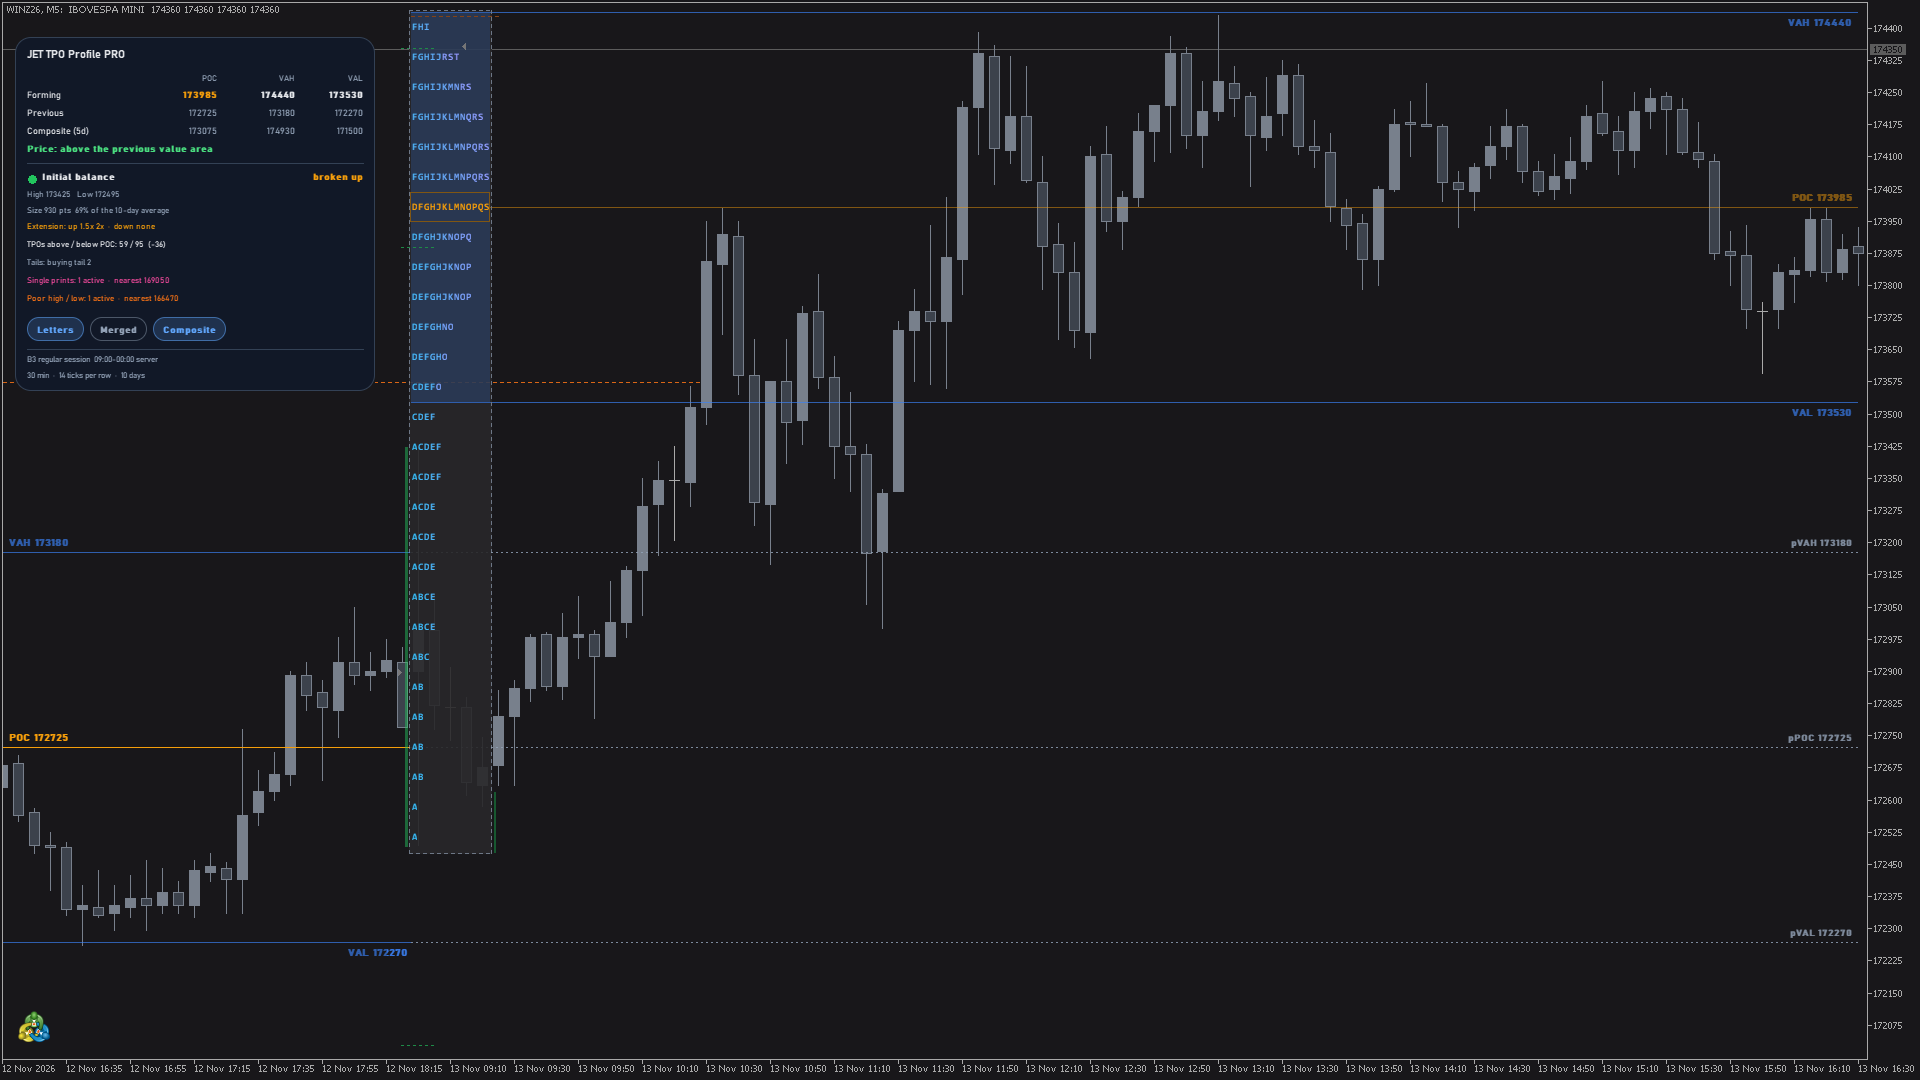
- TPO letters: each period of the session (30 minutes by default) gets a letter: A, B, C ... Z, then a, b, c ... The letter appears on every price row that the period reached. Each period has its own color, in a gradient from the first period color to the last period color.
- Drawing modes (input Drawing mode and the first panel button): Letters; Blocks (a colored square per period, without the letter); Histogram (the outline of the profile in one color, with the POC row in the POC color). In Letters mode, when the zoom is too small for the letters, the profile is drawn as blocks and, if still too small, as a histogram; zoom in to see the letters again.
- Merged or split (input Merged / split and the second panel button): Merged puts the letters of each row side by side from the start of the session, forming the profile; Split puts each period in its own column, at the time it happened. The button cycles through Merged, Split: current (only the session in progress) and Split: all.
- POC: the row with the most TPOs, outlined in the POC color, with a line to the end of the session and the label "POC" with its price.
- Value area (70% of the TPOs by default): a shaded band with the VAH and VAL lines and their prices at the end of the session.
- Profile in progress: dashed border and the label "forming". Its POC and value area move as new periods come in; its single prints and poor highs/lows are drawn lighter, as provisional, until the session ends. A closed profile never changes.

Initial balance and marks
- Initial balance (IB): a vertical bar in the IB color just left of the profile, from the low to the high of the first 2 periods (the first hour with 30-minute periods). Short dashed lines mark the 1.5x and 2x extensions of the IB above and below.
- Open and close: a gray triangle left of the profile at the opening price of the session, and another one right of the profile at the closing price.
- Tails: a thin vertical mark right of the profile, red for the selling tail at the high and green for the buying tail at the low, when the extreme has at least 2 rows with a single TPO (input Tails from).
- Single prints: rows with a single TPO inside the profile (at least 2 in a row by default), shaded in the single prints color.
- Poor high and poor low: the extreme row of the session with 2 or more TPOs (an incomplete auction), marked with a dashed line in the poor high / low color.
Previous session, untouched levels and composite
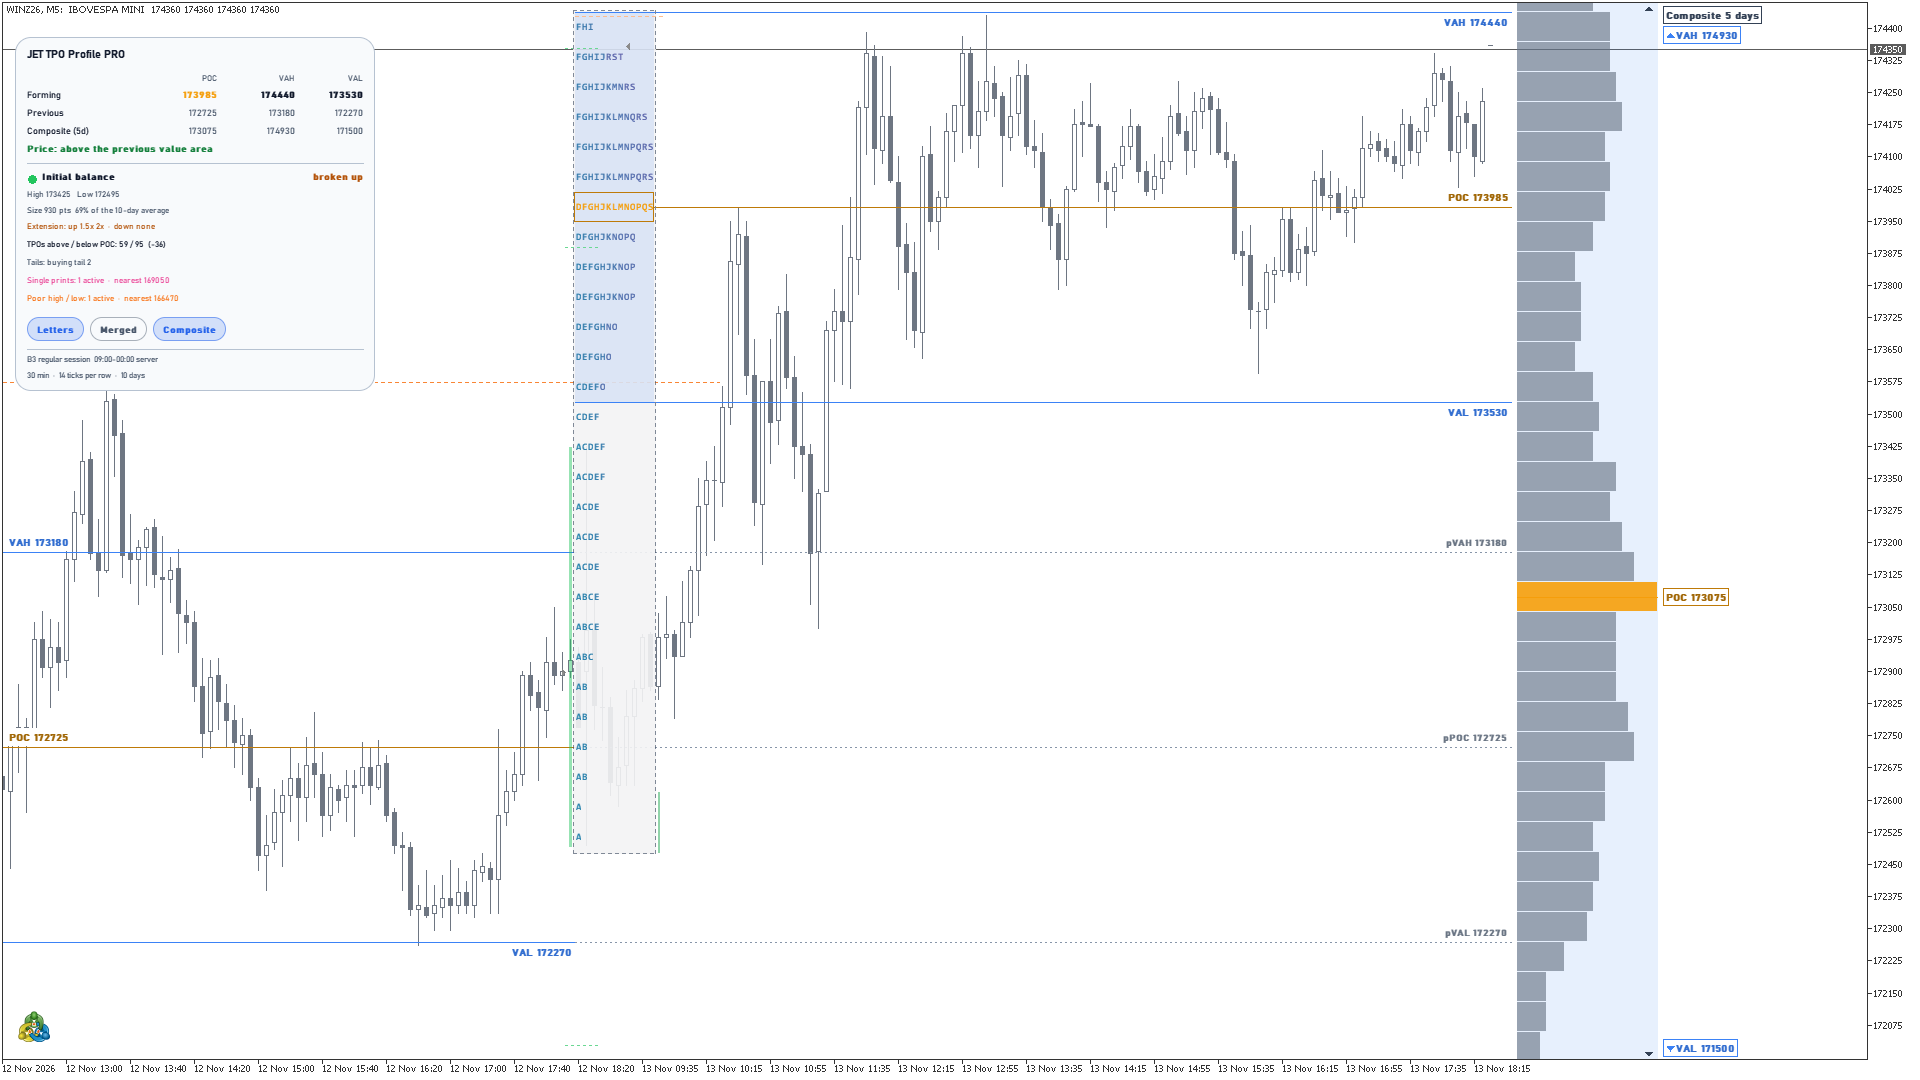
- Previous session levels: POC, VAH and VAL of the last closed session, as dashed gray lines over the session in progress, labeled pPOC, pVAH and pVAL with their prices.
- Virgin POCs: the POC of a past session that price has not touched again is extended to the right edge of the chart with the label "virgin POC" and its price. When price touches it, the line ends at the touch.
- Single prints and poor highs/lows of past sessions are also extended to the right until price returns to them; an untouched poor high or poor low shows its label and price. The last 10 sessions are checked (input Days checked for untouched levels).
- Composite profile: one histogram joining the last 5 closed sessions, drawn to the right of the current price, with its own POC and value area. The POC, VAH and VAL lines of the composite show their prices beside them, in the price format of the symbol. A title above the composite shows how many days it uses, e.g. "Composite 5 days"; when fewer closed sessions are available than Composite: days asks for, it shows the real number (e.g. "Composite 3 days"). The third panel button shows or hides it.
- Volume POC (off by default): the volume POC of each session as a thin line labeled "volume POC", to compare where the market spent its time with where it traded the most volume. It uses the real volume where the broker provides it and the tick volume otherwise.

Sessions
With Session = Automatic by symbol (default), the indicator chooses the session from the symbol, and the panel footer shows which one is in use:
- B3 regular session for B3 futures such as WIN, WDO, IND and DOL (the trading day of the broker).
- Regular hours, 09:30 to 16:00 New York, for US indices (e.g. US500, US30, NAS100) and for the ES, NQ, YM and RTY futures and their micro contracts on CME.
- Day (New York close), 17:00 to 17:00 New York, for forex, metals and crypto.
- Server day, 00:00 to 24:00 on the broker's clock, for the other symbols.
Other options of the Session input: Server day; Custom hours (start and end in HH:MM, in the clock of New York, Chicago, London, Frankfurt, Tokyo, Sao Paulo or the server); Asia / London / New York sessions (one profile per session: Tokyo 09:00-18:00, London 08:00-17:00 and New York 08:00-17:00, each in local time). Exchange clocks follow daylight saving time, so the profiles do not shift twice a year.

How to add it to the chart
- Open the Navigator (Ctrl+N) and find JET TPO Profile PRO under Indicators > Market.
- Drag it to the price chart (or double-click it), adjust the Inputs tab if you wish and click OK.
- It works on any symbol. Letters, blocks and the split view are drawn from M1 to H1; on higher timeframes the profile is drawn as a histogram and the panel shows "Above H1 the profile is drawn as a histogram".
- The profiles use the 1-minute history of the symbol. While it is not loaded, the panel shows "1-minute history missing: loading..." and the profiles appear as soon as it arrives.
- To remove it, open the indicator list (Ctrl+I), select it and click Delete.
The panel
- POC, VAH and VAL in three rows: Forming (the session in progress; "Outside the session" between sessions), Previous (the last closed session) and Composite, with the number of days of the composite profile.
- Price: above, inside or below the previous value area (green, blue or red).
- Initial balance: status (forming, not broken, broken up, broken down), High and Low, Size in points and in % of the average of the last 10 sessions, and Extension: up / down with 1.5x and 2x when reached.
- TPOs above / below POC: the two counts and the difference, e.g. "52 / 40 (+12)".
- Tails: buying tail and selling tail of the session in progress, with their number of rows.
- Single prints and Poor high / low: how many are still active (not revisited) in past sessions and the nearest price.
- Buttons: drawing mode (Letters, Blocks, Histogram), Merged / Split: current / Split: all, and Composite. A click changes only the drawing; the inputs set the state when the indicator starts.
- Footer: session name and hours (exchange clock and server), TPO period, ticks per row and number of days drawn.
- Drag the panel to put it anywhere on the chart. Before the first session it shows "Waiting for the first session".
Inputs
Profile
- TPO period = 30 minutes. Options: 5, 10, 15, 30 and 60 minutes. The periods start at the session open, not on the round hour. Shorter periods give more letters per session.
- Row height in ticks (0 = automatic) = 0. With 0, the indicator picks a row height suited to the symbol, shown in the panel footer ("12 ticks per row", for example). Type a value to fix it; taller rows make shorter, wider profiles.
- Value area (%) = 70.
- Value area method = 2 rows at a time (classic TPO). Other option: 1 row at a time (as the volume profiles).
- Days drawn (1-60) = 10.
- Letters = Restart every session. With Continuous (by time of day), each period keeps the letter of its time of day, so the same letter means the same clock time every day.
Session
- Session = Automatic by symbol. Other options: Server day, Custom hours, Asia / London / New York sessions (see Sessions).
- Custom hours: start (HH:MM) = 09:30, Custom hours: end (HH:MM) = 16:00 and Custom hours: clock = New York (also Server, Chicago, London, Frankfurt, Tokyo, Sao Paulo). Used with Custom hours. An end earlier than the start crosses midnight. If the hours cannot be read, the server day is used.
- Separate overnight profile (ETH) = false. When true, the hours between two sessions get their own profile, shown as Overnight in the footer. It works with Regular hours and with Custom hours.
- Server time zone = Auto (live) / GMT+2/+3 in tester. Other options: GMT+2 / GMT+3 (New York close brokers) and Fixed GMT offset, with Server GMT offset (fixed mode) = 2. It places the sessions set in an exchange clock; if the hours in the panel footer do not match your broker, choose the option that fits it.
- Initial balance: periods = 2.
- Initial balance: own start (HH:MM, empty = session start) = empty and Initial balance: clock of the own start = New York. Example: 09:30 New York puts the IB at the New York open on a 24-hour forex profile.
- Initial balance: extensions 1.5x and 2x = true. Shows the extension lines and the Extension line of the panel, and allows the extension alert.
Highlights
- Single prints from (rows in a row) = 2.
- Tails from (rows) = 2.
- Poor high / low from (TPOs on the extreme row) = 2.
- Extend virgin POCs, Extend single prints and Extend poor highs / lows = true. When off, single prints and poor highs/lows stay inside their profile and virgin POCs are not extended.
- Days checked for untouched levels = 10. Also sets the sessions counted in the panel (active single prints, poor highs/lows) and in the level alerts.
Composite
- Composite profile = true (state of the Composite button at the start).
- Composite: days = 5.
- Composite: value area (%) = 70.
Volume
- Volume POC of each session = false.
Drawing
- Drawing mode = Letters (also Blocks, Histogram).
- Merged / split = Merged. Split starts with all sessions split.
- Letter size = 9.
- Maximum profile width (% of the session) = 80. Limits how far a merged profile goes into the time span of its session.
- Colors: First period color = light blue; Last period color = violet; POC = amber; Value area = blue; Initial balance = green; Single prints = pink; Poor high / low = orange; Previous session levels = gray; Composite = slate gray (also the color of the histogram mode); Volume POC = teal.
Panel
- Show the panel = true.
- Theme = Automatic (chart background). Other options: Dark, Light. It also adapts the colors of the profiles.
- Panel size (%) = 100 (50 to 300), useful on high-resolution screens.
- Language = Terminal language, or one of the 11 languages.
- Panel position X = 12 and Panel position Y = 34.
Alerts
Alerts fire only in real time, never for the history, and each one fires once per level per session. Group Alerts:
- Price leaves the previous value area = Off. Message, e.g.: "Price left the previous value area upward (VAH 1.08450)". With Also the forming value area = true, the same alert also covers the value area of the session in progress. Trigger: Value area: trigger.
- Price touches the previous POC or a virgin POC = Off. Message, e.g.: "Price touched a virgin POC 1.08310". Trigger: POC: trigger.
- Initial balance broken (first break) = Popup + Sound. After the IB is complete, it fires on the first break up and on the first break down. Message, e.g.: "Initial balance broken upward (5432.25)". Trigger: Initial balance: trigger.
- IB extension 1.5x / 2x reached = Off (needs Initial balance: extensions 1.5x and 2x on). Message, e.g.: "IB extension 2 x reached downward (5390.00)". Trigger: Extension: trigger.
- Price returns to single prints = Off. Message, e.g.: "Price returned to single prints 1.08200 - 1.08250". Trigger: Single prints: trigger.
- Price returns to a poor high / low = Off. Message, e.g.: "Price returned to a poor high 1.08600". Trigger: Poor high / low: trigger.
- Each trigger = On touch (as soon as the price reaches the level). Other option: On bar close (checked when the bar closes).
- Modes: Off, Popup, Sound, Smartphone notification, Popup + Sound, Notification + Sound, Popup + Notification, Popup + Sound + Notification.
- Sound = alert (a sound of the terminal). Also send e-mail = false; when true, each alert that is on also sends an e-mail. An alert set to Off sends nothing.
- Push notifications and e-mail must be set up in Tools > Options (Notifications and Email tabs). Alert messages use the panel language.
Data for Experts (iCustom)
The indicator has 15 buffers with one value per bar, readable with iCustom and CopyBuffer. They are not drawn on the chart; the Data Window (Ctrl+D) shows them with the labels below.
| Buffer | Label | Content |
|---|---|---|
| 0 | TPO POC (forming session) | POC of the session in progress at the close of the bar |
| 1 | TPO VAH (forming session) | VAH of the session in progress |
| 2 | TPO VAL (forming session) | VAL of the session in progress |
| 3 | IB high | High of the initial balance (empty until the IB is complete) |
| 4 | IB low | Low of the initial balance (empty until the IB is complete) |
| 5 | Previous POC | POC of the previous session |
| 6 | Previous VAH | VAH of the previous session |
| 7 | Previous VAL | VAL of the previous session |
| 8 | Composite POC | POC of the composite profile (last N sessions) |
| 9 | Composite VAH | VAH of the composite profile |
| 10 | Composite VAL | VAL of the composite profile |
| 11 | TPOs above POC - below POC | TPOs above the POC minus TPOs below it, session in progress |
| 12 | Price vs previous value area (+1 above, 0 inside, -1 below) | Close of the bar against the previous value area: +1 above, 0 inside, -1 below |
| 13 | Marks (1 IB up, 2 IB down, 4 ext 1.5x, 8 ext 2x, 16 poor high, 32 poor low, 64 single prints, 128 provisional) | Sum of bits: 1 IB broken up, 2 IB broken down, 4 extension 1.5x reached, 8 extension 2x reached, 16 poor high, 32 poor low, 64 single prints in the session, 128 session still open, so 16, 32 and 64 are still provisional. Example: 133 = 1 + 4 + 128. |
| 14 | TPO period (1 = A) | Number of the TPO period of the bar in the session: 1 = A, 2 = B and so on |
- No repainting: each value is the one at the close of its bar, and the buffers of closed bars (index 1 or higher) never change. On the bar in progress (index 0), buffers 0-4 and 11-14 change while the bar is open; buffers 5-10 change only when a new session starts.
- Provisional marks (bit 128): while the session is open, a poor high, a poor low or single prints can still disappear, so bits 16, 32 and 64 come with 128. On the last bar of a session, 128 is off and those bits are final.
- Empty values are EMPTY_VALUE: outside a session (buffers 0-4, 11, 13 and 14), before the IB is complete (3 and 4), before the first closed session (5-7 and 12) and before the composite exists (8-10). Buffers 8-10 are filled even when the composite is hidden with the panel button.
- The buffers follow the inputs of the indicator (value area, method, composite days and so on); iCustom without inputs uses the defaults.
- Example: handle = iCustom(_Symbol, PERIOD_CURRENT, "Market\\JET TPO Profile PRO"); then read buffer 13 of bar 1 with CopyBuffer and test (value & 1) to know whether the IB had been broken upward at the close of the last closed bar.
Tips and frequent questions
- Only blocks or a histogram, no letters? The rows are too small for the letters: zoom in, or type a larger Row height in ticks.
- Profile too tall or too flat? Change Row height in ticks; the value in use is in the panel footer.
- Session hours do not match your broker? Check the footer, then change Server time zone, or use Custom hours.
- Forex with the IB at the New York open: keep the automatic session and set Initial balance: own start = 09:30 with the New York clock.
- Time and volume together: turn on Volume POC of each session and compare its line with the TPO POC.
- "1-minute history missing: loading...": wait a few seconds; if it stays, open an M1 chart of the symbol once so that the terminal downloads the history.
- Strategy Tester: the profiles and the panel are drawn in visual mode; the buffers work in both modes. Tested on EURUSD and WIN, with no repainting.
- Reading the profile: the POC, the value area, the initial balance and its extensions, single prints, tails and poor highs/lows describe how the session traded. They do not forecast the next move.
Download
- JET TPO Profile PRO: time-price profiles by session on the price chart, panel, alerts and data for Experts.
Questions and suggestions: send me a private message through my MQL5 profile.
Trading involves risk of loss. The indicator shows market information; it does not forecast prices or guarantee results.