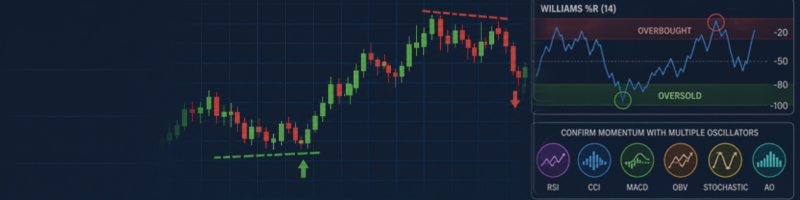
Williams %R Indicator Strategy: How to Trade Overbought, Oversold, and Divergence Signals

Introduction: Understanding the Williams %R Indicator
Finding the right entry point is one of the biggest challenges in Forex trading. Price may reach a new high or low, but determining whether momentum is strengthening or weakening requires proper technical analysis.
The Williams %R indicator is a popular momentum oscillator that helps traders identify overbought and oversold conditions, recognize potential reversals, and analyze market momentum.
However, experienced traders know that an overbought or oversold reading is not an automatic buy or sell signal. The best results come from combining Williams %R with price action, trend analysis, and divergence confirmation.
In this guide, we will explain how Williams %R works, its best settings, practical Forex trading strategies, and how to improve its signals using other technical indicators.
What Is the Williams %R Indicator?
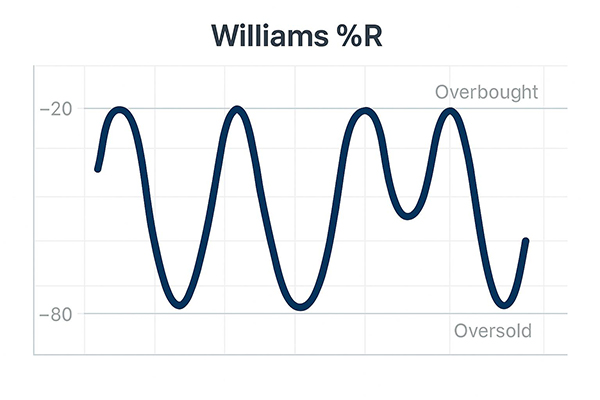
Williams %R, also known as Williams Percent Range, is a momentum oscillator developed by Larry Williams. It measures the position of the current closing price relative to the highest high and lowest low over a selected period.
The indicator moves between 0 and -100. Its standard setting is 14 periods, although traders can adjust this value according to their trading style and timeframe.
Understanding Overbought and Oversold Levels
Williams %R uses two important trading zones:
-
Overbought (0 to -20): Price is trading near the upper boundary of its recent range.
-
Oversold (-80 to -100): Price is trading near the lower boundary of its recent range.
These levels help traders identify extreme price conditions. However, they do not guarantee an immediate reversal.
For example, during a strong bullish trend, Williams %R may remain overbought for an extended period. This can indicate strong buying pressure rather than an immediate selling opportunity.
How to Read Williams %R Trading Signals
Understanding how the oscillator behaves is more important than simply watching its extreme levels.
1. Overbought and Oversold Signals
A common strategy involves waiting for Williams %R to leave an extreme zone before considering an entry.
-
Potential buy signal: Williams %R enters the oversold zone and crosses back above -80.
-
Potential sell signal: Williams %R enters the overbought zone and crosses back below -20.
Traders should confirm these signals using candlestick patterns, support and resistance, and market structure.
2. Williams %R Divergence
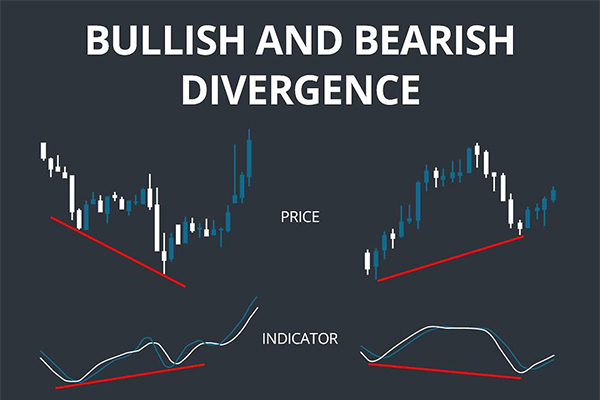
One of the most useful applications of Williams %R is identifying bullish and bearish divergences.
Bullish Divergence: Price creates a lower low while Williams %R forms a higher low. This may indicate weakening selling momentum and a potential bullish reversal.
Bearish Divergence: Price creates a higher high while Williams %R forms a lower high. This may suggest weakening buying pressure and a possible bearish reversal.
Divergence is particularly useful when it develops near important support or resistance levels. However, traders should wait for additional confirmation before entering a position.
3. Failure Swing
A failure swing occurs when Williams %R attempts to return to an extreme level but fails to reach its previous reading before reversing.
A bullish failure swing may indicate improving buying momentum, while a bearish failure swing may suggest weakening bullish pressure.
These formations can provide additional information about potential changes in market direction.
Best Williams %R Trading Strategies for Forex
Williams %R can be used in different market conditions. The key is adapting your approach to the current market structure.
1. Williams %R Strategy for Range-Bound Markets
In sideways markets, price often moves between established support and resistance zones.
A potential buy setup includes:
-
Price approaches a support area.
-
Williams %R enters the oversold zone.
-
The oscillator crosses back above -80.
-
A bullish candlestick confirms the setup.
For sell opportunities, traders can apply the opposite conditions near resistance.
Stop-loss placement should consider the recent swing high or low, while profit targets can be based on the opposite side of the trading range.
2. Williams %R Strategy for Trending Markets
Trading against a strong trend simply because an oscillator reaches an extreme level is a common mistake.
In an uptrend, traders can wait for a price pullback while Williams %R approaches the oversold zone. A recovery above -80 combined with bullish price action may indicate a potential trend continuation.
In a downtrend, traders can look for corrective rallies that push Williams %R toward the overbought zone. A move back below -20 may provide a potential bearish continuation signal.
Using a trend filter, such as Moving Average or Parabolic SAR, can help traders avoid unnecessary countertrend positions.
3. Multi-Timeframe Analysis
Multi-timeframe analysis can improve trading decisions by providing a broader view of market direction.
For example, a trader may use the H4 chart to identify the dominant trend and the H1 or M15 chart to find potential entry opportunities.
Higher timeframes provide market context, while lower timeframes help refine entry timing.
Williams %R vs RSI: Which Indicator Is Better?
Williams %R and Relative Strength Index (RSI) are both momentum oscillators, but they measure market conditions differently.
| Feature | Williams %R | RSI |
|---|---|---|
| Scale | 0 to -100 | 0 to 100 |
| Standard period | 14 | 14 |
| Overbought | -20 | 70 |
| Oversold | -80 | 30 |
| Main purpose | Price position within a range | Momentum strength |
Williams %R measures the closing price relative to its recent trading range, while RSI evaluates the balance between average gains and losses.
Neither indicator is universally better. Traders can combine them to evaluate momentum, provided they avoid treating similar signals as independent confirmations.
How to Improve Williams %R Signals With Divergence Confirmation
Although Williams %R can identify potential momentum reversals, relying on a single oscillator may result in false signals.
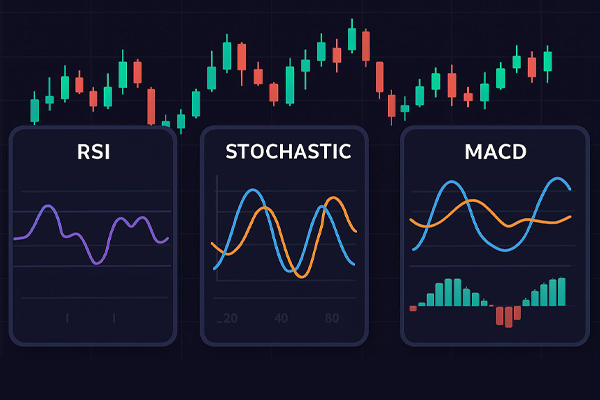
A more comprehensive approach is to analyze divergence using multiple oscillators, including RSI, CCI, MACD, OBV, Stochastic, and Awesome Oscillator.
When several oscillators identify bullish or bearish divergence around the same price area, traders can evaluate whether stronger momentum confluence is developing.
Combining bullish and bearish divergences with price action, support and resistance, and trend direction can create a more structured trading strategy.
Remember that multiple signals do not guarantee a profitable reversal. Market context and risk management remain essential.
Common Mistakes When Trading Williams %R
Avoid these common mistakes when using the indicator:
-
Selling immediately when Williams %R enters the overbought zone.
-
Buying immediately when it reaches oversold conditions.
-
Trading every divergence without confirmation.
-
Using too many indicators with overlapping functions.
-
Ignoring stop-loss placement and position sizing.
A disciplined trader always evaluates the complete trading setup rather than relying on one indicator reading.
Conclusion: Is Williams %R a Good Forex Indicator?
Williams %R is a useful momentum oscillator for identifying overbought and oversold conditions, analyzing momentum shifts, and spotting potential bullish and bearish divergences.
Its effectiveness depends on how traders interpret its signals. Combining it with trend analysis, price action, and proper risk management can provide a more structured approach to Forex trading.
For traders who want to go beyond single-oscillator analysis, comparing divergence signals across multiple technical indicators can provide additional market insight.
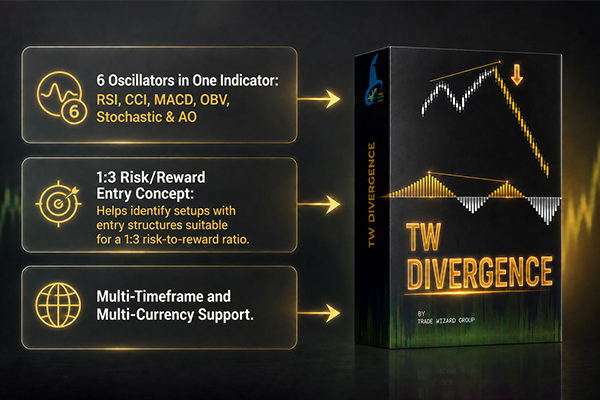
Recommended Tool: TW Multi Divergence MT4
TW Multi Divergence MT4 is a custom indicator designed for traders who want to analyze divergence across multiple oscillators in one tool.
It evaluates six popular indicators: RSI, CCI, MACD, OBV, Stochastic, and Awesome Oscillator (AO). Its features include bullish and bearish divergence detection, visual signals, and multi-timeframe and multi-currency analysis.
TW Multi Divergence can complement Williams %R analysis by providing additional momentum information and helping traders evaluate potential reversal opportunities.
As with any trading indicator, signals should be tested under different market conditions and combined with appropriate risk management. No indicator guarantees profitable trades.




