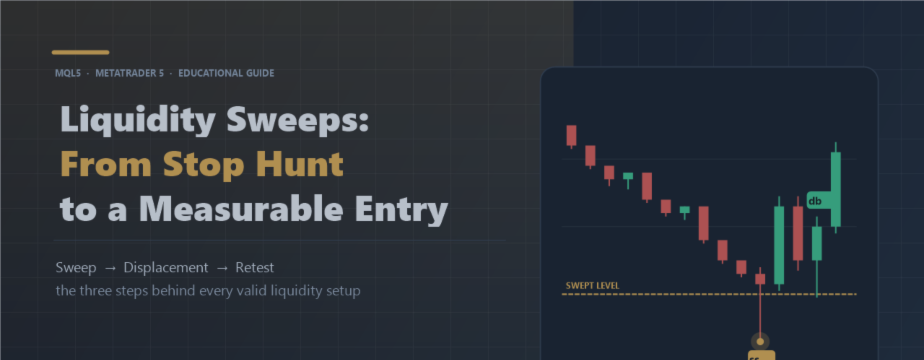
From Liquidity Sweep to Reversal: A Practical Guide to Reading Liquidity Setups

How to tell a real breakout from a liquidity grab, and how to build a three-step setup — sweep, displacement, retest — on MetaTrader 5.
Article type: educational, applied.
Tool used in the examples: Liquidity Sweep Radar with News Diary — a chart indicator that draws on the chart only. It never opens, modifies or closes orders.
Introduction: the price does not cross the level, it collects what is under it
Most traders go through the same scenario: identify an obvious level — a previous swing high or a previous low — enter when price reaches it, get stopped out by a quick reversal, then watch price continue in the direction they originally expected.
The analysis was not wrong. The mistake was in reading intent. A breakout means the market accepted the new price and built value around it. A liquidity sweep means the market visited the cluster of resting orders, filled them, then rejected the new price and returned. The same level can be the stage for both, and the difference is not the level — it is how price leaves it.
Who this article is for
- Traders who already mark swing highs and lows and want a measurable rule instead of a visual guess.
- MQL5 developers who need clean, closed-bar signal buffers to build an Expert Advisor on top.
- Anyone who keeps getting stopped out at levels that "should" have held.
What this article is not
- It is not a promise of profit, and it is not financial advice.
- It is not a black-box strategy: every rule below is expressed in numbers you can measure, change and test.
- It is not specific to one symbol or one timeframe.
1. What do we actually mean by "liquidity"?
Liquidity is the density of executable orders at a given price. In FX and CFD markets you do not see a central order book, but you do see expected clusters:
| Where the cluster sits | Order type | Expected effect |
|---|---|---|
| Above a clean swing high | Buy stops + closing sells | Short-lived bullish fuel |
| Below a clean swing low | Sell stops + closing buys | Short-lived bearish fuel |
| Around round numbers | Stops and limit orders | Fast attraction zones |
| Outside the Asian range | Tight stop orders | Classic sweep target |
One practical principle: wherever you place your stop loss, there is easily executable price. That is why price often moves into that area first, and only then chooses a direction. Keep in mind that this is a probabilistic read, not certainty — a sweep can fail, and it can simply be a pullback inside a strong trend.
2. Breakout versus sweep: five measurable differences
| Dimension | Real breakout | Liquidity sweep |
|---|---|---|
| Close | Closes outside and away from the level | Closes back on the original side |
| Candle shape | Strong body, balanced range | Long wick, small body |
| Continuation | Builds new value and holds the close | Fails to close outside and returns |
| Momentum after the move | Builds progressively | Fades once liquidity is taken |
| Context | Usually with a clear trend | Usually at range edges or before a turn |
Turning the idea into a rule: (1) a valid level — a swing high or low confirmed by N bars to the right; (2) limited penetration by a defined tolerance in points; (3) a close back on the original side of the level.
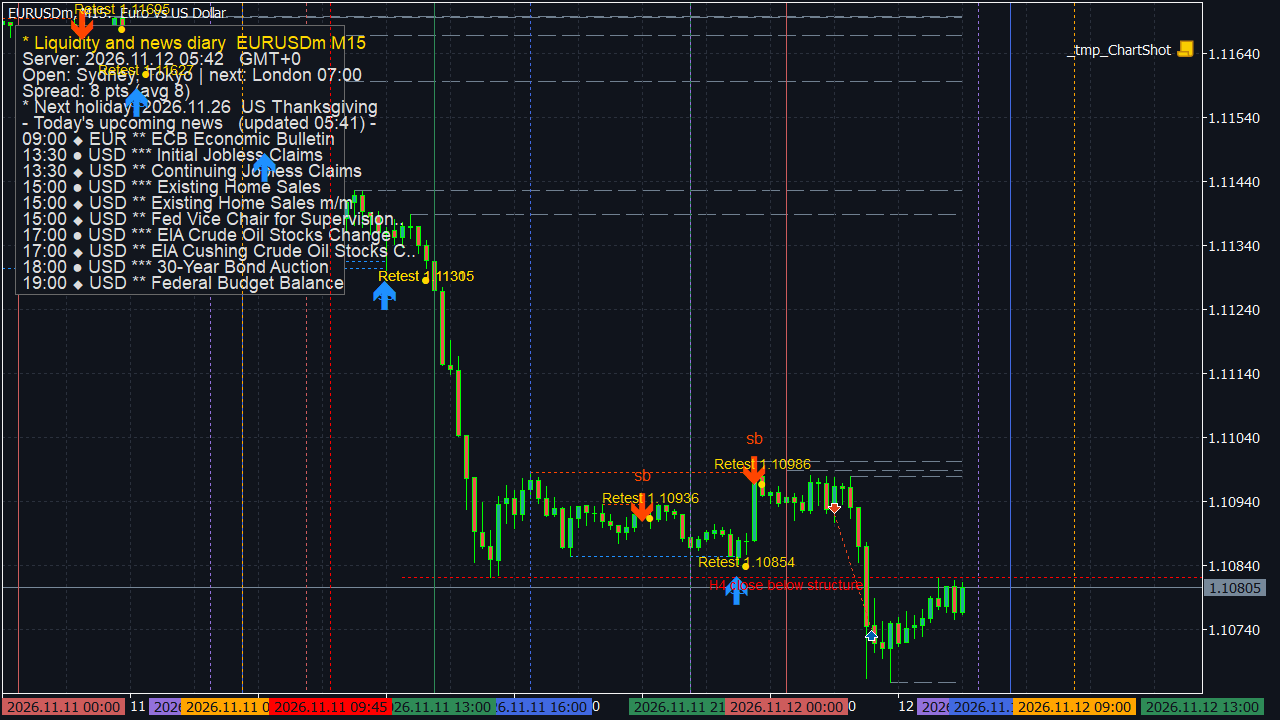
3. The three-part setup: sweep → displacement → retest
A liquidity sweep on its own is not an entry signal. It is a precondition. The setup completes with two more steps.
Step 2 — Displacement
- a candle whose body closes fully beyond the extreme of the sweep bar;
- a body larger than the average body of the recent candles (a configurable ratio);
- a minimum body size in points, so small candles are not counted.
Step 3 — Retest
- price returns to the swept level, not to the middle of the move;
- it happens within a defined number of bars after the sweep;
- with a defined tolerance in points around the level.
The advantage of this structure is a better risk to reward ratio without increasing position size: the entry sits closer to the invalidation level.
| Setup element | What it measures | Matching indicator input |
|---|---|---|
| Sweep | Penetration then close back | InpShowSweeps , InpSwingLeft , InpSwingRight , InpBreakTolPts |
| Displacement | Body strength versus average + minimum size | InpInjectBodyAvgBars , InpInjectBodyRatio , InpInjectMinBodyPts , InpInjectMaxBars |
| Retest | Return to the level inside a time window | InpInjectRetestBars , InpInjectRetestTolPts |
| Execution filter | Acceptable spread at signal time | InpInjectMaxSpreadPts |
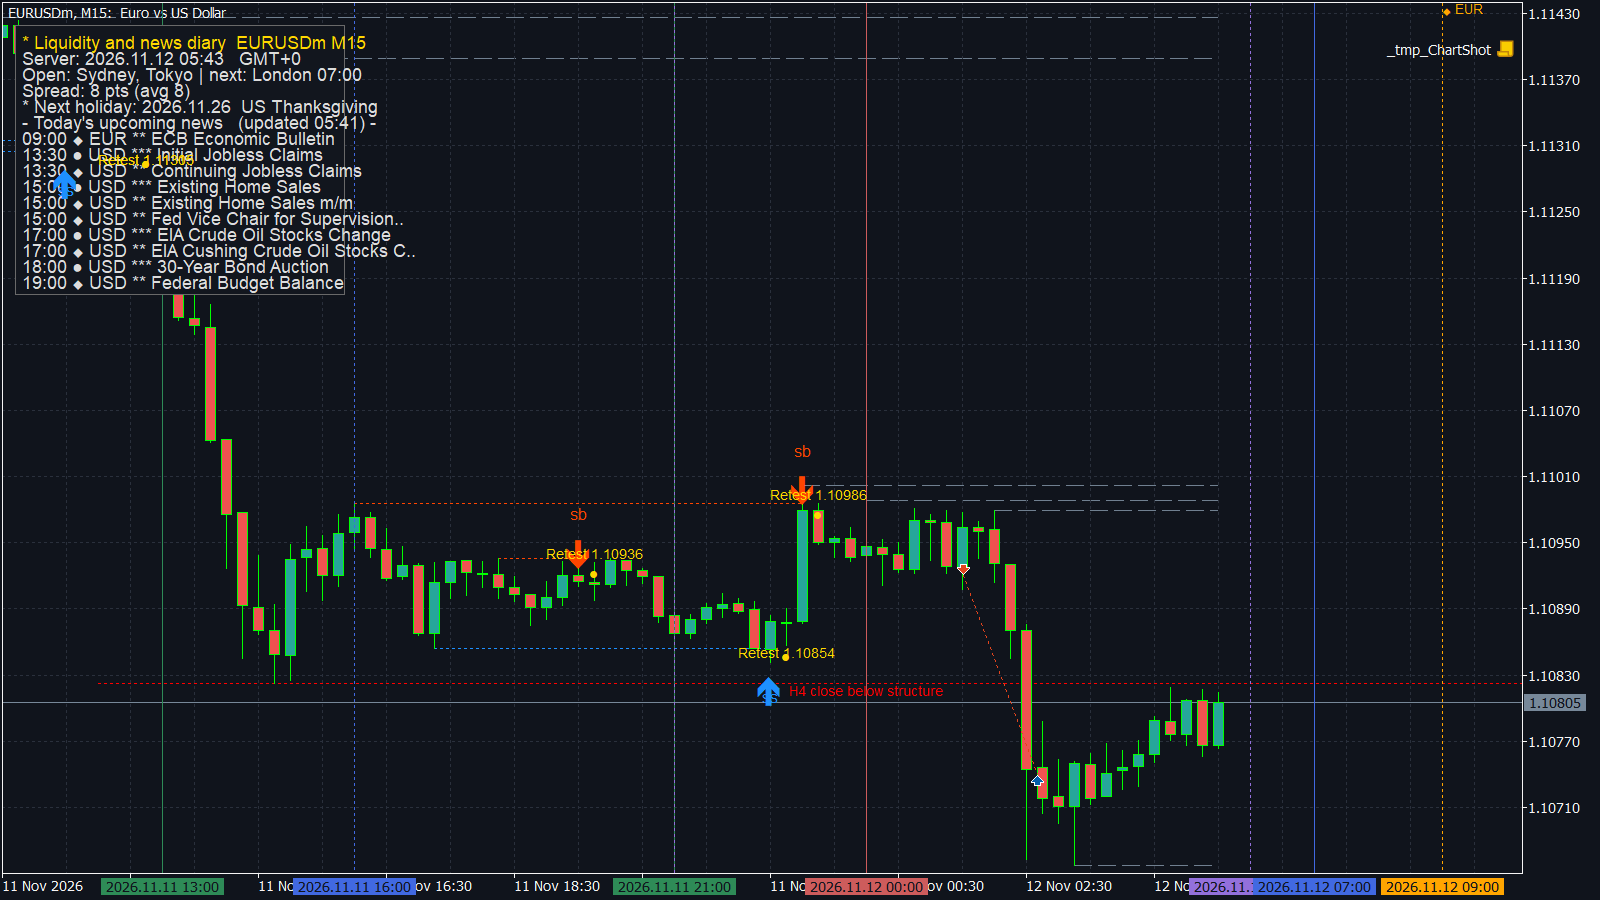
Figure 2 — M15 detail: the sweep, the displacement candle, then the entry on the retest of the swept level.
4. The four codes: read the chart in one second
| Code | Meaning | Trading implication |
|---|---|---|
| ss | Sell side sweep (lows taken) | Potential bullish turn |
| sb | Buy side sweep (highs taken) | Potential bearish turn |
| ds | Sell entry after a buy side sweep | Sell signal |
| db | Buy entry after a sell side sweep | Buy signal |
Important direction detail: ds (sell) comes after a highs sweep, and db (buy) comes after a lows sweep. Traders reading the chart quickly get this wrong all the time. Optionally, untapped liquidity levels can be displayed too, so you know which areas price may still target.
5. Time and news: context, not decoration
A sweep that happens in a thin market, or ten minutes before a major release, is entirely different from a sweep at the London open with clear structural context.
- Sessions: liquidity concentrates at the London and New York opens. A sweep in the middle of a tight Asian session may be pure noise.
- Bank holidays: thin liquidity, wide spread, moves without continuation.
- News: a sweep before a high impact release may be preparation for a later expansion, not a reversal.
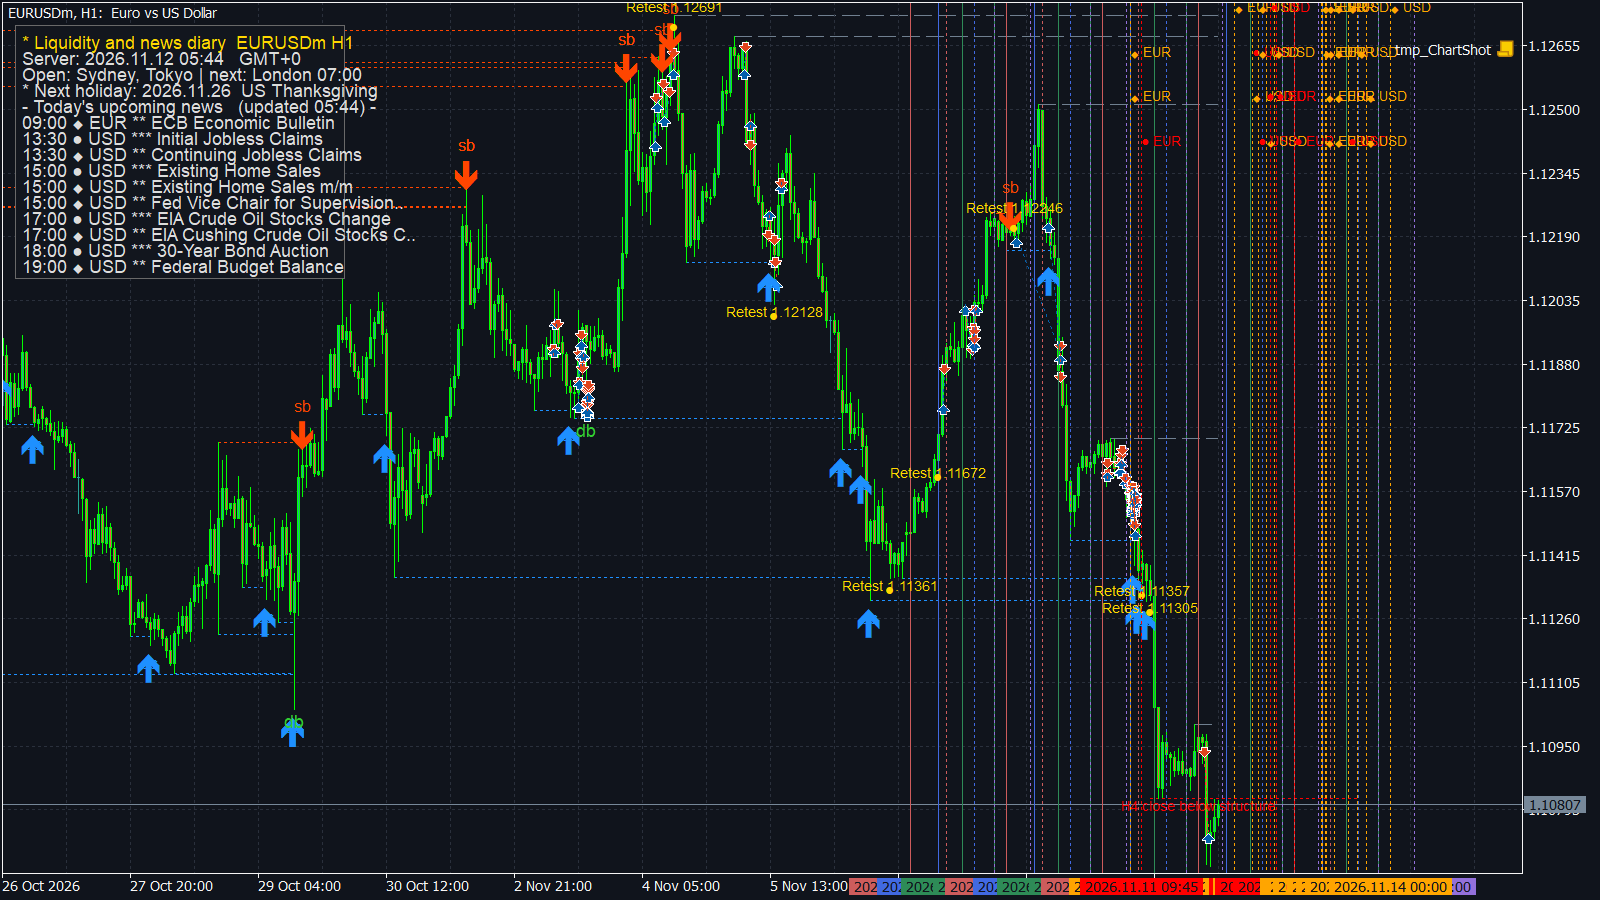
Figure 3 — On H1: session open and close lines, news vertical lines with impact markers, and a bank holiday marker.
The panel: chart context in one place
- Server time with the GMT offset detected automatically and adjustable manually, including half hour offsets such as GMT+2:30.
- Currently open sessions and the next bank holiday.
- The current spread — a number worth checking before any entry.
- The next releases for the currencies of the traded symbol, filterable by importance and by currency.
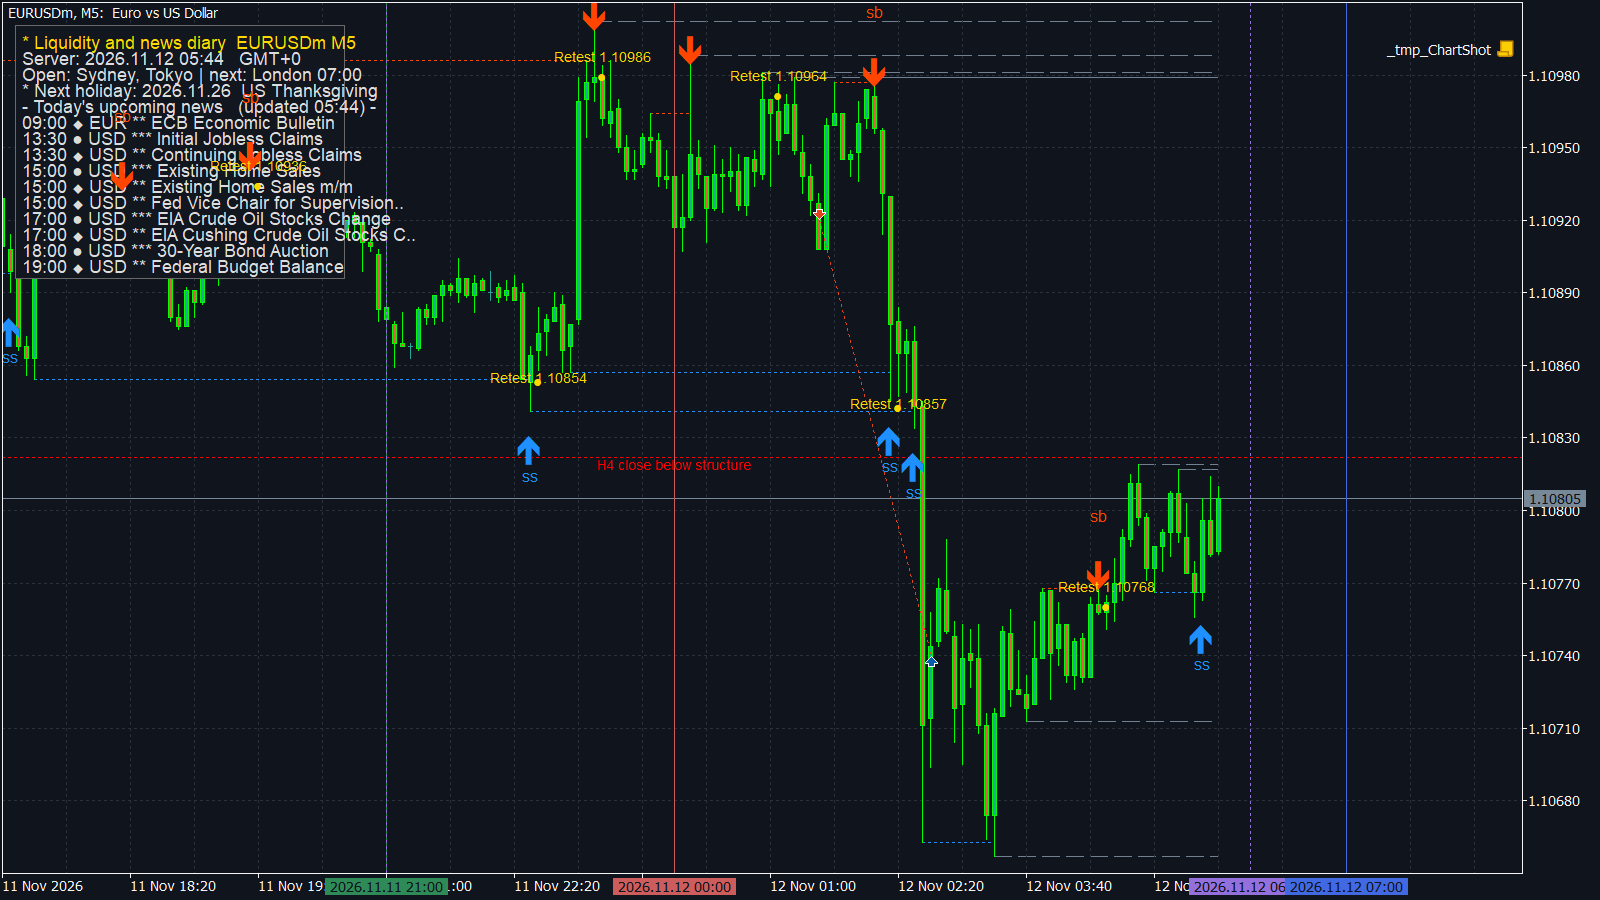
Figure 5 — On M5: the live panel showing time, session, spread, upcoming releases and the ATR range state.
Technical limit: calendar data is provided by the MetaTrader 5 platform itself. If your broker does not deliver calendar data, the news part stays empty and the panel reports it. The indicator does not invent substitute data.
6. H1/H4 structure: why add a higher layer?
A good setup is not built from a single timeframe. A sweep on M5 inside an H4 downtrend is far weaker than a sweep aligned with it. For that reason the indicator also marks structure closes on H1 and H4: did price close above or below a previous structural level by a sufficient distance? This layer acts as a simple trend filter.
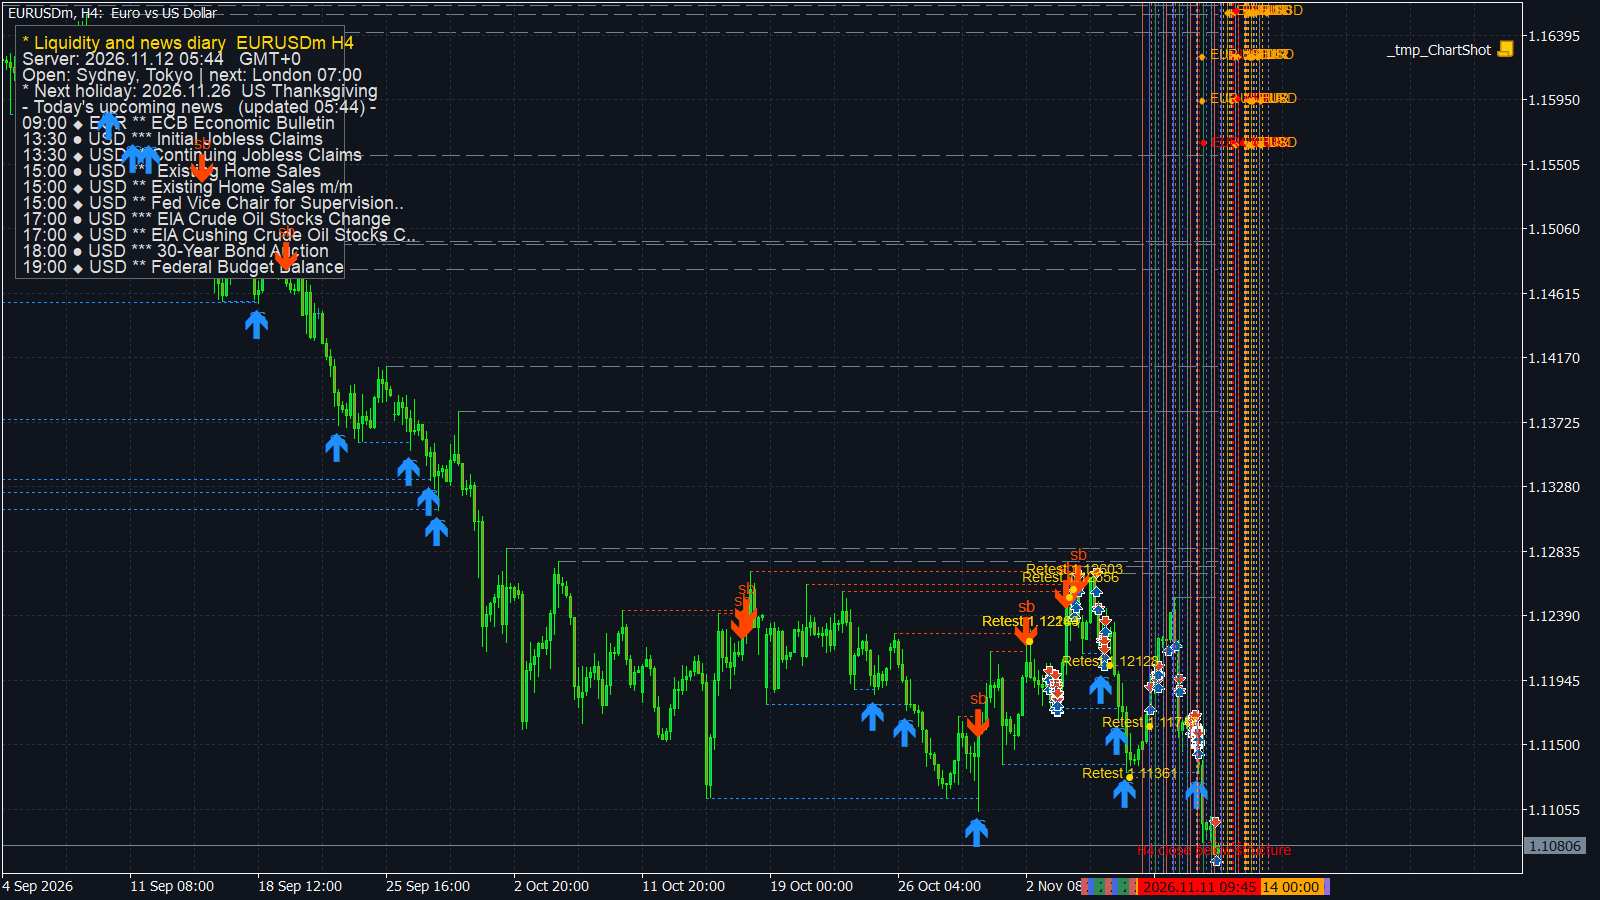
Figure 4 — On H4: a structural close with swing levels, used to define overall direction before any lower timeframe setup.
7. Three ready-made setting profiles
Points in MetaTrader 5 are not identical across symbols and brokers: a point is the smallest price change for the symbol's number of digits. Start from the defaults, then adjust after measuring your own symbol. The indicator works in points, not in pips.
| Input | Conservative (H1/H4) | Balanced (default) | Fast (M5/M15) |
|---|---|---|---|
| InpSwingLeft / InpSwingRight | 5 / 5 | 3 / 3 | 2 / 2 |
| InpBreakTolPts | 3 | 2.0 | 1.5 |
| InpInjectMaxBars | 8 | 6 | 5 |
| InpInjectRetestBars | 4 | 3 | 2 |
| InpInjectBodyRatio | 1.2 | 1.0 | 0.9 |
| InpMinImportance | 3 | 2 | 2 |
| InpInjectMaxSpreadPts | 8 | 10 | 5 |
Golden rule: any change that produces more signals must be tested on historical data first, never directly on a live chart.
8. Seven mistakes that empty the tool of its value
- Entering on the sweep alone, without displacement and retest.
- Waiting for confirmation then entering after price passed the invalidation level.
- Ignoring spread, especially around the daily rollover.
- Using the same tolerance on every symbol; gold and indices are not EURUSD.
- Fighting the higher timeframe direction on H1/H4.
- Trading thin markets or bank holidays.
- Expecting a stable value in the middle of the current candle; signals are calculated on closed bars on purpose.
9. For developers: reading the signals inside an Expert Advisor
| Buffer | Content | How to read it |
|---|---|---|
| Buffer 0 | Swept level price on the sweep bar | Positive = sell side liquidity taken, negative = buy side liquidity taken. Use MathAbs for the price. |
| Buffer 1 | Entry signal | +1 buy entry ( db ), -1 sell entry ( ds ) |
| Buffer 2 | News importance on that bar | 1 low, 2 medium, 3 high |
In all cases the buffers store EMPTY_VALUE when the condition is not met.
int hLiq = INVALID_HANDLE; int OnInit() { hLiq = iCustom(_Symbol, PERIOD_H1, "LiquiditySweep_NewsDiary"); if(hLiq == INVALID_HANDLE) return(INIT_FAILED); return(INIT_SUCCEEDED); } bool ReadLiquiditySignal(int &entryDir, double &newsImp) { entryDir = 0; newsImp = 0.0; double entry[], news[]; ArraySetAsSeries(entry, true); ArraySetAsSeries(news, true); if(CopyBuffer(hLiq, 1, 0, 2, entry) != 2) // buffer 1 = entry return(false); if(CopyBuffer(hLiq, 2, 0, 2, news) != 2) // buffer 2 = news return(false); if(entry[1] == EMPTY_VALUE) return(false); entryDir = (int)entry[1]; newsImp = (news[1] == EMPTY_VALUE ? 0.0 : news[1]); return(entryDir != 0); }
Always check the CopyBuffer return value, do not read bar 0 if your strategy relies on a confirmed close, and add a spread filter and a time filter before sending any real order. The indicator does not trade; execution is the responsibility of your Expert Advisor, and of you.
10. Limits of the tool and disclaimer
- The indicator draws only; it never opens, modifies or closes orders.
- Signals are calculated on closed bars, so they appear after the confirming bar.
- The news part depends entirely on the platform calendar and on the broker's data.
- It works on any symbol and timeframe, but result quality varies with liquidity and spread.
- No indicator guarantees an outcome, and a historical test is not proof of future performance.
11. Installation and first five minutes
- Open MetaTrader 5 and press Ctrl + O , then open the Navigator → Indicators tab.
- Drag LiquiditySweep_NewsDiary onto a chart, or use Insert → Indicators → Custom .
- Start with the balanced (default) profile on H1 or M15 to build a feel for the behaviour.
- Enable InpNotifyPopup for terminal popups and the optional InpNotifyPhone (disabled by default and throttled).
| ✔ | Check before every setup |
|---|---|
| 1 | Symbol and timeframe suit the trading style |
| 2 | Current spread is normal |
| 3 | No high impact release inside the setup window |
| 4 | Not a bank holiday and not a thin market |
| 5 | H1/H4 direction does not contradict the signal without a reason |
| 6 | Invalidation level defined before entry, position size derived from it |
12. FAQ
Does the indicator repaint?
No. Signals are calculated on closed bars, so a marker appears after the bar that confirms it. That is a delay, not a repaint.
Does it work on gold, indices and CFDs?
Yes, on any symbol and timeframe. Point-based tolerances must be adjusted per symbol, because a point is not worth the same everywhere.
Do I need the economic calendar to use it?
No. Sweeps, displacement, retests, sessions and the ATR logic work without it. Only the news part depends on the platform calendar delivered by your broker.
Can I use it to trade automatically?
Not by itself. It draws only. Three buffers are exported so an Expert Advisor can read the signals through iCustom and CopyBuffer — see section 9.
Why does a sweep sometimes fail?
Because this is a probabilistic read, not certainty. A sweep inside a strong trend can be a simple pullback, and thin liquidity or a nearby release can invalidate a technically correct setup.
Conclusion
A liquidity sweep is not a secret, it is a read of market intent: price visits the cluster of resting orders, fills it, then states its real opinion through displacement — or through the absence of it. Turning that idea into rules (valid level, limited penetration, returning close, measured displacement, retest inside a time window) is what separates a repeatable setup from a visual impression.
Good tools do not hand you trades; they shorten analysis time and remove mechanical mistakes. The indicator used in this article is available on the MQL5 Market: Liquidity Sweep Radar with News Diary.
Disclaimer: this content is educational only and is not investment advice. Leveraged trading carries the risk of losing capital. The indicator is a drawing and analysis tool and does not guarantee any result.