
Reading Strength and Weakness with Volume Spread Analysis in MetaTrader 5

Reading Strength and Weakness with Volume Spread Analysis in MetaTrader 5
Why volume alone is not enough — and how candle spread, closing position and market context can change the interpretation.
A large volume bar catches attention, but what does it really mean? Strong participation can accompany a breakout, a selling climax, absorption or an exhausted move. To interpret the activity, a trader needs to look at the relationship between volume, the candle's High–Low range, its closing position and the surrounding price action.
This is the central idea of Volume Spread Analysis (VSA), a methodology associated with Tom Williams. In this context, spread means the High–Low range of a price bar — not the broker's Bid/Ask spread.
1. What do Signs of Strength and Weakness mean?
VSA looks for possible imbalances between buying and selling pressure. A Sign of Strength (SOS) may suggest reduced selling pressure or demand emerging; a Sign of Weakness (SOW) may suggest reduced buying pressure or supply becoming more influential. Neither is an automatic entry signal.
For example, a wide down bar on high volume that closes well away from its low may deserve a different interpretation from a wide down bar that closes near its low. The candle's result matters as much as the apparent effort.
2. Five VSA events worth learning to recognize
- Selling Climax: unusually intense selling activity that can indicate exhaustion or absorption, depending on the closing position and subsequent bars.
- Buying Climax: strong upward activity that can indicate exhaustion or supply appearing after an extended rise.
- Up Thrust: an attempt to move above an area of resistance followed by rejection and a weak close.
- Pseudo Down Thrust: a VSA strength-related pattern that requires surrounding context and confirmation rather than an automatic buy decision.
- No Demand / No Supply: relatively low activity that can help assess whether a move has convincing participation.
The same label can have different significance depending on where it appears. Context, nearby levels, relative volume and the next bars remain essential.
3. Relative volume and relative candle spread
One useful way to compare current activity with recent conditions is through normalized readings:
Relative Volume = Current Bar Volume / Average Volume
Relative Spread = Current Bar High–Low Range / Average High–Low Range
Suppose Relative Volume is 1.80x while Relative Spread is 0.65x. Activity is elevated, but the price range is relatively narrow. That relationship invites investigation: are orders being absorbed, or is the market merely consolidating? Compare it with a bar showing 1.80x volume and 1.70x spread — similar effort, but a very different price result.
For Forex and many CFDs, MetaTrader 5 may provide tick volume rather than exchange-traded volume. The active source matters and should not be confused with centralized market volume.
4. Reading VSA patterns bar by bar
A practical workflow starts with the broader trend or trading range, then examines the sequence of bars rather than treating one pattern in isolation. Look at:
- Where the bar appears relative to recent highs, lows and possible support/resistance.
- Whether volume is high or low compared with recent bars.
- Whether the candle's range is wide or narrow.
- Where the candle closes within its range.
- How subsequent closed bars confirm or contradict the initial reading.
This is particularly valuable for traders learning to distinguish Signs of Strength from Signs of Weakness on a live chart.
5. Why I developed Volume Spread Flow MT5
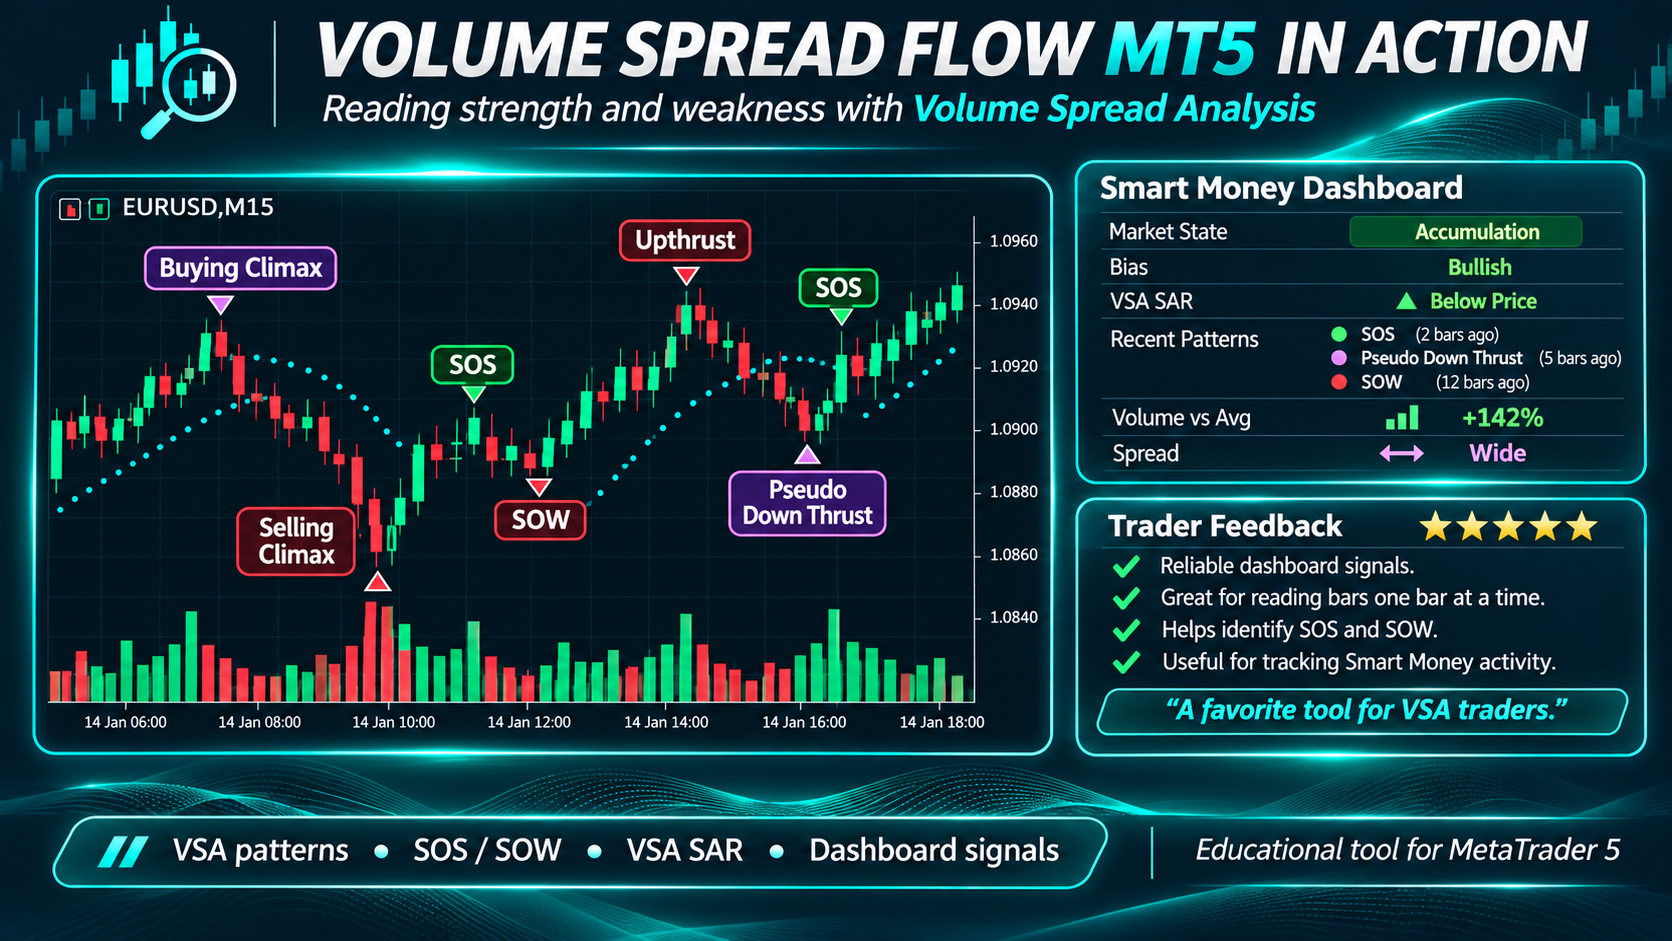
To make these relationships easier to follow in MetaTrader 5, I developed Volume Spread Flow MT5. It organizes 12 primary VSA pattern classifications, Strength/Weakness labels, relative volume and candle-spread readings, and a dynamic VSA SAR directional reference in a compact dashboard. Pattern labels are displayed on their corresponding candles.
The goal is not to replace the trader's judgment with simple BUY/SELL arrows. It is to make potentially meaningful behavior easier to recognize and review, one closed bar at a time.
6. Feedback from a trader using the indicator
One purchaser left a five-star review highlighting the clarity of the dashboard, the VSA SAR and the value of seeing Strength/Weakness indications directly on the chart. In the customer's words:
“Printing SOS and SOW in the chart will help new VSA traders to read the chart bar by bar.”
The same review particularly mentioned Pseudo Down Thrust as a favorite setup and described the product as a useful tool for tracking activity associated with the Smart Money approach.
I appreciate this feedback because it reflects the original design objective: clearer interpretation of VSA conditions, not a promise of profitable trades. Individual user experience is not evidence that an indicator has a guaranteed trading edge.
Conclusion
VSA can be useful when volume is interpreted together with candle range, closing position and market context. Labels such as Selling Climax, Up Thrust, SOS and SOW are analytical observations that need confirmation — not predictions.
For screenshots, the complete feature list and the original customer review, see Volume Spread Flow MT5 on the MQL5 Market.
Educational content only. Volume Spread Flow MT5 is an analytical indicator, not an automated trading system, and it does not guarantee trading outcomes.




