How to Backtest Telegram and Discord Trading Signals with Multi Risk Manager Pro and Risk Lab

A signal channel posts a buy entry, a Stop Loss and two profit targets. Later, the channel posts “TP1 hit” and asks subscribers to move the stop to breakeven. To evaluate that trade, you need more than the opening message. Did the available price data reach the entry? How much of the position closed at TP1? When did the breakeven rule take effect?
The Backtest page in the Multi Risk Manager Pro Windows companion lets you replay supported historical signals using price data and explicit execution rules. Risk Lab then uses those simulated outcomes to explore a different question: how might drawdown change if losing trading days occurred closer together?
Multi Risk Manager Pro for MT5 · Multi Risk Manager Pro for MT4 · MQLEXP public channel on MQL5
1. Choose a Signal Channel and a Defined Period
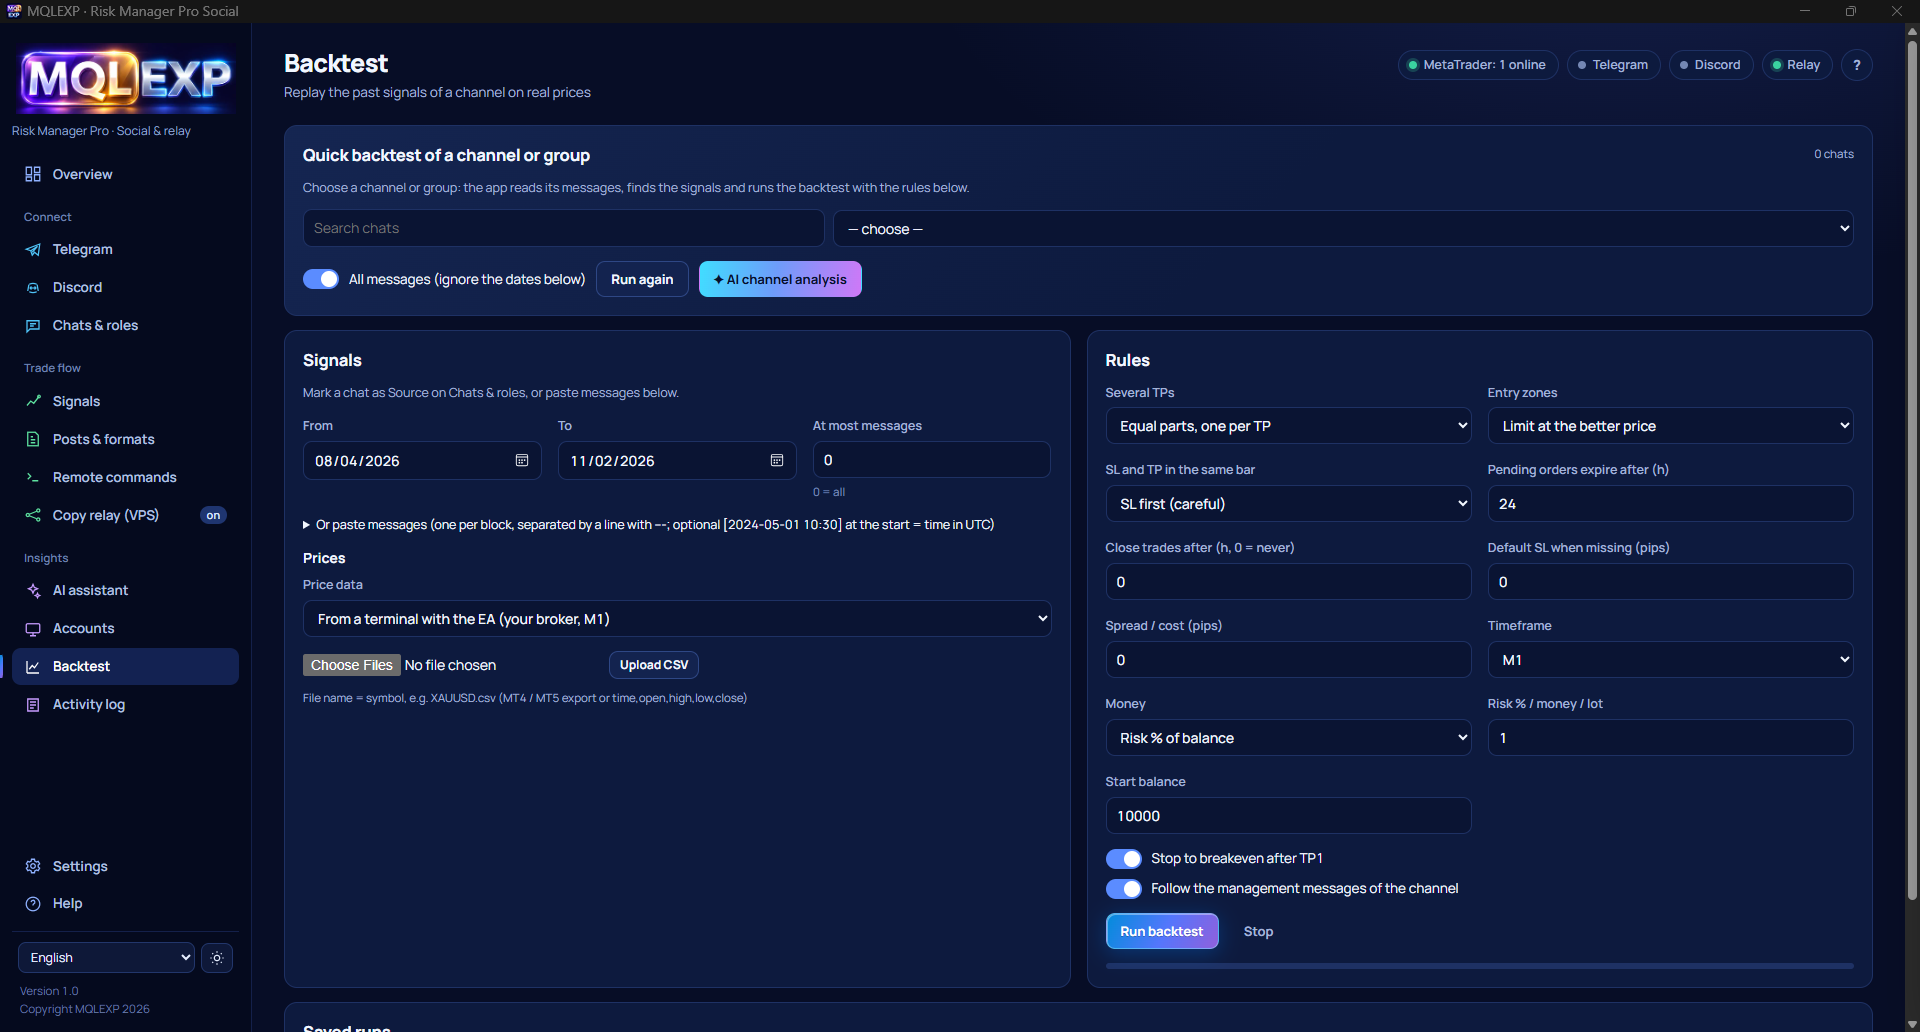
In the Windows companion, open Backtest and select a connected Telegram or Discord chat configured as a Source. You can also paste messages to examine a small sample before loading a longer history.
For a first run, choose one channel, one symbol and a period you can inspect manually. If you enter From and To dates, turn off All messages (ignore the dates below). Otherwise, the quick backtest can include messages outside the period you intended to study.
Before running the test, open Signals → Parser tester and check a few representative messages. Include an entry, a message with multiple targets and a follow-up if the channel uses them. Verify the symbol, direction, entry, stop and target order. If the channel writes GOLD and your broker uses XAUUSD , confirm the symbol mapping before choosing the price data.
2. Match the Signals to the Price Data
Under Prices, choose how the simulator will obtain historical bars. The companion supports broker M1 bars from a terminal running the EA, CSV price data and a Yahoo data option where coverage is available.
For a broker-specific test, start with that broker’s symbol and bars. Check that the data covers the signal period, including enough time after the last message for a pending entry to trigger or an open trade to close. If you import a CSV, verify the time zone by matching a known candle with the corresponding time in MetaTrader.
A useful first check is to pick one message and locate its timestamp on the chart. If the signal appears several hours away from the expected candle, resolve the time difference before interpreting entries, exits or win rate.
3. Set the Rules That Determine Each Simulated Trade
| Backtest setting | Decision it controls |
|---|---|
| Several TPs | How the simulated position is divided across multiple targets |
| Entry zones | Which entry rule applies when a signal gives a price range |
| SL and TP in the same bar | Which exit the simulator records when one candle reaches both levels |
| Pending orders expire after | How long an unfilled entry remains eligible |
| Spread / cost | The trading-cost assumption applied to the simulation |
| Money, Risk and Start balance | How simulated positions are sized and how monetary results are calculated |
| Stop to breakeven after TP1 | Whether reaching the first target changes the stop on the remaining volume |
| Follow the management messages of the channel | Whether supported follow-ups, such as a stop change or partial close, affect the replay |
Choose an explicit holding period if you want to compare runs under the same time limit. Also record whether breakeven is applied automatically at TP1 or through a later channel message. A delay between those two events can change the outcome of the remaining position.
4. Work Through One Ambiguous Candle
Consider a fictional buy trade that is already open at 100, with a stop at 99 and a single target at 102. The next one-minute candle reaches a low of 98.8 and a high of 102.2. Both exit prices fall inside the candle, but its high and low do not tell you which came first.
With a stop-first assumption, the simulated exit is −1R before costs. With a target-first assumption, it is +2R. Here, 1R is the original one-point distance from entry to stop. The three-R difference comes entirely from the assumed price sequence.
Run the same sample twice, changing only the same-bar rule. Inspect which trades change. If a few ambiguous candles account for much of the reported return, include both outcomes in your notes. That tells you more about the reliability of the result than either headline figure alone.
5. Inspect the Trades Before Reading the Summary
Click Run backtest. Start with the individual trades and compare them with the original channel messages. Choose at least one winner, one loser and one signal that did not produce a completed trade.
Check the first message the parser recognized, the symbol used for pricing, whether the entry filled, and which event caused the exit. For a multi-target trade, follow the remaining volume after TP1. For an unfilled signal, check whether the order expired or the required price data was missing. Those are different outcomes and should be described separately.
Save the HTML report for review or export the trades as CSV for a closer comparison. Label the results Historical Signal Backtest when sharing them. Use HISTORY in MetaTrader when you want to compare the simulation with trades actually recorded on an account.
6. Use Risk Lab to Explore Drawdown
Two samples can contain the same trading days and end with very different drawdowns along the way. Three losing days clustered near the beginning of a challenge can reach a loss threshold before later profitable days have a chance to contribute.
Once the backtest contains enough represented trading days, Risk Lab uses the historical day results to run 2,000 simulated challenge scenarios. Review the profit target, daily-loss threshold, total-loss threshold and allowed duration together. Risk Lab also provides return and drawdown estimates across the tested risk settings.
Read the displayed best risk per trade as the setting that performed best among the values tested under those particular assumptions. Changing the sample period, execution costs or challenge limits can change that ranking. Likewise, the worst drawdown observed in the simulations describes those runs; a future sequence can produce a larger drawdown.
If you are evaluating a specific prop firm, compare its published rules with the model. A rule based on intraday floating equity or trailing drawdown can behave differently from a simulation built from historical trading-day outcomes.
7. Check the Result on a Second Period
Keep your parser, symbol mapping, costs and execution rules fixed. Run them on a later period that you did not use to select the settings. Compare three things: how many messages produced usable signals, how many exits depended on the same-bar rule, and how the drawdown range changed.
Record the channel, dates, price source and assumptions alongside each report. When the results differ, you can trace the difference to the messages, the price data or the rules you selected. That record also gives you a practical reference for comparing future demo trades with the historical replay.