A gold Expert Advisor can say “no martingale” in its description and still leave you with questions about how it handles a losing position. The wording does not answer them. Neither does a smooth balance chart. I would start with the deal list: what happens to the lot after a loss, and does every order have its own stop?
You do not need source code for this first check. About ten minutes with a Strategy Tester report, your own demo history, or a public account history can reveal patterns worth investigating. It cannot establish every rule inside an EA or guarantee future results. It can tell you whether the available evidence supports the description.
1. Put the deals in time order
Sort the list chronologically, oldest first. Locate the time, symbol, direction, volume or lot size, price, and profit columns. Look for Stop Loss and Take Profit information too; you may need to open the associated order or position details.
Keep entries and exits separate in your reading. A deal records an execution, so a closing deal is not necessarily a new position. Where identifiers are available, use them to connect entries with exits. Otherwise, a partial close or several executions can look like several independent trades.

Figure 1. The deal list sorted oldest first. Read the lot, Stop Loss, Take Profit and profit columns.
2. Follow the lot after a loss
Find a completed losing position, then read the volume of the next new entry. Repeat this across several losses, especially consecutive ones. Does the size stay unchanged, vary without an obvious sequence, or rise repeatedly after losses?
For illustration only, assume entries of 0.1, 0.2, and 0.4 lots, each following a loss on the previous position. That doubling pattern deserves attention. These are assumed numbers, not data from any product. Increases can also be smaller or delayed, so do not search only for exact doubling.
A larger next lot is a question, not a verdict. Position sizing can change with the balance and the distance to the stop. Compare those details where available. The warning sign is a repeated relationship between losing and increasing exposure.
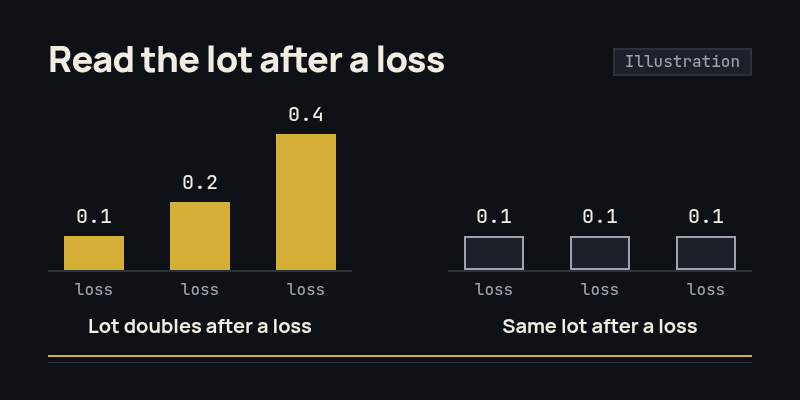
Figure 2. Illustration with assumed numbers, not product data: doubling after losses versus the same lot.
3. Check the stops order by order
Check whether each order has its own Stop Loss and Take Profit. Do not infer this from a description that mentions “risk management,” or from a group of positions closing together. Look for the actual levels attached to each order and whether anything was left without a stop.
A basic deal list may not show those fields or when a stop was added, changed, or removed. A profitable exit does not prove that a Stop Loss existed beforehand. If the report lacks that information, mark the check as unverified. Use the order details and, on your own demo, inspect open positions and the available logs.
A Take Profit is an exit target, not a substitute for a Stop Loss. An individual stop also does not guarantee execution at its exact price.
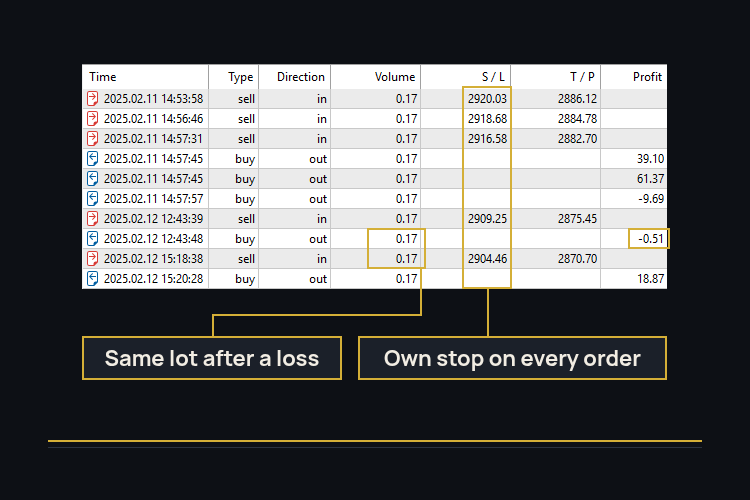
Figure 3. Gold Storm PRO deals: the lot stays the same after a loss, and every order has its own Stop Loss.
4. Look for positions closed at the same time
Next, look for several positions that closed at the same moment, suggesting one shared exit. This is a trace worth checking because a grid or averaging EA typically closes its whole basket at once.
For those positions, compare entry times, prices, and lot sizes. Were entries added while the first position remained open and the market moved against it: buys added lower, or sells added higher? Did the lot grow with those additions? Repeated entries against the market movement can indicate averaging or a grid, even if the lot stays unchanged.
Several positions in the same direction are not sufficient evidence by themselves. If later entries came as price moved in the trade’s favour, with the same lot and each with its own stop, that is not averaging into a loser. Check the entry sequence alongside the shared exit.
Gold Storm PRO against the same checklist
No martingale, no grid. Gold Storm PRO is my Expert Advisor for XAUUSD (gold). Several positions in the same direction can be open at once. A second position with its own stop is not, by itself, adding to a loser.
The lot is not raised after a loss. It is calculated from the balance and the Stop Loss distance (or fixed). With the default settings, every order has its own Stop Loss and Take Profit. The Stop Loss type can be set to none.
The product page offers a downloadable demo for the Strategy Tester, so the same checklist can be repeated on Gold Storm PRO in a run of your own.
350%+ in 17+ weeks
Gold Storm PRO trades on our public MQL5 signal. See the signal →
Gold Storm PRO
Download the demo on the product page and test it yourself in the Strategy Tester: