Aggression Wave — User Manual (MetaTrader 5, Aggression Wave RSJ 6.20 and Aggression Wave PRO 2.20)

Available on the MQL5 Market: Aggression Wave PRO
Risk notice. Trading involves risk of loss. These indicators add up the buy and sell aggression of the trades already executed; they do not predict the market, do not place trades and do not guarantee any result. Use them together with your own analysis and risk management, and test on a demo account first.
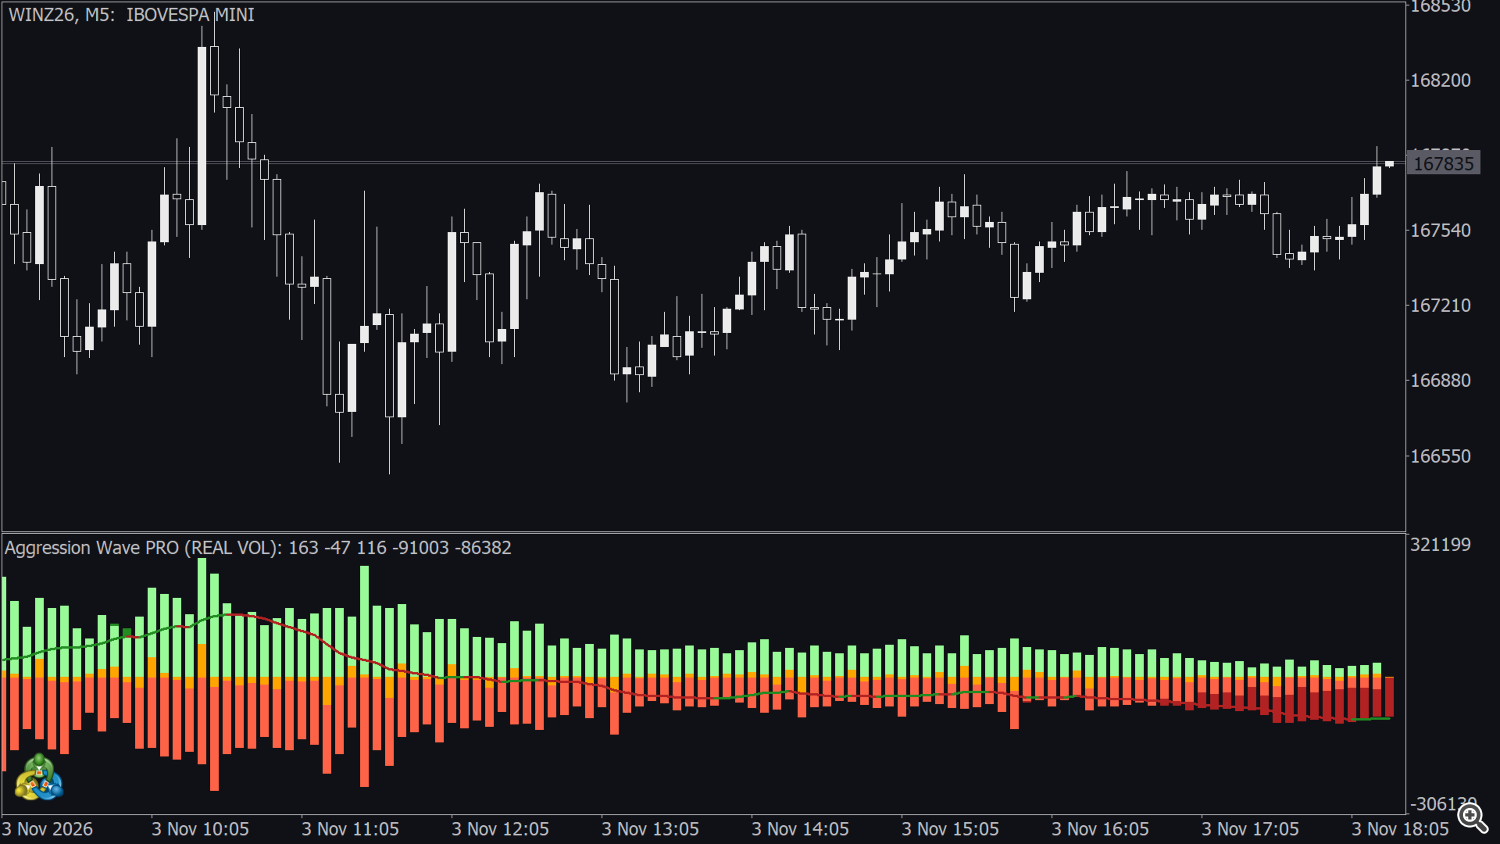
Aggression Wave adds up, candle after candle, the difference between the volume bought by aggressive buyers and the volume sold by aggressive sellers since the start of the day. The result — the aggression wave — rises while buyers dominate the flow of trades and falls while sellers dominate; it starts again from zero every day. A signal line (moving average of the wave) shows the direction of the flow. The family has two products:
- Aggression Wave RSJ (free, version 6.20): the daily wave and a fixed signal line.
- Aggression Wave PRO (version 2.20): the same engine plus 8 viewing modes (wave, buy, sell and delta aggression per candle), a configurable signal line, seven alerts and buffers for Expert Advisors.
Both work only on symbols whose broker delivers real trades with the aggressor side, such as B3 futures and stocks or CME futures (section 1). They do not open trades.
1. Requirements: real trades with buy / sell side
The indicators are built on the trade ticks of the symbol ( COPY_TICKS_TRADE ). Each trade must arrive with its aggressor side (buy or sell), as on exchange-traded instruments.
| Symbol / feed | Live result |
|---|---|
| B3 futures and stocks (WIN, WDO, IND, DOL, PETR4, VALE3 …) at a broker that delivers time & sales | works |
| CME / CBOT / NYMEX / COMEX futures (ES, NQ, CL, GC and their micro contracts) at a broker that delivers exchange trades | works |
| Forex, CFDs, most cryptocurrencies | does not calculate: the feed has quotes (bid / ask) but no trades, so the window stays empty |
| Exchange symbol at a broker that streams quotes only | does not calculate |
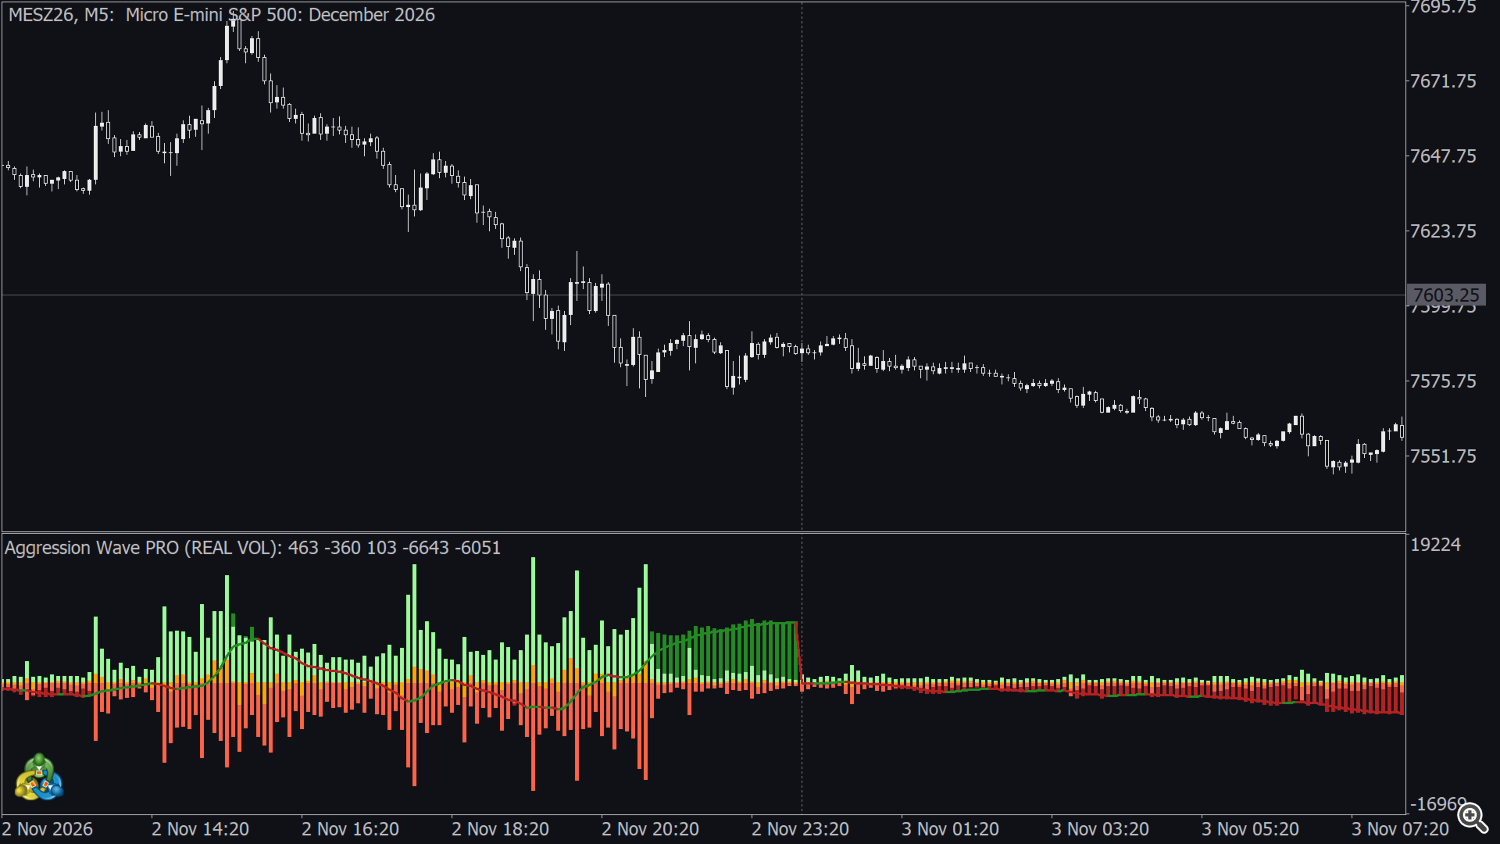
To check a symbol, open View → Market Watch, right-click the symbol → Ticks or Time & Sales: if you see a list of trades with volume and buy / sell side, the indicator can work on it. In the Strategy Tester the behaviour is different (section 10).
2. Installation and first start
- Download (free) or buy / rent (PRO) the indicator on the MQL5 Market and install it from the Market tab of the terminal (Toolbox → Market → Purchased → Install).
- Open a chart of a symbol with real trades (for example WINZ26 or WDOZ26 on M1-M15) and drag Aggression Wave RSJ or Aggression Wave PRO from the Navigator (Indicators → Market) onto it.
- Keep the default inputs or adjust them (section 8) and press OK.
The indicator opens in its own window below the price chart. The window name shows the volume type: RSJ Aggression (REAL VOL): (free) or Aggression Wave PRO (REAL VOL): , followed by the values of the bar under the mouse or of the last bar.
First load. At start the indicator downloads every trade from the Start Calculation date to now and classifies them one by one. On liquid symbols this is millions of trades: the first load can take from a few seconds to several minutes, more on M1 and with long starts. The terminal must also have the tick history of that period; on the first use it is downloaded from the broker. Until the history is ready the window stays empty. The PRO default, CURRENT_DAY, loads only the current day and is the fastest.
3. Indicator window legend
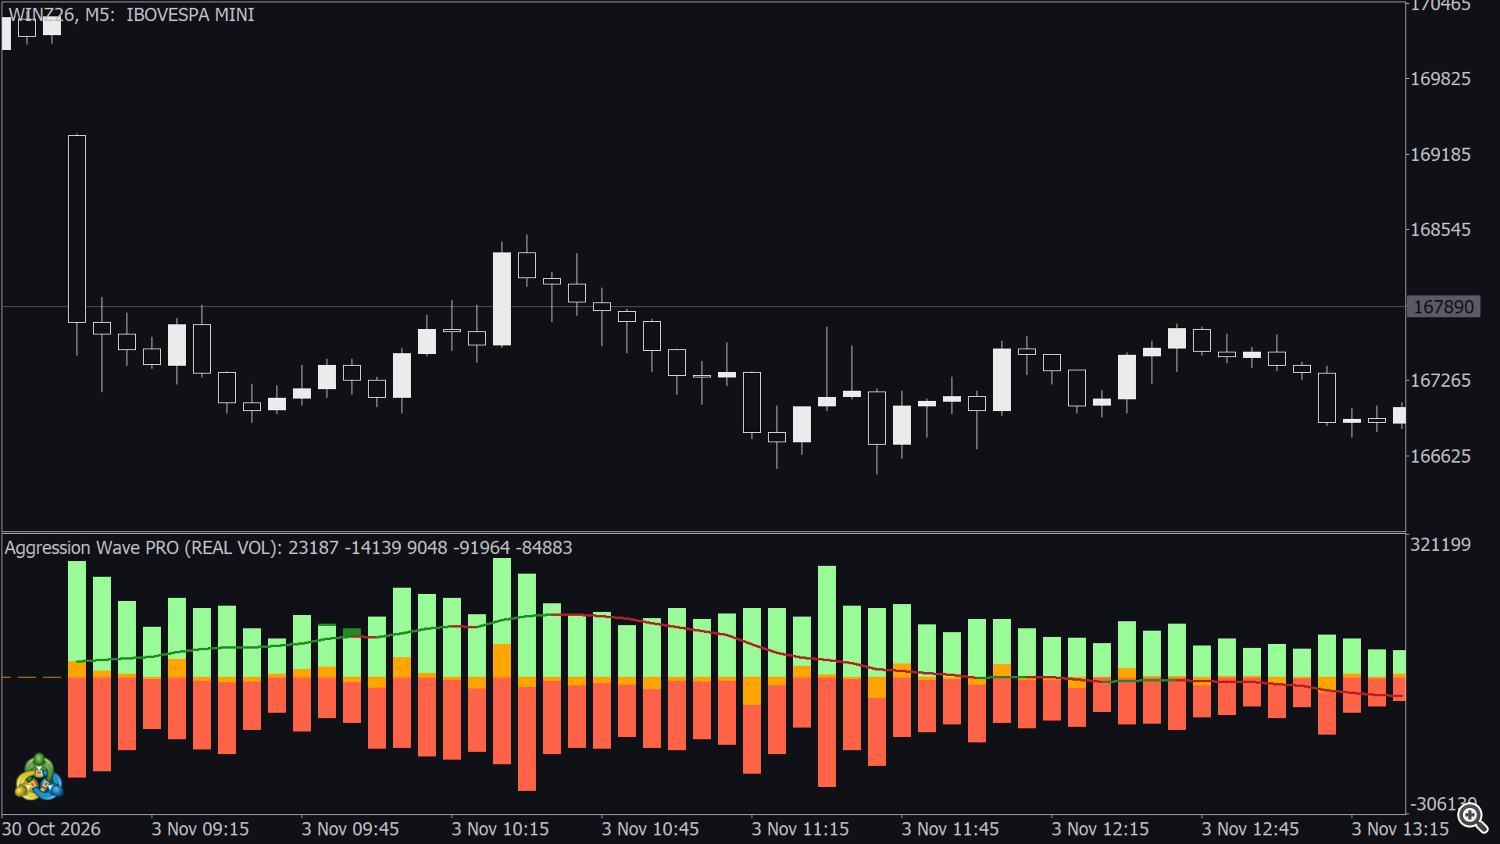
| In the indicator window | Meaning |
|---|---|
| Green column above zero | The wave (aggression accumulated since the start of the day) is positive: buyers have been more aggressive so far today. |
| Red column below zero | The wave is negative: sellers have been more aggressive so far today. |
| Green part of the signal line | Signal line rising. |
| Red part of the signal line | Signal line falling. |
| Black part of the signal line | Signal line unchanged from the previous bar. On a black background change this colour on the Colors tab. |
| Pale green column above zero (PRO) | Buy aggression of that candle alone. |
| Tomato column below zero (PRO) | Sell aggression of that candle alone (drawn as a negative value). |
| Orange column (PRO) | Delta of that candle alone: buy − sell aggression. |
| No columns on the left | Bars before Start Calculation: they are not calculated. |
The wave columns are cumulative within the day; the buy, sell and delta columns of the PRO version are per candle. They share one scale, so on an active day the wave columns are much taller than the per-candle columns. In the Data Window (Ctrl+D) the wave is shown as AGGRESSION (free) or TOTAL AGGRESSION (PRO).
All colours are changed on the Colors tab: WAVE AGGRESSION (positive, negative), BUY AGGRESSION, SELL AGGRESSION, DELTA AGGRESSION and WAVE SIGNAL (rising, falling, unchanged). The indicator does not draw any object on the price chart.
4. What the wave shows
4.1 Buy and sell aggression
Every trade is counted on the side of the participant who attacked the book: a trade that took the offer is buy aggression, a trade that hit the bid is sell aggression. On B3 and CME feeds the side arrives with each trade. The few trades that a feed does not mark clearly (for example some auction or cross trades) are also assigned to a side by the indicator, so every candle shows a complete balance.
4.2 Volume type
| Volume Type | What each trade adds |
|---|---|
| Real volume (default) | its traded volume (contracts or shares) |
| Tick volume | 1 — the indicator counts the number of trades, not the tick volume of the bar |
4.3 From the delta to the wave
- The delta of a candle is the balance between the buy and the sell aggression of that candle.
- The wave shows the balance accumulated since the first candle of the day up to the current candle: it rises while buyers dominate and falls while sellers dominate.
- On the first candle of each new day the wave starts again from zero.
The day is the calendar day of the server time of your broker. On B3 brokers it matches the session. On CME futures the session opens in the evening (US time); check where midnight of your broker's server falls in the session, because the wave restarts there.
The wave is drawn as a column from zero: green when it is zero or positive, red when it is negative.
4.4 Start Calculation
Start Calculation sets the first day whose trades are read. The date is counted back from the last server time and rounded down to 00:00 (server time) of that calendar day; the current day is always included.
| Option | First day calculated | Free | PRO |
|---|---|---|---|
| CURRENT_DAY | today | — | yes (default) |
| LAST_DAY | yesterday (calendar day) | — | yes |
| LAST_TWODAYS | 2 calendar days back | yes (default) | yes |
| LAST_FOURDAYS | 4 calendar days back | — | yes |
| LAST_WEEK | 7 calendar days back | yes | yes |
| LAST_MONTH | about 30 days back | yes | yes |
| LAST_6MONTHS | about 6 months back | yes | yes |
| LAST_YEAR | about 1 year back | — | yes |
| LAST_2YEARS | about 2 years back | — | yes |
| ALL_AVAILABLE_DAYS | all trades the terminal has | — | yes |
The days are calendar days: on a Monday, LAST_TWODAYS starts on Saturday and therefore shows only Monday. Because the wave restarts every day, a longer start does not change today's wave; it only shows more past days, with a slower first load.
If there is no trade yet between the start date and the current candle (for example CURRENT_DAY in the first candle of the session), the window starts drawing as soon as the first trades arrive; it no longer stays empty until the candle closes.
4.5 While the market is open
New trades are read on every tick and added to the forming candle and to the wave. Closed candles are not changed afterwards, with one exception: when a candle closes and its total does not match the real volume reported by the broker, that candle is read again from the tick history once, which can correct it slightly.
5. The signal line
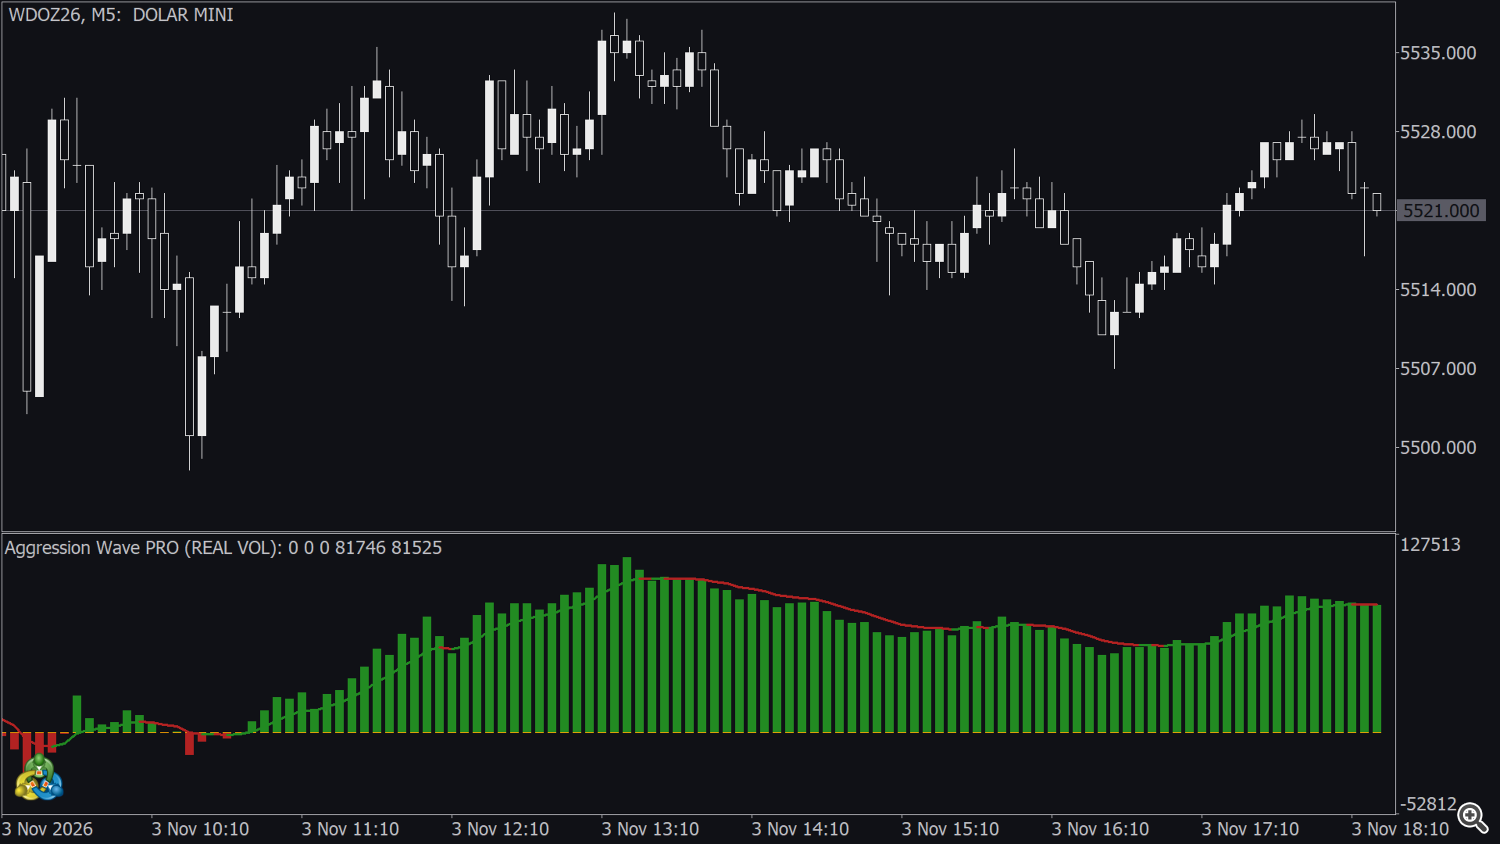
The signal line is a moving average of the wave.
| Aggression Wave RSJ (free) | Aggression Wave PRO | |
|---|---|---|
| Method | fixed, not configurable | Method: Simple, Exponential (default), Smoothed, Linear weighted |
| Period | fixed, not configurable | Period (default 8) |
| Restart every day | yes (fixed) | Reset Every New Day? (default true) |
- With the restart on, the signal line starts again at the first candle of each day, both on the current day and on the previous days shown on the chart.
- With Reset Every New Day? = false (PRO) the average runs continuously from the first day calculated; at each new day it needs a few candles to follow the restarted wave.
- If the chart stays open from one session to the next, the signal line restarts on its own at the new day; no refresh is needed.
- The signal line is drawn in every viewing mode of the PRO version, also when the wave columns are hidden.
6. Reading the wave
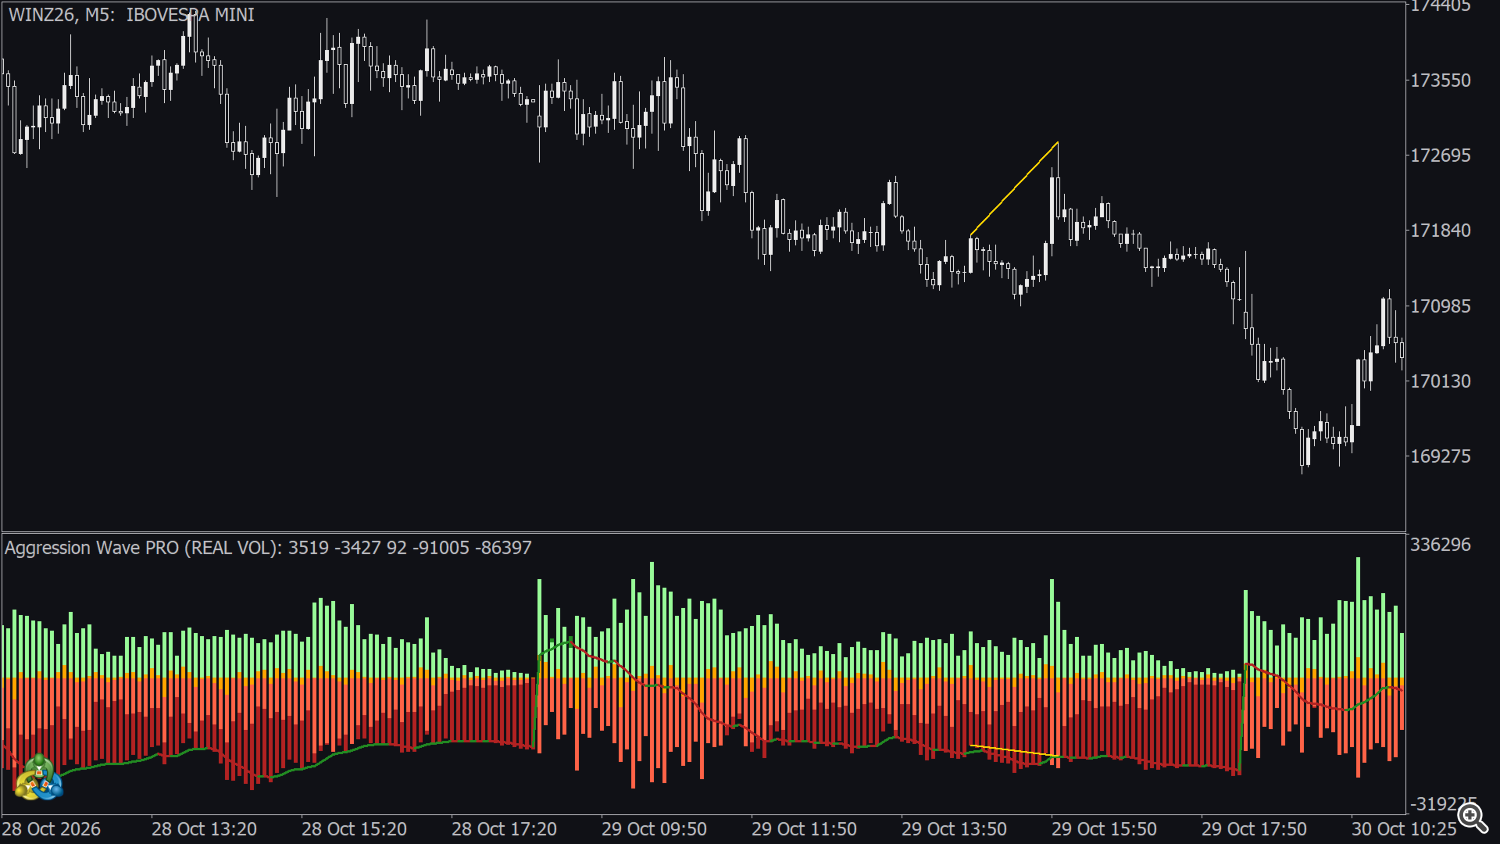
- Side of zero. Above zero, buyers have been more aggressive since the start of the day; below zero, sellers. A cross of zero shows that the balance of the day has changed side.
- Slope. A rising wave means that each candle adds buy aggression; a flat wave means balance; a falling wave means sell aggression. The colour of the signal line summarises this slope.
- Wave against the signal line. The wave above a rising signal line shows that the flow is accelerating in favour of buyers; below a falling line, in favour of sellers.
- Divergence. When price makes a new high but the wave does not (or a new low without a new low of the wave), the move happens with less aggression behind it. The indicator does not detect divergences automatically; compare the highs and lows of price and wave on the chart.
- Per-candle view (PRO). The buy, sell and delta columns show whether a change of the wave comes from one large candle or from steady flow.
The wave describes the trades already done. A strong wave can be absorbed by passive orders and followed by a move in the opposite direction.
7. Viewing modes and alerts (PRO)
7.1 Information to Plot
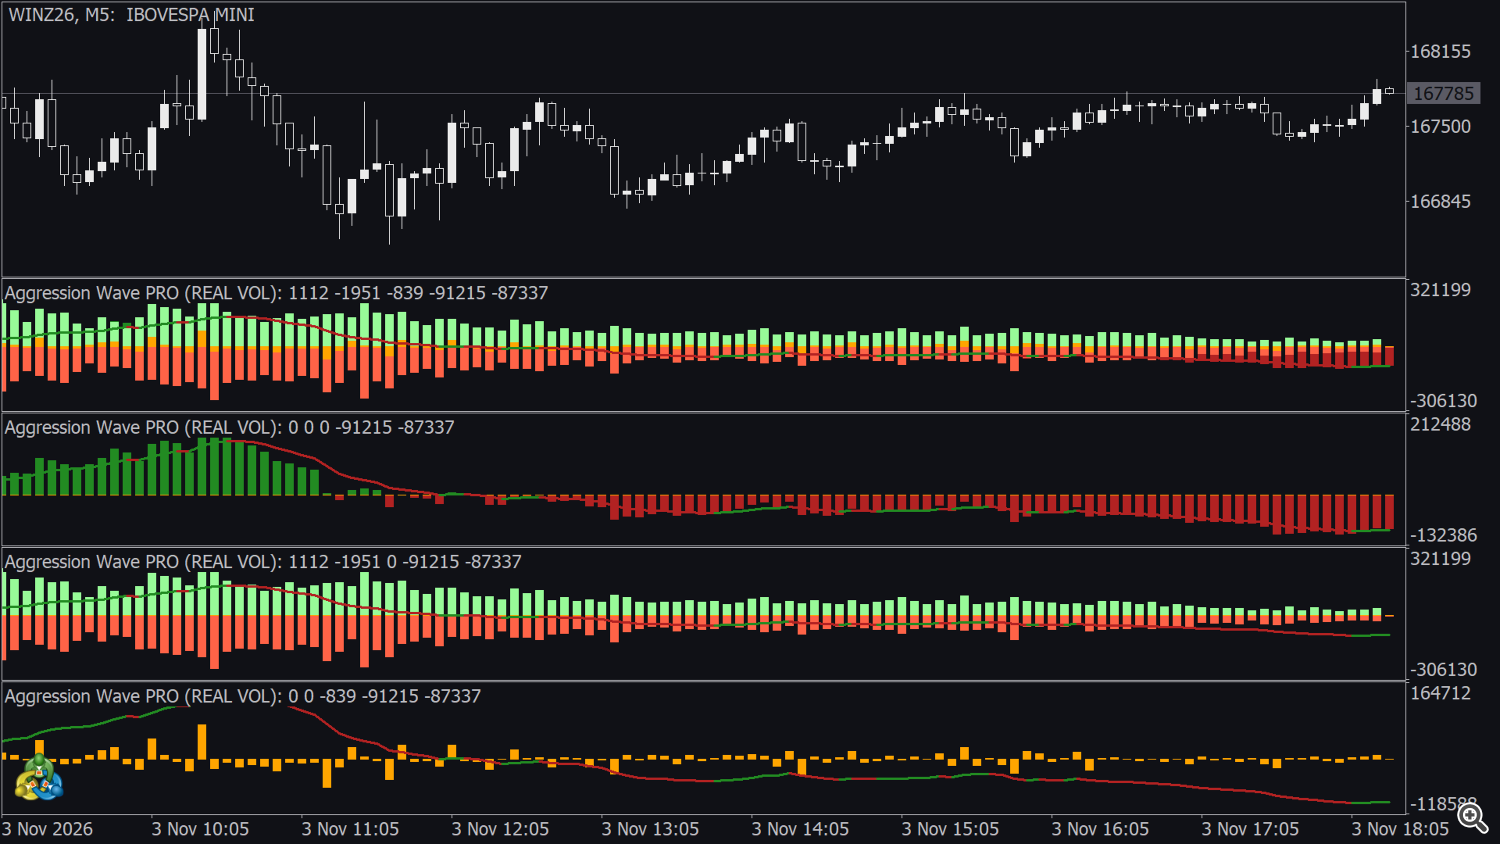
| Information to Plot | Wave | Buy | Sell | Delta |
|---|---|---|---|---|
| PLOT_ALL (default) | yes | yes | yes | yes |
| PLOT_WAVE_AGGRESSION | yes | — | — | — |
| PLOT_WAVE_DELTA_AGGRESSION | yes | — | — | yes |
| PLOT_BUY_AGGRESSION | — | yes | — | — |
| PLOT_SELL_AGGRESSION | — | — | yes | — |
| PLOT_DELTA_AGGRESSION | — | — | — | yes |
| PLOT_BUY_SELL_AGGRESSION | — | yes | yes | — |
| PLOT_BUY_SELL_DELTA_AGGRESSION | — | yes | yes | yes |
The signal line of the wave is drawn in all modes. The per-candle columns are drawn on top of the wave columns.
7.2 Alerts
The seven alerts are checked once per candle, at the first tick of a new candle, for the candle that has just closed. No alerts are sent for past candles when the indicator is loaded.
| Input | Fires when (closed candle) | Message |
|---|---|---|
| AGGRESSION Cross Signal | the wave crosses the signal line: above it after being at or below it (up), or the opposite (down) | TOTAL AGGRESSION Cross UP Signal Line! / TOTAL AGGRESSION Cross DOWN Signal Line! |
| AGGRESSION Cross Level 0 | the wave crosses zero | TOTAL AGGRESSION Cross UP Level 0! / TOTAL AGGRESSION Cross DOWN Level 0! |
| AGGRESSION Change Trend Color | the wave column changes from red to green or from green to red | TOTAL AGGRESSION change to UP TREND! / TOTAL AGGRESSION change to DOWN TREND! |
| SIGNAL Cross Level 0 | the signal line crosses zero | WAVE SIGNAL Cross UP Level 0! / WAVE SIGNAL Cross DOWN Level 0! |
| SIGNAL Change Trend Color | the signal line changes from falling (red) to rising (green), or the opposite, on consecutive bars | WAVE SIGNAL change to UP TREND! / WAVE SIGNAL change to DOWN TREND! |
| DELTA Cross Level 0 | the delta of the candle changes sign | DELTA Cross UP Level 0! / DELTA Cross DOWN Level 0! |
| DELTA Cross Defined Level | the delta of the candle crosses above DELTA Defined Level (%) (default 70 %) of the size of the previous candle's delta (up), or crosses below minus that value (down) | DELTA Cross UP Defined Level! / DELTA Cross DOWN Defined Level! |
- AGGRESSION Change Trend Color reads the wave columns: it works only in the modes that draw the wave (PLOT_ALL, PLOT_WAVE_AGGRESSION, PLOT_WAVE_DELTA_AGGRESSION). It fires on almost the same candles as AGGRESSION Cross Level 0.
- DELTA Cross Level 0 and DELTA Cross Defined Level read the delta columns: they work only in the modes that draw the delta (PLOT_ALL, PLOT_WAVE_DELTA_AGGRESSION, PLOT_DELTA_AGGRESSION, PLOT_BUY_SELL_DELTA_AGGRESSION).
- DELTA Cross Defined Level fires only on the candle where the delta crosses the defined level, not on every candle that stays beyond it.
- At the first candle of a day the wave restarts, so the crosses of the wave can fire there.
Each alert can be NONE (off), POPUP, SOUND, NOTIFICATION (smartphone), POPUP_SOUND, NOTIFICATION_SOUND, POPUP_NOTIFICATION or POP_SOUND_NOTIFICATION. All alerts are off by default. Each alert has its own Sound Type, one of the 13 terminal sounds: alert (default), alert2, connect, disconnect, email, expert, news, ok, request, stops, tick, timeout, wait.
The text includes the product, symbol and timeframe, e.g. Aggression Wave PRO: WINZ26 | PERIOD_M5 | TOTAL AGGRESSION Cross UP Signal Line! . Each alert type fires at most once per candle; several types can fire on the same candle. After a sound the indicator pauses for about 1.5 seconds so that consecutive sounds do not overlap. Push notifications need the MetaQuotes ID in Tools → Options → Notifications. There is no e-mail option. The free version has no alerts. The Strategy Tester shows no pop-ups, sounds or notifications.
8. Inputs
8.1 Aggression Wave RSJ (free)
VOLUME CONFIGURATION
| Input | Default | Description |
|---|---|---|
| Volume Type | Real volume | Real volume: traded volume of each trade; Tick volume: number of trades (4.2). |
CALCULATIONS CONFIGURATION
| Input | Default | Description |
|---|---|---|
| Start Calculation | LAST_TWODAYS | First day calculated (4.4): LAST_TWODAYS, LAST_WEEK, LAST_MONTH, LAST_6MONTHS. |
| Enable Debug MODE | false | Writes diagnostic messages to the Experts log. Keep it off. |
8.2 Aggression Wave PRO
VOLUME CONFIGURATION
| Input | Default | Description |
|---|---|---|
| Volume Type | Real volume | Real volume or Tick volume (number of trades) (4.2). |
CALCULATIONS CONFIGURATION
| Input | Default | Description |
|---|---|---|
| Start Calculation | CURRENT_DAY | First day calculated (4.4): CURRENT_DAY, LAST_DAY, LAST_TWODAYS, LAST_FOURDAYS, LAST_WEEK, LAST_MONTH, LAST_6MONTHS, LAST_YEAR, LAST_2YEARS, ALL_AVAILABLE_DAYS. |
| Information to Plot | PLOT_ALL | Viewing mode (7.1). |
SIGNAL CONFIGURATION
| Input | Default | Description |
|---|---|---|
| Method | Exponential | Simple, Exponential, Smoothed or Linear weighted (section 5). |
| Period | 8 | Period of the signal line. |
| Reset Every New Day? | true | Restarts the signal line at the first candle of each day. |
ALERT 1 CONFIG to ALERT 7 CONFIG
| Input | Default | Description |
|---|---|---|
| AGGRESSION Cross Signal | NONE | Alert mode, alert 1 (7.2). |
| AGGRESSION Cross Signal Sound Type | alert | Sound used by the sound modes. |
| AGGRESSION Cross Level 0 | NONE | Alert mode, alert 2. |
| AGGRESSION Cross Level 0 Sound Type | alert | Sound. |
| AGGRESSION Change Trend Color | NONE | Alert mode, alert 3. |
| AGGRESSION Change Trend Color Sound Type | alert | Sound. |
| SIGNAL Cross Level 0 | NONE | Alert mode, alert 4. |
| SIGNAL Cross Level 0 Sound Type | alert | Sound. |
| SIGNAL Change Trend Color | NONE | Alert mode, alert 5. |
| SIGNAL Change Trend Color Sound Type | alert | Sound. |
| DELTA Cross Level 0 | NONE | Alert mode, alert 6. |
| DELTA Cross Level 0 Sound Type | alert | Sound. |
| DELTA Defined Level (%) | 70.0 | Percentage of the size of the previous delta used by alert 7. |
| DELTA Cross Defined Level | NONE | Alert mode, alert 7. |
| DELTA Cross Defined Level Sound Type | alert | Sound. |
OTHERS CONFIGURATIONS
| Input | Default | Description |
|---|---|---|
| Enable Debug MODE | false | Writes diagnostic messages to the Experts log. Keep it off. |
9. Buffers for Expert Advisors / dashboards
All buffers of both versions can be read with iCustom + CopyBuffer , including the buffers that are not drawn. Values are in the unit of Volume Type. Bars before Start Calculation hold 0 .
9.1 Aggression Wave RSJ (free) — 8 buffers
| Buffer | Content | Values |
|---|---|---|
| 3 | Wave (drawn column) | aggression accumulated since the start of the day |
| 4 | Wave colour | 0 zero or positive, 1 negative |
| 5 | Signal line | signal line of the wave |
| 6 | Signal colour | 0 rising, 1 falling, 2 unchanged |
| 7 | Wave (AGGRESSION) | same value as buffer 3 |
Buffers 0-2 are the open (always 0), high and low of the wave column.
9.2 Aggression Wave PRO — 30 buffers
| Buffer | Content | Values | Filled in the modes |
|---|---|---|---|
| 3 | Wave (drawn column) | aggression accumulated since the start of the day | with the wave |
| 4 | Wave colour | 0 zero or positive, 1 negative | with the wave |
| 8 | Buy aggression of the candle | ≥ 0 | with buy |
| 13 | Sell aggression of the candle | ≤ 0 (negative value) | with sell |
| 18 | Delta of the candle | buy − sell | with delta |
| 20 | Signal line | moving average of the wave | all |
| 21 | Signal colour | 0 rising, 1 falling, 2 unchanged | all |
| 22 | Wave (TOTAL AGGRESSION) | aggression accumulated since the start of the day | all |
| 23 | Alert 1 — wave crosses signal line | +1 up, -1 down | all |
| 24 | Alert 2 — wave crosses zero | +1 up, -1 down | all |
| 25 | Alert 3 — wave changes colour | +1 to green, -1 to red | with the wave |
| 26 | Alert 4 — signal line crosses zero | +1 up, -1 down | all |
| 27 | Alert 5 — signal line changes colour | +1 to rising, -1 to falling | all |
| 28 | Alert 6 — delta crosses zero | +1 up, -1 down | with delta |
| 29 | Alert 7 — delta beyond the defined level | +1 above, -1 below | with delta |
In a mode that does not draw a series, its buffers hold 0 . Buffer 22 always holds the wave and is the one to read from an Expert Advisor. The other buffers (0-2, 5-7, 9-12, 14-17 and 19) are for internal use (drawing of the columns).
Alert buffers. Buffers 23-29 are filled even when the alerts are off, on the closed candle (shift 1), at the first tick of the new candle; otherwise they hold 0 . They are written only for candles that close while the indicator is running: read shift 1 on the first tick of a new candle, and do not use them for the history. To evaluate past candles, use buffers 20, 21 and 22 with the rules of section 7.2.
Loading. The Market versions are installed in MQL5\Indicators\Market\ ; check the exact file name in the Navigator. With no parameters after the name the default inputs are used. To change inputs, pass them in the order of section 8. Every input group heading is a parameter too: pass an empty string "" in its place, otherwise every following value shifts. Inputs left out at the end keep their defaults. Volume Type is passed as 0 (tick) or 1 (real); the lists in the order shown in section 8 starting at 0 (for example Start Calculation PRO: 0 CURRENT_DAY … 9 ALL_AVAILABLE_DAYS; Information to Plot: 0 PLOT_ALL … 7 PLOT_BUY_SELL_DELTA_AGGRESSION); Method as 0 SMA, 1 EMA, 2 SMMA, 3 LWMA; alert modes as 0 (NONE) to 7 (POP_SOUND_NOTIFICATION) and sounds as 0 (alert) to 12 (wait).
```mql5 // every input group is one "" parameter int h = iCustom(_Symbol, PERIOD_M5, "Market\Aggression Wave PRO", "", 1, // VOLUME CONFIGURATION: Real volume "", 0, 0, // CALCULATIONS CONFIGURATION: CURRENT_DAY, PLOT_ALL "", 1, 8, true);// SIGNAL CONFIGURATION: EMA, 8, reset every day if (h == INVALID_HANDLE) return(INIT_FAILED);
double wave[1], sig[1], cross[1]; if (BarsCalculated(h) > 0) { if (CopyBuffer(h, 22, 1, 1, wave) == 1 && CopyBuffer(h, 20, 1, 1, sig) == 1) Print("wave ", wave[0], " signal ", sig[0]); if (CopyBuffer(h, 23, 1, 1, cross) == 1 && cross[0] != 0.0) Print("wave crossed the signal line ", (int)cross[0]); // +1 / -1 } ```
Free version: iCustom(_Symbol, PERIOD_M5, "Market\\Aggression Wave RSJ", "", 1, "", 0) (Real volume, LAST_TWODAYS), then buffers 7 (wave) and 5 (signal).
Notes: an indicator created by iCustom sends its own alerts when their modes are not NONE — keep them off in the EA call. Wait until BarsCalculated(h) > 0 before the first read: the first load of the trades can take a while (section 2). On a symbol without trades the handle is valid but the indicator never calculates.
10. Strategy Tester
Both versions can be used in the Strategy Tester (visual and non-visual mode), also from an Expert Advisor through iCustom . The tester does not always provide the same data as the live market, so the values are produced in three ways:
| Situation in the tester | How the delta of each candle is obtained |
|---|---|
| Real trade ticks with buy / sell side (B3 or CME symbol, mode Every tick based on real ticks) | as live (section 4.1) |
| Trade ticks without side (for example ticks generated by the tester in Every tick mode) | the side of each trade is estimated from the price movement |
| No trade ticks at all on that day: forex, CFDs, continuous series such as WIN$N, days whose real ticks the tester replaced by generated ones | bid mode: the delta is estimated from the changes of the Bid price, counted like the tick volume of the bar |
| Bars between Start Calculation and the test start (the tester provides no ticks before the start date) | estimated: these bars receive an approximate delta based on the bar itself, so that the history is not empty |
The wave and the signal line are then built from these deltas as described in sections 4.3 and 5, restarting every day.
What this means in practice:
- The closest results to the live indicator come from Every tick based on real ticks on a symbol and period with real trades. Check in the tester journal that the real ticks were used for the days you test.
- 1 minute OHLC and Open prices only produce very few ticks per bar: the values are coarse and are not recommended for this indicator.
- In bid mode and on estimated bars the values are an approximation built from price movement, not the aggression of real trades. Their scale is also different (counts of price changes instead of contracts).
- On forex or CFDs the tester shows values (bid mode), but live on the same symbol the indicator shows nothing, because there are no trades. Do not take a tester result on forex as what you will see on a live chart.
- Start Calculation is counted back from the test start date. With the PRO default CURRENT_DAY the calculation starts on the first test day, and every following day of the test is calculated as it is reached.
- The volume check of section 4.5 is off in the tester.
- Pop-ups, sounds and notifications are not sent; buffers 23-29 (PRO) are filled bar by bar during the test.
11. Free vs PRO
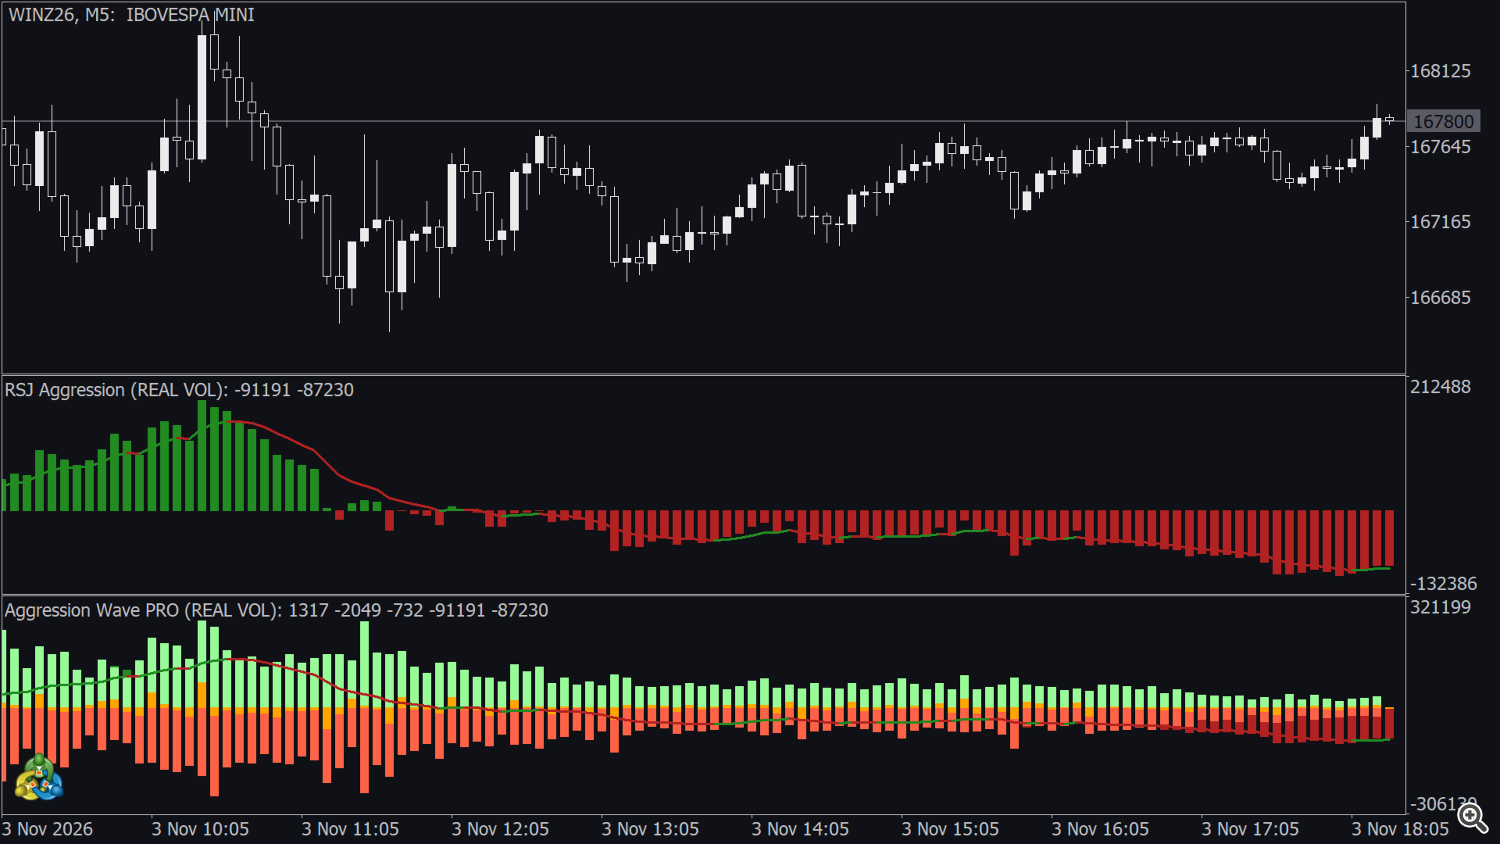
| Aggression Wave RSJ (free) | Aggression Wave PRO | |
|---|---|---|
| Daily aggression wave from real trades | yes | yes |
| Volume type: real volume or number of trades | yes | yes |
| Start Calculation options | 4 (default LAST_TWODAYS) | 10 (default CURRENT_DAY) |
| Signal line | fixed, restarted every day | method, period and daily restart configurable |
| Buy, sell and delta per candle | — | yes, 8 viewing modes |
| Alerts (pop-up, sound, push) | — | 7 |
| Buffers for Expert Advisors | 8 (wave, signal, colours) | 30, including buy, sell, delta and 7 alert buffers |
| Strategy Tester | yes | yes |
The free version is a good way to check that your broker delivers the trades with their side and to learn how the wave reads on your symbol. Move to PRO when you want to see the buy, sell and delta of each candle next to the wave, tune the signal line, receive alerts or use the values in an Expert Advisor. For the delta of each candle with absorption (reverse bars) and a range channel, see the Delta Aggression Volume family by the same author.
12. Tips
- Timeframe: M1 to M15 are the usual timeframes for B3 mini contracts (WIN, WDO); the wave of the day is the same on every timeframe, only the number of columns changes.
- Load time: keep CURRENT_DAY (PRO) or LAST_TWODAYS (free) for intraday work; use longer starts only to study past sessions.
- Contracts or trades:Real volume shows where the size is; Tick volume (number of trades) shows how many participants attacked. Two copies of the indicator with the two settings help to spot large players.
- Cleaner window:PLOT_WAVE_AGGRESSION shows only the wave and its signal; open a second copy with PLOT_BUY_SELL_DELTA_AGGRESSION to see the per-candle detail in its own scale.
- Dark background: change the third colour of WAVE SIGNAL (black by default) so that flat segments of the line stay visible.
- New session: the signal line restarts on its own at each new day, also when the chart stayed open overnight (section 5).
- Fewer alerts: the wave crosses (alerts 1 and 2) and the signal crosses (alert 4) are the least frequent events; DELTA Cross Defined Level is the most frequent.
13. Questions and troubleshooting
- The window is empty. The symbol has no trade ticks with buy / sell side (forex, CFD, crypto, quotes-only feed — section 1), or the tick history is still being downloaded. Check Time & Sales of the symbol and wait for the first load. With CURRENT_DAY in the first candle of the session the window starts drawing as soon as the first trades arrive.
- Does it work on forex? No, not on a live chart: forex feeds have no trades. In the Strategy Tester it shows approximate values (section 10), which do not represent live behaviour.
- Why does the wave drop to zero every day? It is the aggression accumulated in the current day; it restarts at midnight of the server time (section 4.3).
- The signal line is flat on zero on the previous days. This was fixed in Aggression Wave RSJ 6.20 and Aggression Wave PRO 2.20: the line now restarts correctly on every day shown (section 5). Update the indicator if you still see it. For a continuous line across days, set Reset Every New Day? = false (PRO).
- Does it repaint? The candle that is forming changes with each trade, and the wave of that candle with it. Closed candles are not changed afterwards (the last closed candle can be corrected once if its total did not match the broker volume).
- Does it predict where price will go? No. It shows who was more aggressive in the trades already done.
- Why are the values different from another order-flow tool? Feeds and tools classify some trades differently (for example auction trades or trades without a clear side). The totals can therefore differ slightly.
- An alert never fires (PRO). Check that its mode is not NONE and that the viewing mode draws the series it reads (section 7.2).
- Renko or other custom charts. A custom symbol has trades only if the tool that builds it also creates trade ticks with their side; otherwise the indicator does not calculate on it.
- Strategy Tester. Supported, with the data limits described in section 10.
Support: send a private message on MQL5 to the author.




