Risk-Reward Ratio in Forex Trading: How to Calculate It, Improve Win Rate, and Manage Risk

Ri
sk-Reward Ratio in Forex Trading:
How to Calculate It, Improve Win Rate, and Manage Risk
Understanding the risk-reward ratio in forex trading is essential for traders who want to protect their capital and build a consistent trading strategy. Whether you are scalping, day trading, or holding positions for several days, knowing how much you risk compared with your potential profit helps you make more disciplined trading decisions.
However, a favorable risk-to-reward ratio does not automatically make a trade profitable. Your win rate, stop-loss placement, take-profit target, position sizing, and trading costs all influence the final result.
In this guide, we will explain how the risk-reward ratio works, how to calculate it, which ratios traders commonly use, and how to apply it to a practical trade management plan.
What Is the Risk-Reward Ratio in Trading?
The risk-reward ratio (R) compares the amount you are willing to risk on a trade with the potential profit you expect to make if the trade reaches its target.
For example, if your stop loss represents a potential loss of $100 and your take-profit target offers a potential profit of $200, your trade has a 1:2 risk-to-reward ratio. You are risking one unit to potentially make two units.
Traders use this ratio to evaluate whether a trade setup offers enough potential reward relative to its downside risk.
Why Is the Risk-to-Reward Ratio Important?
A structured risk-reward plan can help traders:
-
Define acceptable risk before entering a position.
-
Compare different trade setups objectively.
-
Set realistic stop-loss and take-profit levels.
-
Maintain consistent trade management.
-
Evaluate strategy performance alongside win rate.
-
Avoid entering trades with limited profit potential.
The key is to assess the ratio before placing the trade rather than adjusting targets impulsively after the position is open.
How to Calculate the Risk-Reward Ratio
Calculating the risk-reward ratio requires three price levels: entry price, stop loss, and take profit.
The basic formula is:
Risk-Reward Ratio = Potential Loss : Potential Profit
To calculate the two components, measure the distance between your entry and stop loss, then compare it with the distance between your entry and take-profit target.
Example: Calculating Risk-Reward in Forex
Suppose you buy EUR/USD at 1.0850 with the following trade plan:
-
Entry price: 1.0850
-
Stop loss: 1.0820
-
Take profit: 1.0910
Your stop-loss distance is 30 pips, while your take-profit distance is 60 pips.
The calculation is:
-
Potential risk: 30 pips
-
Potential reward: 60 pips
-
Risk-reward ratio: 30:60, or 1:2
If the trade reaches your target, the planned profit is twice the planned loss, before trading costs and execution differences.
The same calculation can be applied to short positions, indices, commodities, and other markets. Just ensure that both distances are measured consistently.
What Does 1:1, 1:2, or 1:3 Risk-Reward Mean?
| Risk-Reward Ratio | Potential Risk | Potential Reward | Approximate Break-Even Win Rate |
|---|---|---|---|
| 1:1 | $100 | $100 | 50% |
| 1:2 | $100 | $200 | 33.3% |
| 1:3 | $100 | $300 | 25% |
These break-even win rates assume that every winning trade reaches the full target, every losing trade loses the planned amount, and trading costs are excluded. Actual performance may differ.
What Is a Good Risk-Reward Ratio in Forex?
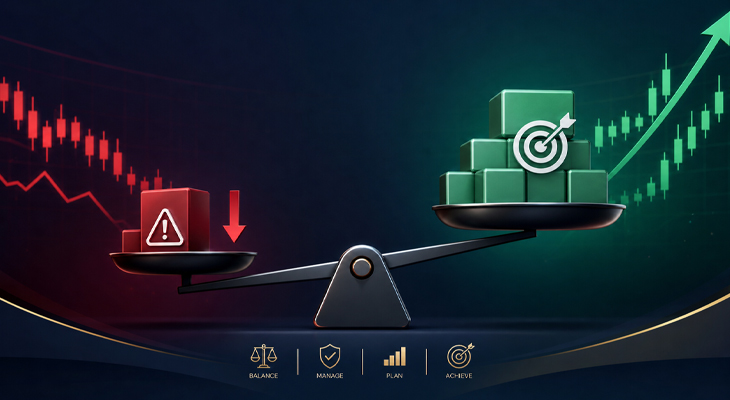
There is no single best risk-reward ratio for every trader. The right ratio depends on your trading style, strategy, market conditions, and historical performance.
Is a 1:2 Risk-Reward Ratio Good?
A 1:2 ratio is commonly used because the potential reward is twice the planned risk. In theory, a strategy with this ratio can break even with a win rate of approximately 33.3%, before costs.
For example, a trader risking $50 per position to target $100 does not need to win every other trade to break even. However, the strategy must actually achieve its targets often enough to cover losses and trading expenses.
When Can a 1:3 Risk-Reward Ratio Work?
A 1:3 ratio targets three units of profit for every unit of risk. Its theoretical break-even win rate is 25%, before costs.
This can suit strategies that capture strong trends or larger market moves. The challenge is that distant targets may be reached less frequently. Forcing a 1:3 ratio onto a setup with nearby resistance or weak momentum can reduce the probability of success.
The best ratio is the one supported by your strategy's tested results—not simply the highest number on your chart.
Risk-Reward Ratio vs. Win Rate: What Matters More?
Risk-reward ratio and win rate must be evaluated together. A high win rate does not guarantee profitability, and a low win rate does not necessarily mean a strategy is losing.
Consider two hypothetical trading systems:
-
Strategy A wins 60% of trades and averages one unit of profit for each unit risked.
-
Strategy B wins 40% of trades and averages two units of profit for each unit risked.
Before costs, both have an expected result of 0.2R per trade, assuming losses average exactly 1R.
Here, R represents one unit of planned risk. If 1R equals $100, a result of +2R means a $200 gain, while -1R means a $100 loss.
Understanding Trading Expectancy
Trading expectancy estimates the average result per trade over a series of trades.
Expectancy = (Win Rate × Average Win) − (Loss Rate × Average Loss)
For example, if your strategy wins 40% of trades with an average profit of 2R and loses 60% with an average loss of 1R:
Expectancy = (0.40 × 2R) − (0.60 × 1R) = +0.20R
This is a positive theoretical expectancy before costs. Your actual results can still vary, and a positive expectancy does not guarantee profits in every session or month.
How to Use Stop Loss, Take Profit, and Position Sizing Together
A risk-reward ratio works best as part of a complete trade management plan.
Place the Stop Loss Based on Market Structure
Avoid choosing a stop-loss level solely to achieve a preferred ratio. Instead, consider where the trading setup becomes invalid.
Depending on your strategy, this may involve a recent swing high or low, a support or resistance zone, volatility, or another predefined technical level.
If the logical stop is too wide for your account's risk limit, reduce the position size or skip the trade.
Set a Realistic Take-Profit Target
Take-profit levels should reflect the market's structure and the potential for price to reach the target. Relevant considerations include support and resistance, trend strength, volatility, and nearby liquidity zones.
A distant target may improve the theoretical ratio but reduce the probability of a successful exit. Focus on realistic price objectives rather than an attractive ratio alone.
Calculate Position Size Before Entry
Position sizing determines how much money you stand to lose if the stop loss is triggered.
For example, if your account balance is $10,000 and you choose to risk 1% per trade, your planned monetary risk is $100. The position size should then be calculated using the stop-loss distance and the instrument's value per pip or point.
A wider stop generally requires a smaller position to maintain the same monetary risk.
Remember that gaps, slippage, and execution conditions can cause the actual loss to exceed the planned amount.
Common Risk-Reward Mistakes Traders Should Avoid
Even a sound trading strategy can suffer when trade management becomes inconsistent.
Chasing a Higher Ratio
Moving the take-profit target farther away just to turn a 1:1 setup into a 1:3 trade can create unrealistic expectations. Let market structure determine the target.
Ignoring Spread and Commission
Trading costs affect net profitability, especially for scalpers and strategies with small targets. Evaluate results after spread, commission, and slippage whenever possible.
Moving the Stop Loss Emotionally
Widening a stop loss to avoid accepting a loss can undermine the original risk plan. Define the conditions for managing a position before entering the market.
Judging a Strategy After Only a Few Trades
A small sample may not represent the strategy's true performance. Record entry, stop loss, target, outcome, costs, and realized R across a meaningful sample of trades before drawing conclusions.

How to Improve Trade Management With Technical Analysis
Technical indicators can help traders evaluate momentum, trend conditions, and potential reversal areas. They should support a trading plan rather than replace risk management.
For example, divergence occurs when price movement and an oscillator move in different directions. Some traders use bullish or bearish divergence as a warning that momentum may be weakening. However, divergence is not a guaranteed reversal signal and should be assessed alongside market structure and confirmation.
A disciplined workflow is to identify a potential setup, define the invalidation level, select a realistic target, calculate position size, and then assess whether the resulting risk-reward ratio justifies the trade.
Final Thoughts: Build a Consistent Risk Management Plan
The risk-reward ratio in forex trading is a practical tool for evaluating potential trades, but it is only one part of a complete trading system. Your win rate, average win, average loss, trading costs, and position sizing all contribute to long-term performance.
Instead of chasing the highest ratio, focus on repeatable setups, realistic targets, controlled risk, and accurate trade records. Consistent execution and objective review can help you understand whether your strategy has a genuine statistical edge.

Enhance Divergence Analysis With TW Multi Divergence MT4
TW Multi Divergence MT4 is a MetaTrader 4 indicator designed to help traders identify potential bullish and bearish divergences using six oscillators: RSI, CCI, MACD, OBV, Stochastic, and Awesome Oscillator (AO).
It offers multi-oscillator divergence analysis, configurable display filters, divergence slope information, and multi-timeframe and multi-currency analysis features. Traders can use these tools to investigate potential momentum shifts and evaluate setups as part of their broader trade management process.
As with any technical indicator, signals require independent confirmation and disciplined risk management. The tool does not guarantee profitable trades or replace a tested trading strategy.