

Order Block Confluence Pro – User Manual (4 parts)
- Getting Started
- Controls & Quality Score
- Input Reference (this part)
- Alerts & FAQ
Input Reference
This section documents every input in the indicator’s Inputs dialog, grouped in the same order in which they appear.
Inputs under the Alerts group are covered separately in Alerts Reference, since alert configuration and behavior require a more detailed explanation than a brief input description.
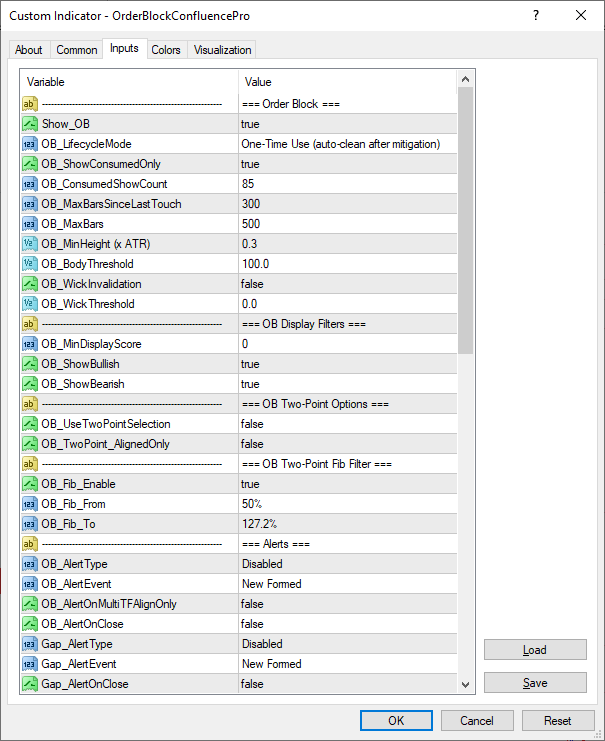
The Inputs dialog, Order Block through Alerts
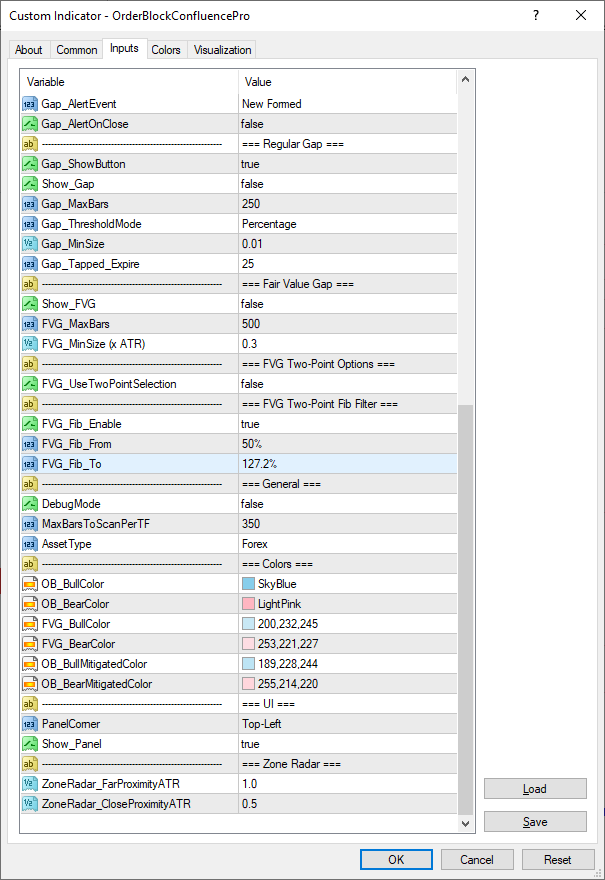
The Inputs dialog, continued: Regular Gap through Zone Radar.
Order Block
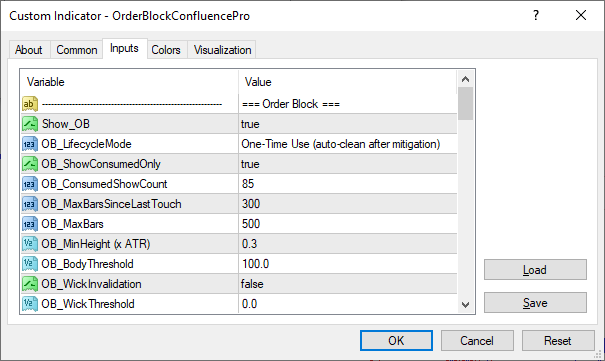
The Order Block input group in the Inputs dialog.
Show_OB
Default: true
Sets the initial state of the Order Block Show/Hide checkbox the first time the indicator is attached to a chart. To hide Order Blocks, it is far easier to toggle the OB checkbox in the top-right on-chart controls than to set Show_OB to false. See On-Chart Controls.
By default, the indicator detects and displays Order Blocks.
Note: Even if Show_OB is set to false, this input does not override deliberate on-chart edits. Once the OB checkbox has been clicked on a chart, the live state is remembered for that chart window and always takes priority. To actually change OB visibility, use the on-chart checkbox, not this input.
OB_LifecycleMode
One-Time Use / Persistent — Default: One-Time Use
Controls how an Order Block is concluded after it has been Tapped or Mitigated.
One-Time Use:
Concludes an Order Block when it is invalidated according to OB_BodyThreshold and OB_WickInvalidation, or when any of the following termination conditions occur:
- BOS reversal — price closes beyond a swing in the OB’s direction. For example, after a bullish OB has been mitigated, price may bounce and create a swing high above the bullish OB. If price subsequently closes above that swing high, the break of structure confirms that the zone has completed its role and the OB is concluded.
- Adaptive-ATR price departure — price moves sufficiently far away from the zone, based on the timeframe’s adaptive ATR. The default departure threshold is 2.5 × ATR.
- Formation of a newer Order Block — a newer qualifying OB concludes the previous one.
- Dormancy — a Tapped or Mitigated Order Block that remains untouched for the configured number of bars becomes dormant. With the default OB_MaxBarsSinceLastTouch value of 300, the zone becomes dormant after 300 bars without further interaction. Fresh OBs never become dormant.
Why ATR-based departure, not a fixed distance?
Using live ATR instead of a fixed pip or point value is a deliberate design choice: it allows the departure threshold to scale naturally with each timeframe’s volatility. ATR period also adapts by timeframe tier:
| Timeframe | ATR Period |
| ≤ M5 | 20 |
| ≤ M30 | 16 |
| ≤ H4 | 14 |
| > H4 (D1, W1, MN) | 10 |
Lower timeframes use longer ATR periods to smooth short-term noise, while higher timeframes use shorter periods because each bar already represents a larger market move.
When an Order Block concludes in One-Time Use mode, it is archived in the Consumed store and can later be reviewed in Consumed Only mode.
Persistent:
After an Order Block has been touched, it remains active through unlimited retouches until it is invalidated or becomes dormant.
Dormant Order Blocks are silently discarded and are not archived in the Consumed store.
Order Block Invalidation
The invalidation rule applies in both One-Time Use and Persistent modes.
By default, an Order Block is invalidated when a candle body closes beyond the opposite side of the zone.
Wick penetration does not invalidate an Order Block unless OB_WickInvalidation is enabled.
OB_ShowConsumedOnly
Default: false
Switches the chart into Consumed Only mode, showing archived Order Blocks that have already concluded.
Concluded OBs appear as dashed-line rectangles with no fill, using the same bullish/bearish colors as active OBs.
The normal Selection & Analysis controls and hover tooltips are replaced by the Recently Consumed OB panel. By default, the panel shows the most recent concluded OB.
Hovering over another consumed Order Block updates the panel to display information for that OB. When you’re not hovering over anything, the panel falls back to showing the most recently concluded record.
The panel displays:
- First line — OB type: Bullish OB (Consumed) or Bearish OB (Consumed)
- Second line — OB size (height) and formation time — for example: 85.6 Pips | Formed: 2026.08.14 09:00
- Third line — conclusion time — for example: Concluded: 2026.08.21 18:30
- Fourth line — the reason it concluded: Invalidated, Post-Reaction BOS, Distance, New OB Formed, or Dormancy
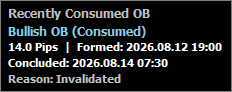
Reason: Invalidated.
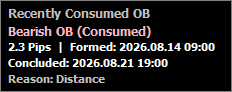
Reason: Distance.
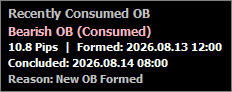
Reason: New OB Formed.
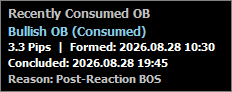
Reason: Post-Reaction BOS.
OB_ConsumedShowCount
Default: 3
Controls how many recently concluded OBs are displayed simultaneously in Consumed Only mode.
This setting affects display only. Up to 100 concluded records are retained internally regardless of this value.
OB_ExportConsumedLog
Default: false
Exports the full Consumed OB history to a plain text file. Set this input to true and click OK to trigger the export — the same action can also be triggered from the chart via the Export Log button, which appears in place of the Select Range, Clear Range, Track Zone, and Quality Score buttons while OB_ShowConsumedOnly is enabled.
The file is written to the terminal’s MQL4\Files folder as OrderBlockConfluencePro_ConsumedLog_<Symbol>_<Period>.txt, with one line per archived record — direction, size, formation time, conclusion time, and reason — newest first. Every currently archived record is written, up to the full 100-record retention cap, independent of the OB_ConsumedShowCount display setting.
Each export overwrites the file from the previous export on that symbol and timeframe — it is a fresh snapshot each time, not an append-only running log.
OB_MaxBarsSinceLastTouch
Default: 300
Sets how many bars an OB may remain untouched after being tapped/mitigated before becoming dormant. Dormancy applies only to OBs touched at least once.
OB_MaxBars
Default: 500
Sets how many bars back the Order Block scanner searches on each timeframe.
OB_MinSizeATR
Default: 0.30
Sets the minimum OB size (height) required for creation, expressed as a multiple of ATR.
Example:
- If ATR on EURUSD-H1 is 0.0022 → minimum OB size = 0.00066 (6.6 pips).
- On XAUUSD-H4, ATR = 34.2636 → minimum OB size = 10.27908 ($10.28).
This is a detection filter. OBs below this threshold are not created and cannot be scored.
OB_BodyThreshold
Default: 100.0
Sets the percentage of body-close penetration required to invalidate an OB.
At the default value of 100%, a candle must close completely beyond the zone from the opposite side before the Order Block is invalidated by the body-close rule.
OB_WickInvalidation
Default: false
Enables wick-based invalidation.
By default, wick penetration does not invalidate an Order Block.
OB_WickThreshold
Default: 0.0
Sets wick penetration percentage required to invalidate an OB when OB_WickInvalidation is set to true.
For example, if OB_WickInvalidation is set to true and OB_WickThreshold is set to 60%, an Order Block is invalidated when a candle’s wick penetrates 60% of the zone.
OB Display Filters
OB_MinDisplayScore
Default: 0
Hides Order Blocks whose Quality Score falls below the specified value.
At the default value of 0, no Order Blocks are filtered by Quality Score.
For example, setting this to 70 displays only Order Blocks with a Quality Score of 70 or higher.
See OB Quality Score System for details of how the score is calculated.
OB_ShowBullish
Default: true
Sets which Order Block direction is shown by default. If this option is set to false, only Bearish Order Blocks are shown.
This is not only a one-time starting value. Editing this input in the Properties dialog and clicking OK takes effect immediately, overriding whatever the OB Bull toggle on Zone Radar was previously set to for that symbol and timeframe.
The on-panel OB Bull toggle then continues to control the live state from there. Clicking it changes the display immediately without reopening Properties, and the selected state is remembered per symbol and timeframe for next time.
See Zone Radar and Order Block Direction Filters.
OB_ShowBearish
Default: true
Sets which Order Block direction is shown by default. If this option is set to false, only Bullish Order Blocks are shown.
It behaves the same way as OB_ShowBullish above. Editing this input in the Properties dialog and clicking OK takes effect immediately, overriding whatever the OB Bear toggle was previously set to for that symbol and timeframe.
The on-panel OB Bear toggle then continues to control the live state, and the selected state is remembered per symbol and timeframe for next time.
Both OB_ShowBullish and OB_ShowBearish must be set to true if you want both bullish and bearish Order Blocks to be shown by default.
OB Two-Point Options
OB_UseTwoPointSelection
Default: false
Sets the initial state of Two-Point Selection Mode for Order Blocks when the indicator is attached to a chart.
For easy access to Order Block Two-Point Selection Mode, you can use the Select Range and Clear Range buttons in the top-left of the chart, so you do not need to change this input to use the feature.
The two buttons control the live state after the indicator is attached to a chart. See On-Chart Controls.
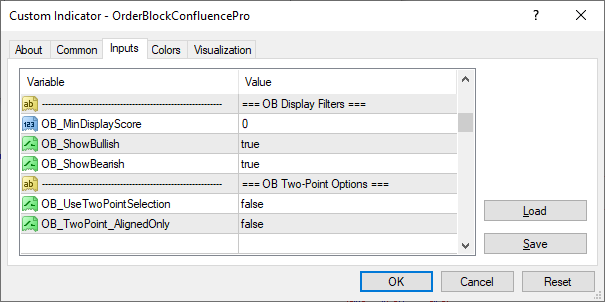
The OB Two-Point Options group: OB_UseTwoPointSelection and OB_TwoPoint_AlignedOnly.
OB_TwoPoint_AlignedOnly
Default: false
When Two-Point Selection Mode is active, restricts the display to Order Blocks that have at least one higher-timeframe alignment.
When disabled, all Order Blocks inside the selected range are displayed, regardless of whether they are aligned. Alignment labels appear only on zones that are actually aligned.
This input has no effect outside Two-Point Selection Mode.
OB Two-Point Fib Filter
OB_Fib_Enable
Default: true
Enables or disables the Fibonacci filter used within OB Two-Point Selection Mode.
When enabled, the indicator applies the Fibonacci filter to the selected range and, by default, displays only Order Blocks that fall between the 50% and 127.2% Fibonacci levels of the measured swing.
See Fibonacci Filter Inside Two-Point Selection in On-Chart Controls.
OB_Fib_From
Fibonacci level — Default: 50%
Sets the near boundary of the Fibonacci filter range.
At the default value of 50%, Order Blocks below the 50% Fibonacci level are not displayed while Two-Point Selection Mode is active.
OB_Fib_To
Fibonacci level — Default: 127.2%
Sets the far boundary of the Fibonacci filter range.
At the default value of 127.2%, Order Blocks above the 127.2% Fibonacci level are not displayed while Two-Point Selection Mode is active.
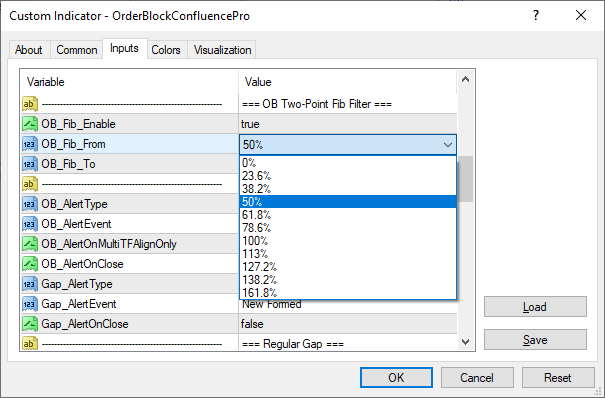
OB_Fib_From — Fibonacci level options.
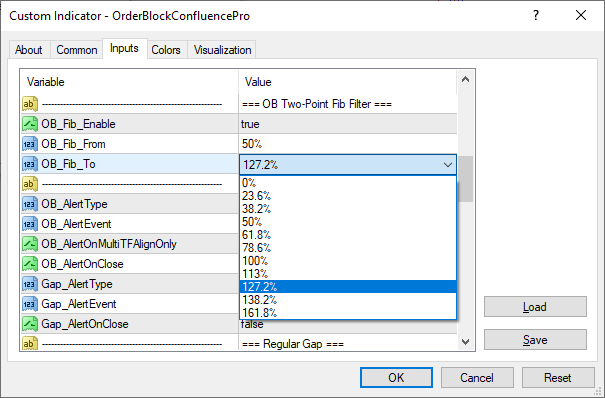
OB_Fib_To — the same Fibonacci level options.
Regular Gap
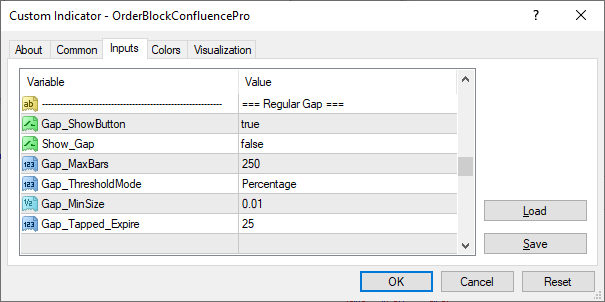
The Regular Gap input group in the Inputs dialog.
Gap_ShowButton
Default: true
Controls whether the Gaps checkbox appears in the Show/Hide toggle stack on the top right of the chart. See Show/Hide Toggles in Interface Overview.
When set to false, the Gaps control is removed from the on-chart interface.
Show_Gap
Default: false
Sets the Gaps checkbox’s starting state the very first time the indicator is attached to a chart. As with Show_OB above, this input has no effect on a chart where the checkbox has already been clicked — the live, on-chart state always takes priority from then on, even over a later edit to this input. Using the on-chart Gap toggle is much more convenient to show or hide Gaps on charts. In practice, you do not need to use this input.
Gaps and FVGs are mutually exclusive. Enabling one automatically disables the other. See Show/Hide Toggles.
Gap_MaxBars
Default: 250
Sets how many bars back the Regular Gap scanner searches.
Gap_ThresholdMode
None / Percentage / Pips — Default: Percentage
Determines how the indicator interprets Gap_MinSize:
- None — no minimum gap-size filter. All gap sizes, even tiny ones, are shown.
- Percentage — minimum size is measured as a percentage of price
- Pips — minimum size is specified as a fixed pip value
Gap_MinSize
Default: 0.01
Sets the minimum gap size required for a Regular Gap to be detected.
The meaning of this value depends on Gap_ThresholdMode.
With the default Percentage mode, a value of 0.01 means 1% of price. This default helps filter out very small gaps that may add unnecessary chart clutter.
For example, if the price of TSLA_CFD, H1 is $345.37, a 1% threshold corresponds to:
- $345.37 × 0.01 = $3.4537
Therefore, any Regular Gap smaller than approximately $3.45 is filtered out.
Gap_Tapped_Expire
Default: 25
Sets how many bars a Regular Gap may remain on the chart after becoming Tapped if it has not progressed to Filled.
Set to 0 to disable this expiry.
Fair Value Gap
Show_FVG
Default: false
Sets the FVG checkbox’s starting state the very first time the indicator is attached to a chart. Behaves the same way as Show_OB and Show_Gap above — once the checkbox has been clicked on a chart, its live state always takes priority over this input from then on. To actually change FVG visibility, use the on-chart checkbox itself, not this input. See Show/Hide Toggles in On-Chart Controls.
FVG_MaxBars
Default: 500
Sets how many bars back the Fair Value Gap scanner searches.
FVG_MinSizeATR
Default: 0.30
Sets the minimum Fair Value Gap size required for a gap to be created, expressed as a multiple of ATR. The default setting filters out very small FVGs. These tiny gaps tend to produce weak Order Blocks.
Example:
- GBPUSD-H1 ATR = 0.0018 → minimum FVG = 0.00054 (5.4 pips).
- AMAZON_CFD-H1 ATR = 1.9821 → minimum FVG = $0.5946.
This is a detection filter, separate from the FVG Size component used in the OB Quality Score.
FVG Two-Point Options
FVG_UseTwoPointSelection
Default: false
Sets the initial state of Two-Point Selection Mode for Fair Value Gaps when the indicator is attached to a chart.
The FVG Select Range and Clear Range buttons provide convenient access to this feature, so you do not need to change this input to use Two-Point Selection Mode.
The FVG buttons appear only when FVG is enabled through the on-chart Show/Hide toggles. By default, only the OB Two-Point Selection buttons are displayed because FVG is disabled by default.
The FVG selection controls the live state after the indicator is attached to the chart.
This setting operates independently of the corresponding Order Block Two-Point Selection setting.
FVG Two-Point Fib Filter
FVG_Fib_Enable
Default: true
Enables or disables the Fibonacci filter used within FVG Two-Point Selection Mode.
When enabled, the indicator applies the Fibonacci filter to the selected range and, by default, displays only FVGs that fall between the 50% and 127.2% Fibonacci levels of the measured swing.
FVG_Fib_From
Fibonacci level — Default: 50%
Sets the near boundary of the Fibonacci filter range for FVG selections.
At the default value of 50%, FVGs below the 50% Fibonacci level are not displayed while Two-Point Selection Mode is active.
FVG_Fib_To
Fibonacci level — Default: 127.2%
Sets the far boundary of the Fibonacci filter range for FVG selections.
At the default value of 127.2%, FVGs above the 127.2% Fibonacci level are not displayed while Two-Point Selection Mode is active.
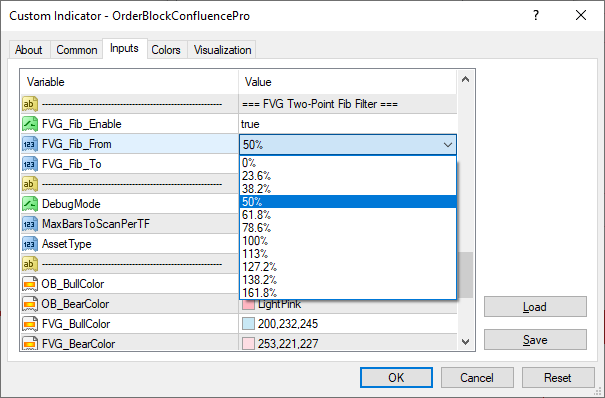
FVG_Fib_From — the same Fibonacci level options, for FVG selections.
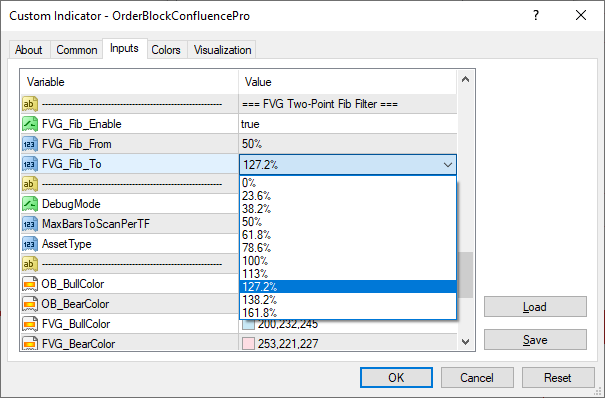
FVG_Fib_To — the same Fibonacci level options, for FVG selections.
General
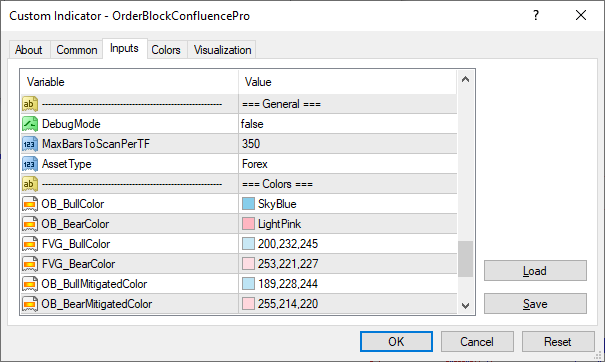
The General input group, transitioning into Colors.
DebugMode
Default: false
Enables detailed diagnostic logging in the MetaTrader Experts log while the indicator scans and updates.
This is intended primarily for troubleshooting. Leave it off during normal use.
MaxBarsToScanPerTF
Default: 350
Sets the scan depth used for higher-timeframe detection.
AssetType
Forex / Stocks_Commodities — Default: Forex
Tells the indicator how to distinguish ordinary market gaps from genuine Fair Value Gaps for the instrument being analyzed.
The default Forex setting is appropriate for:
- Forex
- Gold
- Silver
- Cryptocurrencies
- Indices
Select Stocks_Commodities only when using the indicator on a Stocks chart.
See Installation & Getting Started for a more detailed explanation of this setting.
Colors
The behavior of these color inputs is explained in detail in Color & Timeframe Legend.
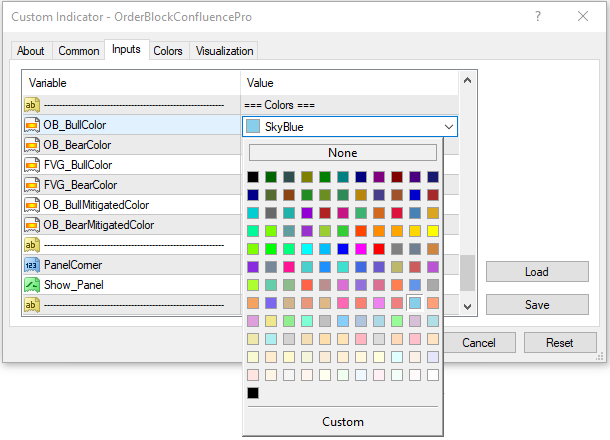
The color picker shown when editing any color input, such as OB_BullColor.
OB_BullColor
Default: Sky Blue
Sets the fill color for bullish Order Blocks.
This color is also used for Regular Gaps and for Fair Value Gaps when FVGs are enabled without Order Blocks.
OB_BearColor
Default: Light Pink
Sets the fill color for bearish Order Blocks.
This color is also used for bearish Regular Gaps and for Fair Value Gaps when FVGs are enabled without Order Blocks.
FVG_BullColor
Default: Pastel Blue
Sets the fill color for bullish Fair Value Gaps when Order Blocks are also enabled.
FVG_BearColor
Default: Pastel Pink
Sets the fill color for bearish Fair Value Gaps when Order Blocks are also enabled.
OB_BullMitigatedColor
Default: Pale Blue
Sets the paler fill color used by bullish Order Blocks after they become Mitigated, or while price is currently inside the zone.
OB_BearMitigatedColor
Default: Pale Pink
Sets the paler fill color used by bearish Order Blocks after they become Mitigated, or while price is currently inside the zone.
UI
PanelCorner
Default: Top-Left
Sets the initial corner of the chart where the dashboard panel is anchored. Once the panel is manually dragged, its saved position takes precedence.
Show_Panel
Default: true
Sets the initial state of the Dashboard Show/Hide toggle when the indicator is attached to a chart.
See The Dashboard Panel and Show/Hide Toggles.
Zone Radar
ZoneRadar_CloseProximityATR
Default: 0.5
Sets the maximum distance, measured in ATR multiples, for a Zone Radar row to be classified as Close.
At the default value, when the current price’s distance from the zone is ≤ 0.5 × ATR(14), the zone is classified as Close and its Distance is displayed in orange text.
Zone Radar always uses ATR(14) for proximity classification. The adaptive ATR periods described under OB_LifecycleMode are used specifically for the One-Time Use price-departure rule and do not apply to Zone Radar.
See Zone Radar Tab in Interface Overview for details.
ZoneRadar_FarProximityATR
Default: 1.0
Sets the ATR-based distance beyond which a Zone Radar row is classified as Far.
At the default value, when the current price’s distance from the zone is > 1.0 × ATR(14), the zone is classified as Far and its Distance is displayed in gray text.
Distances between the Close and Far thresholds are classified as Moderate:
- Close: ≤ 0.5 × ATR(14) — orange
- Moderate: > 0.5 × ATR(14) and ≤ 1.0 × ATR(14) — white
- Far: > 1.0 × ATR(14) — gray
See Zone Radar Tab in Interface Overview for details.
← Part 2 – Controls & Quality Score | Part 4 – Alerts & FAQ →