Order Block Confluence Pro – User Manual (4 parts)
- Getting Started (this part)
- Controls & Quality Score
- Input Reference
- Alerts & FAQ
Introduction
Order Block Confluence Pro is a professional charting tool for MetaTrader 4, designed for traders who use Order Blocks, Fair Value Gaps (FVGs), and multi-timeframe confluence to structure their market analysis.
The indicator evaluates and scores each Order Block using multiple quality factors, including multi-timeframe alignment, displacement strength, Order Block size, liquidity, and mitigation quality. You can filter Order Blocks based on their score, helping you quickly distinguish higher-quality zones from lower-conviction zones, reduce chart clutter, and focus your analysis on the areas that meet your criteria.
This manual explains how to install the indicator, configure its input settings, use the on-chart interface, understand the scoring system, and set up alerts. Whether you use a traditional one-time-use Order Block approach or prefer a persistence-based approach, the indicator provides the flexibility to match your analytical style.
Order Block Confluence Pro is designed to work across Forex, Cryptocurrencies, Gold, Indices, and Stocks, providing a consistent framework for evaluating Order Blocks and Fair Value Gaps across different markets and price scales.
Installation & Getting Started
1. Open your MetaTrader 4 data folder.
In MT4, go to File → Open Data Folder. This opens the directory where your platform files are stored.
2. Copy the indicator file to the correct folder.
Place the .ex4 file inside:
MQL4 → Indicators
3. Refresh the Navigator.
In the Navigator panel, right-click and select Refresh to load the newly installed indicator. Alternatively, you can restart MetaTrader 4.
4. Attach the indicator to your chart.
In the Navigator, expand Indicators, locate Order Block Confluence Pro, and drag it onto the chart you want to analyze, or double-click the indicator.
5. Set the correct AssetType.
In the Inputs dialog, configure AssetType according to the instrument you are analyzing.
- The default value, Forex, is correct for Forex, Gold, Silver, Cryptocurrencies, and Indices.
- Select Stocks_Commodities only when using the indicator on a stock chart.
This setting is important for accurate FVG detection. It allows the indicator to distinguish ordinary overnight or opening gaps from genuine Fair Value Gaps, helping prevent stock-market gaps from being incorrectly classified as institutional imbalances.
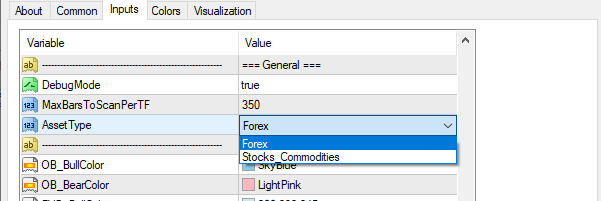
AssetType is found under the General section of the Inputs dialog.
6. Click OK to load the indicator.
The on-chart interface will appear, and any detected Order Blocks, FVGs, and confluence zones that meet the current settings will be displayed on the chart.
Interface Overview
Order Block Confluence Pro’s interface consists of three main components:
- a row of Show/Hide toggles in the top-right corner of the chart,
- rows of Selection & Analysis buttons in the top-left corner, and
- a draggable dashboard panel that displays detected zones and their confluence information.
The toggles and buttons remain fixed in their respective positions on the chart. The dashboard panel is the only movable element, and its position is automatically remembered.
The example below shows all three interface components together on an AUDUSD H4 chart. Both bearish Order Blocks (pink, upper half) and bullish Order Blocks (blue, lower half) are visible, providing a clear reference for how the two directions are visually distinguished.

AUDUSD, H4 — show/hide toggles (top-right), selection & analysis buttons (top-left), and the dashboard panel (Confluence Zones tab, lower-left).
- Show/Hide toggles (top-right) — show or hide each zone category and the dashboard.
- Selection & Analysis buttons (top-left) — select a price range, clear a selection, track a specific zone, and view its Quality Score.
- Dashboard panel — the draggable Confluence Zones / Zone Radar panel, covered in detail later in this section.
Four checkboxes appear in the top-right corner of the chart: FVG, OB, Dashboard, and Gaps.
- A checked box means that category is currently visible.
- Unchecking a box hides all zones of that type with a single click, without changing any other indicator settings.
The Dashboard toggle is a little different from the other three:
- It shows or hides the dashboard panel itself, rather than a category of zone.
- It shares the same underlying visibility state as the panel’s own close (×) button — checking or unchecking it stays in sync with ×, and either one hides the panel fully, even if it was minimized at the time.
- There is one real difference, though: closing the panel with × leaves a small floating [Panel] button on the chart as a way to reopen it. Unchecking Dashboard does not — since the checkbox itself is already visible and already serves as the way back, a redundant [Panel] button doesn’t appear on top of it.
The full behavior of each toggle is explained in On-Chart Controls.
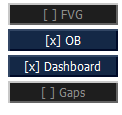
The show/hide toggles: [ ] FVG, [x] OB, [x] Dashboard, [ ] Gaps
Four buttons are available in the top-left corner of the chart: Select Range, Clear Range, Track Zone, and Quality Score.
These buttons operate on the zone type associated with their row — OB or FVG — and are displayed only when that zone type is enabled through the Show/Hide toggles.
Depending on your settings, you may see:
- an OB row,
- an FVG row, or
- both rows.
The Quality Score button is exclusive to Order Blocks. FVGs do not receive a Quality Score, so the FVG row contains only three buttons.
The full behavior of each button is covered in On-Chart Controls.

The OB row of selection & analysis buttons: Select Range, Clear Range, Track Zone, Quality Score

The FVG row of analysis buttons: Select Range, Clear Range, Track Zone. FVG has no Quality Score button
Cascading & Labeling for Overlapping Zones
Busy charts can contain several Order Blocks positioned close together, or Order Blocks from different timeframes that overlap in the same price area. Rather than allowing these zones to overlap and become difficult to read, the indicator automatically staggers overlapping same-direction zones horizontally and combines aligned timeframes into a single label.
For example, an H4-H1 label indicates that the chart-timeframe M30 Order Block aligns with Order Blocks from both H1 and H4. On the USDCAD M30 chart below, multiple bearish Order Blocks from H1, H4-H1, and D1-H1 are displayed in a staggered arrangement, allowing each zone to remain visually distinguishable even in a busy, one-directional market structure.
The complete color and labeling legend is explained later in this manual.

USDCAD, M30 — overlapping bearish Order Blocks staggered and labeled by aligned timeframe (H1, H4-H1, D1-H1)
The dashboard appears automatically as soon as you attach the indicator to a chart. You can move it anywhere by clicking and dragging its title bar. Its position is remembered per symbol, so each chart reopens with the panel exactly where you last placed it.
The dashboard contains two tabs:
- Confluence Zones — displays zones with multi-timeframe alignment.
- Zone Radar — monitors the nearest qualifying zones across multiple timeframes.
Additional dashboard controls include:
- Minimize (−) — collapses the panel to its title bar without closing it.
- Close (×) — hides the panel entirely. When closed, a small [Panel] button appears in the corner of the chart, allowing you to reopen the dashboard with one click.

EURAUD, H4 — the dashboard panel minimized to its title bar
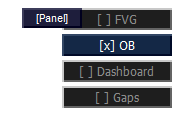
The [Panel] button appears in the top-right toggle stack once the dashboard has been closed with ×
Confluence Zones (CZ) is the dashboard’s primary view. It displays only zones that have earned multi-timeframe alignment — Order Blocks and Fair Value Gaps that align with structure on another, higher timeframe.
What you see here is the higher-conviction subset of the detected zones rather than a raw list of every zone on the chart.
Each row displays:
- the timeframe,
- the zone type,
- its size, and
- its current status: Fresh, Tapped, Mitigated, or Inside.
Size is shown in the unit natural to the instrument:
- pips for Forex,
- dollars for Gold and other dollar-quoted instruments, and
- points for Indices.
The two examples below show this clearly: bearish Order Blocks on a Forex pair (size in pips) and bullish Fair Value Gaps on Gold (size in dollars).
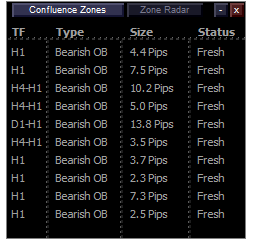
Confluence Zones — Bearish Order Blocks, Forex (Size in pips).
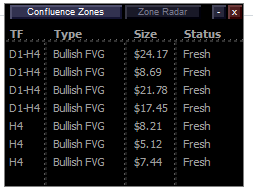
Confluence Zones — Bullish FVGs, Gold (Size in $)
.
FVG rows can also carry combined timeframe labels such as D1-H4 when the alignment spans multiple timeframes.
Each row is clickable. When you click a row, the indicator highlights the corresponding zone by displaying a flashing arrow on its associated candle for seven seconds. This makes it easy to locate the exact Order Block or Fair Value Gap associated with the selected row, even on busy charts.
Zone Radar (ZR) is the dashboard’s secondary view. In Order Block / FVG mode, it displays a fixed grid with one row for each timeframe from M1 to W1. Each row identifies the nearest qualifying Order Block or FVG above or below the current price, regardless of whether that zone has multi-timeframe alignment.
This makes Zone Radar useful for monitoring nearby zones across both higher and lower timeframes.
Each row displays:
- the timeframe,
- the nearest zone,
- its status, and
- its distance from the current price.
Distance is color-coded according to proximity relative to ATR(14):
| Condition | Distance color |
| Price inside zone | Gold |
| ≤ 0.5× ATR from zone | Orange |
| 0.5×–1.0× ATR from zone | White |
| > 1.0× ATR from zone | Gray |
If only Regular Gaps are enabled, with both OB and FVG disabled, Zone Radar switches to a compact gap-proximity list sorted from nearest to farthest from the current price.
Above the column headers are two direction filters:
- OB Bull
- OB Bear
These controls determine which Order Block direction is displayed on the chart itself — not just in the panel. Both toggles are ON by default.
For example, in an uptrend, if you want to monitor bullish Order Blocks only, click OB Bear: ON. The indicator hides bearish Order Blocks and changes the control to OB Bear: OFF, with the text displayed in red.
The same direction filters are available on the Confluence Zones tab, but they only appear there once a direction has actually been filtered out — either through the OB_ShowBullish / OB_ShowBearish input settings, or by clicking Bull/Bear here on Zone Radar, since both toggles share the same underlying state. The complete behavior of these settings is explained in the Input Reference section.
As with Size on the Confluence Zones tab, Distance uses the instrument’s natural unit:
- pips (p) for Forex,
- dollars ($) for Gold, and
- points (Pts) for Indices.
A row may display -- instead of a Nearest Zone and Distance value. This simply means that no qualifying Order Block or FVG exists on that timeframe; it does not indicate an error.
The three examples below show all of this: Forex, Gold, and an index (USINDX) where M1 and M5 have no qualifying Order Block.
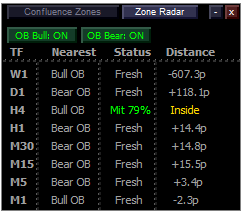
Zone Radar — Forex (Distance in pips).
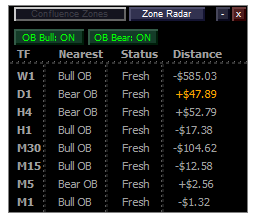
Zone Radar — Gold (Distance in $).
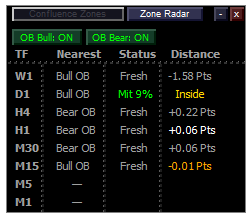
| Zone Radar — USINDX (Distance in Pts; M1/M5 blank — no qualifying OB). |
Tab Behavior: Defaults, Auto-Switch, and Per-Symbol Memory
The dashboard uses three related behaviors to determine which tab is displayed.
When the indicator is attached to a symbol for the first time, the dashboard opens on Confluence Zones.
If Confluence Zones has nothing to display because no zones currently have multi-timeframe alignment, the dashboard automatically switches to Zone Radar so that the panel remains useful rather than appearing empty.
As soon as a qualifying multi-timeframe alignment appears, the dashboard automatically switches back to Confluence Zones.
This automatic switching is temporary and does not overwrite your saved tab preference.
When you manually change the dashboard tab, your selection is remembered per symbol.
For example, if you manually switch to Zone Radar on EURUSD, EURUSD will reopen on Zone Radar the next time you attach the indicator, even after restarting MetaTrader 4.
A symbol that has never been used with the indicator always starts on Confluence Zones.
Automatic tab switching does not change this saved preference. Therefore, a temporary switch to Zone Radar caused by an empty Confluence Zones tab will not permanently change the tab that opens for that symbol.
Every zone drawn by the indicator uses a defined color scheme, with most colors customizable through the indicator inputs. This section explains what the colors represent when reading the chart, including the higher-timeframe border colors and combined labels used by Cascading & Labeling.
Order Block & Regular Gap Fills
Order Blocks and Regular Gaps use the following default fill colors:
- Bullish — sky blue
- Bearish — light pink
Regular Gaps use the same colors as Order Blocks; there are no separate color inputs for Regular Gaps.
The fill color changes when these zones are no longer fresh, but the trigger differs slightly between Order Blocks and Regular Gaps.
For Order Blocks:
- An OB retains its full-strength color only while it remains completely untouched (Fresh).
- The fill lightens to its paler shade the moment price first touches the zone at all — the same instant it becomes Tapped — and stays that paler shade from then on, including while price is currently inside it. It does not wait for the zone to reach the Mitigated status (over 5% penetration) shown in the tooltip.
For Regular Gaps:
- The fill color begins blending toward white as soon as the gap is Tapped or Filled.
- There is no separate input for Regular Gap colors.

MSFT CFD, H1 — Regular Gaps drawn in the same blue used for Bullish Order Blocks, since Gaps have no color input of their own.
FVGs have their own pastel blue and pink color inputs when Order Blocks are enabled.
If OB is disabled while FVG remains enabled, FVGs use the stronger Order Block colors instead. This keeps an FVG-only chart visually distinct and prevents the zones from appearing overly faded.
As a result, the same FVG may appear with a different fill color depending on whether the OB toggle is enabled. This is expected behavior and does not indicate an error.
Unlike Order Blocks and Regular Gaps, FVG fill colors do not change as the gap fills. The FVG retains its assigned color regardless of its current fill status.
To determine how much of the gap remains, refer to the Remaining Size value in the FVG tooltip.
Higher-Timeframe Border Colors
When an Order Block aligns with another timeframe, the indicator draws a border corresponding to each aligned timeframe. Each timeframe has a fixed border color:
- W1 — purple
- D1 — blue
- H4 — green
- H1 — goldenrod
- M30 — brown
- M15, M5, and M1 — red
M15, M5, and M1 share the same red border color.
Border thickness also varies by timeframe:
- W1 — thickest
- D1 and H4 — medium
- H1 through M1 — thin
This allows higher-timeframe alignment to remain visually apparent even when the combined label is not immediately readable: a thicker border indicates a higher timeframe.
When multiple timeframes align with the same Order Block, the indicator combines them into a single label.
For example, an H4-H1 label indicates that the chart-timeframe Order Block aligns with Order Blocks from both H1 and H4.
The combined label takes the color of the highest aligned timeframe. Therefore, an H4-H1 label appears in H4’s green, even though the H1 border beneath it remains goldenrod.
This allows the label to communicate the highest level of timeframe confluence while the individual border colors preserve the identity of each aligned timeframe.

WTICASH, H4 — a single W1 border (purple, thickest) around a Bearish Order Block, with D1 borders (blue) visible below.
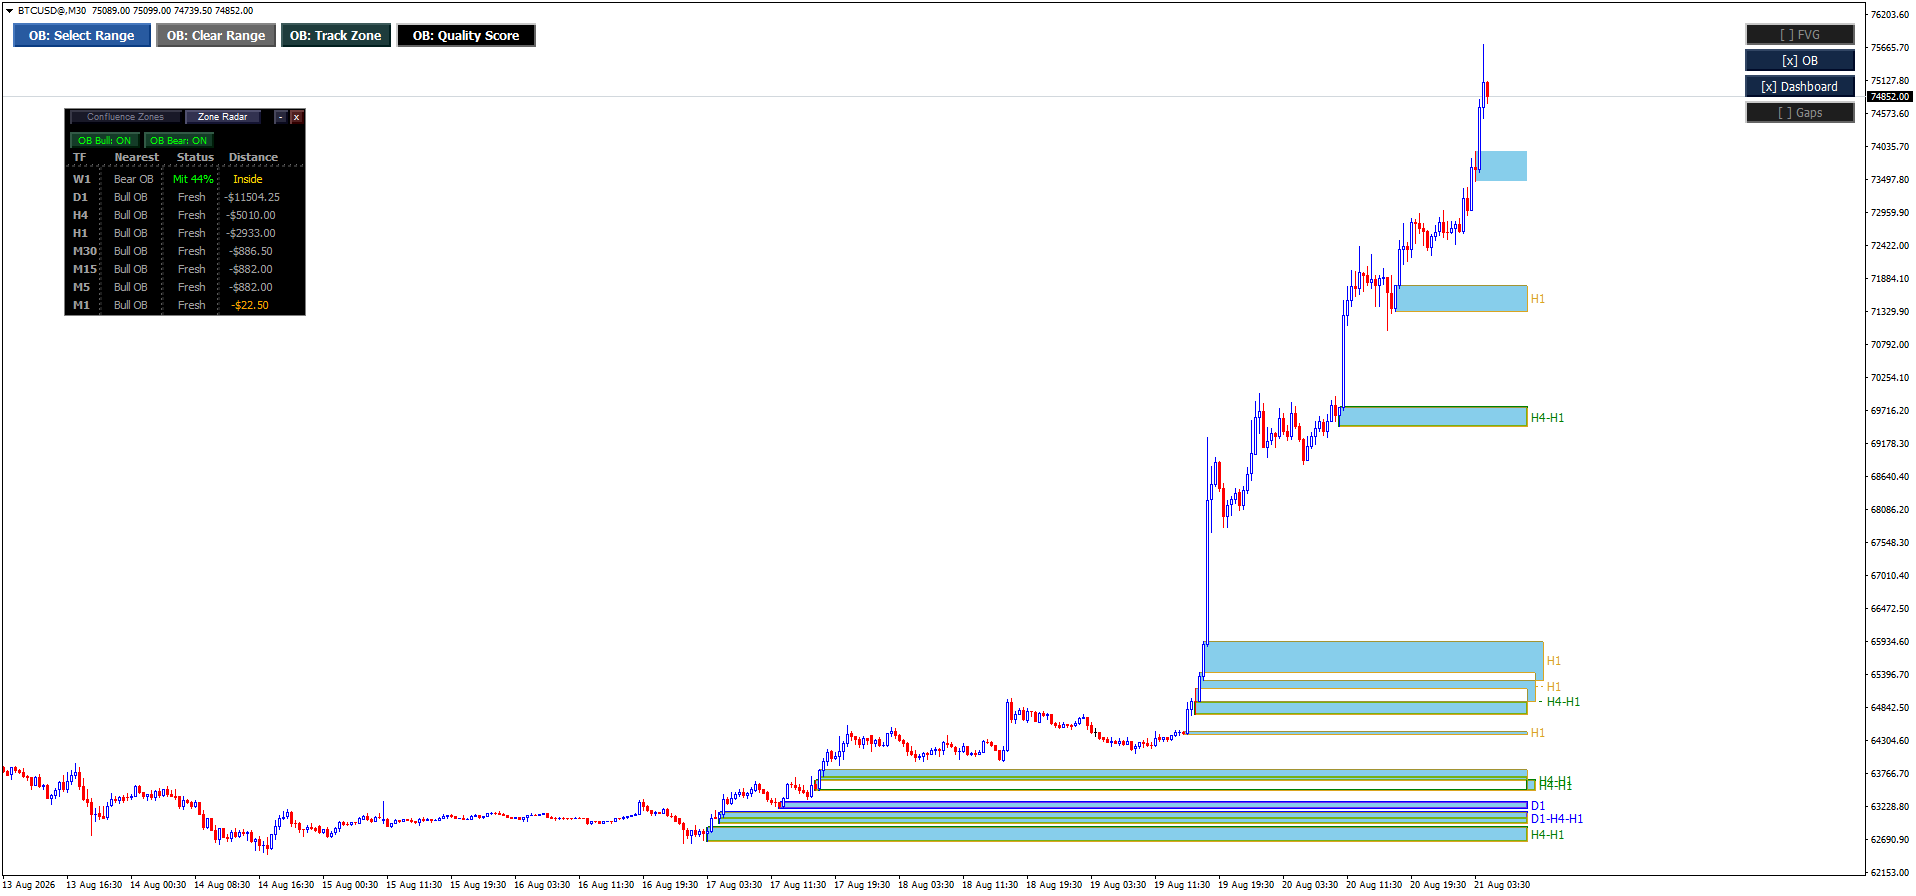
BTCUSD, M30 — multiple aligned tiers stacked at once. Combined labels like H4-H1 and D1-H4-H1 take the color of their highest aligned timeframe.