Order Block Confluence Pro – User Manual: Controls & Quality Score

Order Block Confluence Pro – User Manual (4 parts)
- Getting Started
- Controls & Quality Score (this part)
- Input Reference
- Alerts & FAQ
On-Chart Controls
The Interface Overview section explained where each control is located. This section describes what each control does and how it affects the indicator’s behavior.
Show/Hide Toggles
The four toggles in the top-right corner control the visibility and processing of the indicator’s main zone categories. These toggles are not merely cosmetic — turning a zone category off immediately clears any active selection, tracking, or in-progress scan associated with that category.
FVG
shows or hides Fair Value Gaps.
- cancels any active FVG range selection, and
- cancels any active FVG tracking.
[ ] FVG — Fair Value Gaps off.
[x] FVG — Fair Value Gaps on.
OB
OB shows or hides Order Blocks.
Turning OB off performs a complete reset of the active OB scanning state:
- exits Two-Point Selection Mode,
- clears any active range,
- cancels any active tracking, and
- removes all currently displayed Order Blocks.
This is a genuine stop, not just a display filter: the entire OB scanning engine — both the chart-timeframe scan and the full higher-timeframe scan — halts completely while OB is off, unlike FVG’s partial background detection above.
Turning OB back on also resets the manual-deletion blacklist, so any Order Block you manually deleted earlier becomes eligible to reappear on the fresh scan.
Turning OB back on starts a fresh Order Block scan using the current indicator settings.
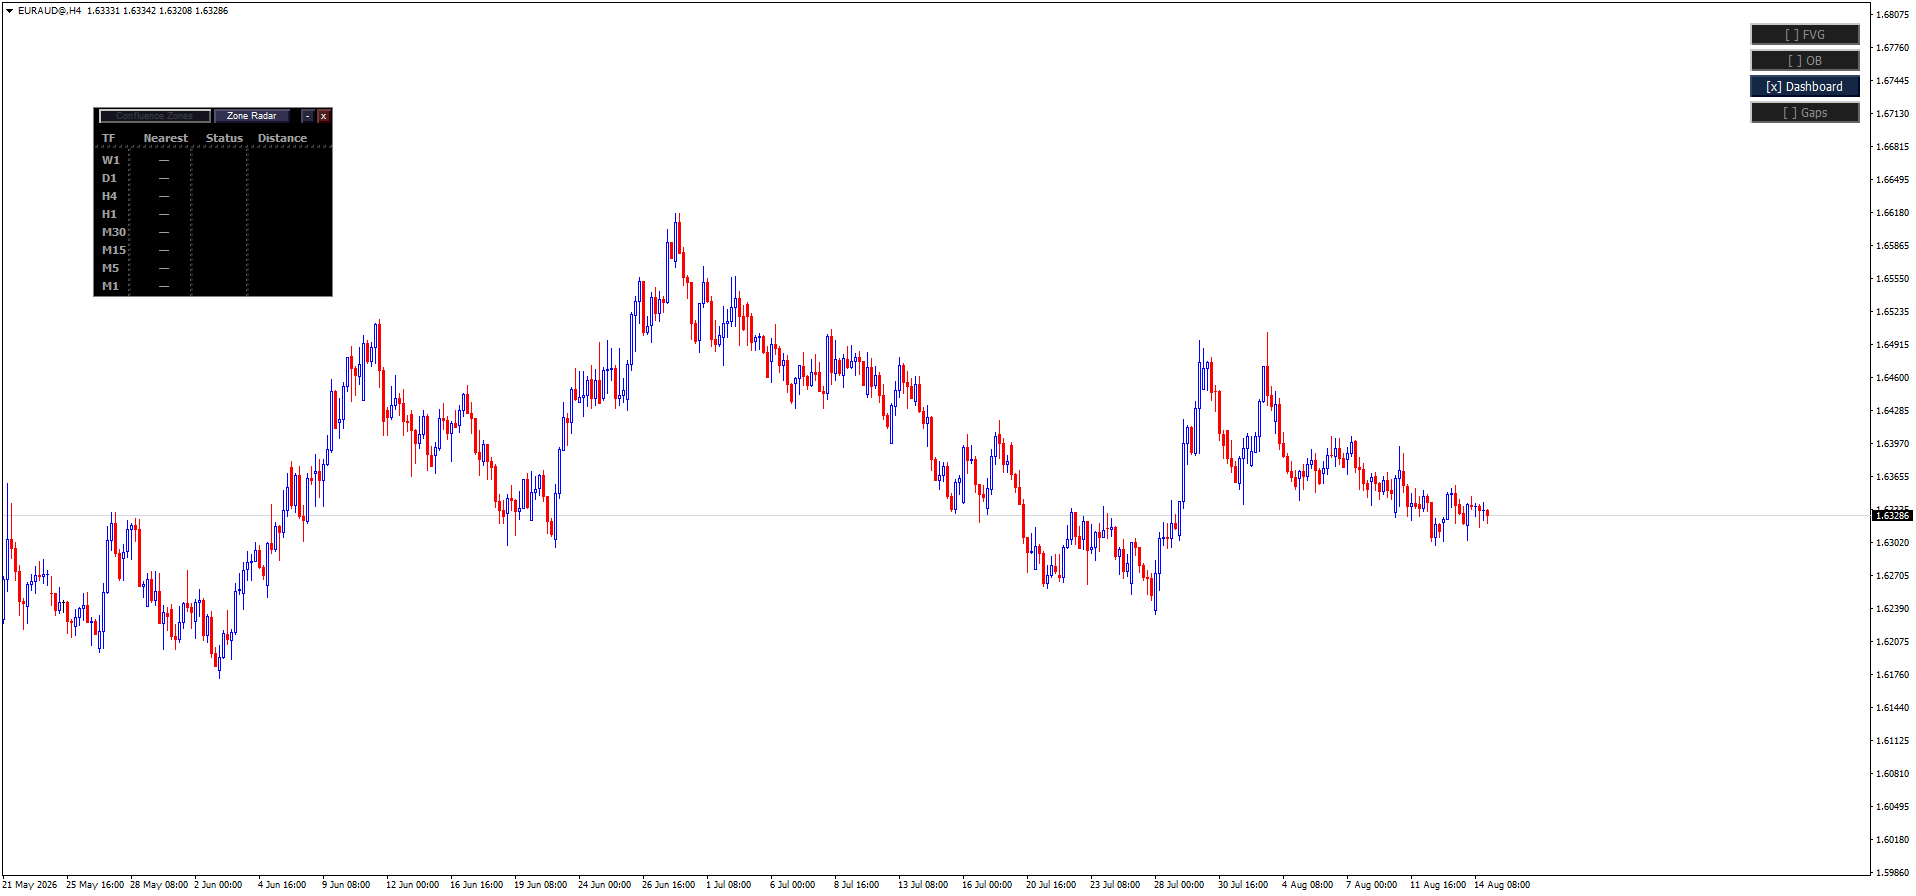
EURAUD, H4 — OB switched off. With the engine stopped, Zone Radar has nothing to report and shows “—” for every timeframe.
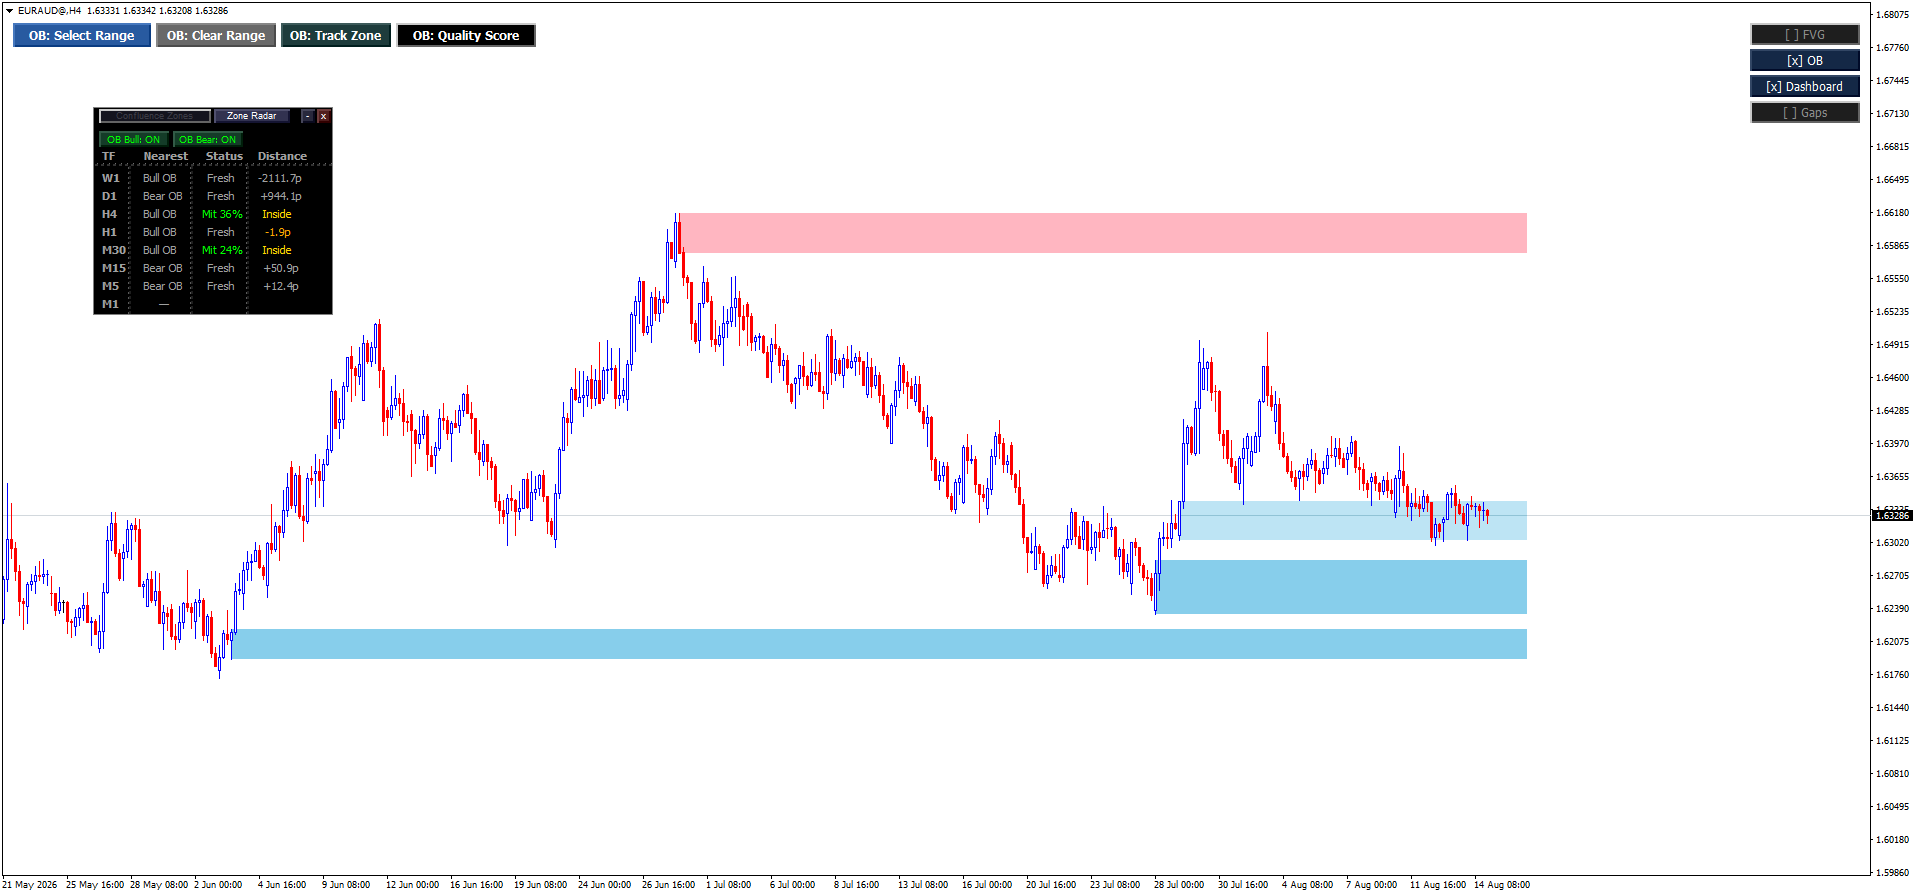
EURAUD, H4 — OB switched on. The same chart with Order Blocks scanned, drawn, and populating Zone Radar.
Dashboard
Dashboard shows or hides the dashboard panel.
Its behavior, including how it interacts with the panel’s Close (×) button and [Panel] reopen button, is explained in Interface Overview.
Gaps
Gaps shows or hides Regular Gaps — ordinary overnight or opening gaps that are distinct from institutional Fair Value Gaps.
Gaps and FVG are mutually exclusive. Turning Gaps on automatically turns FVG off.
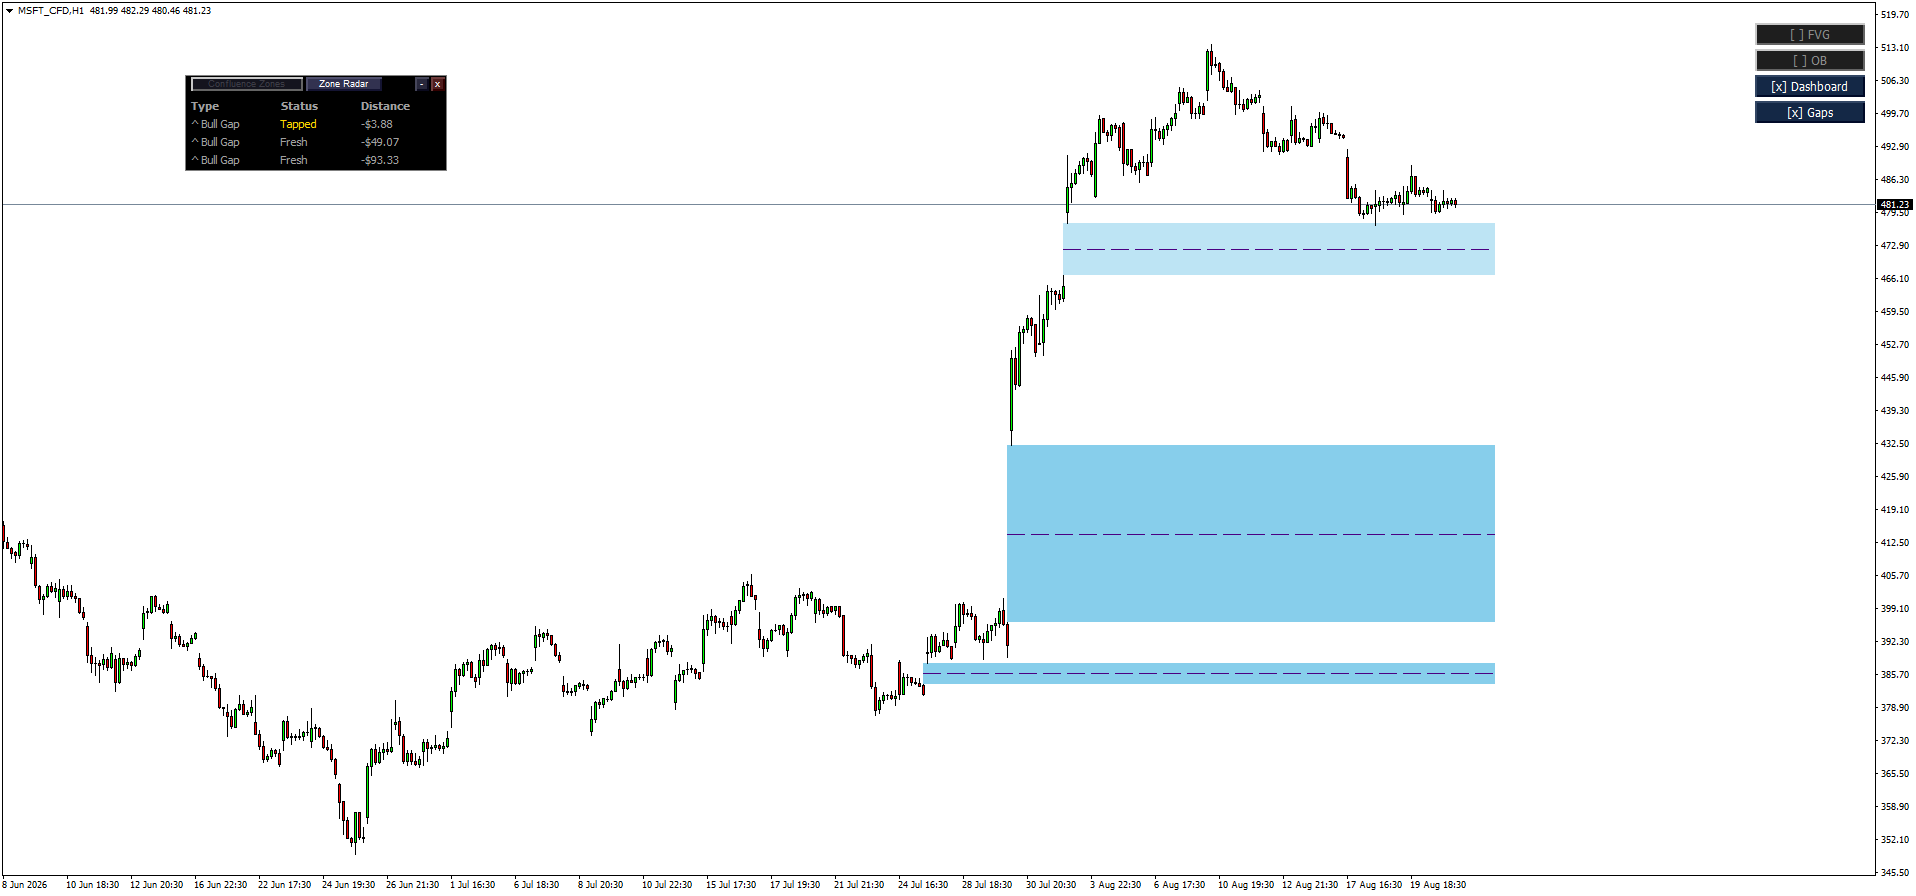
MSFT CFD, H1 — Gaps on, FVG and OB both off. Zone Radar falls back to its compact gap-proximity list, sorted nearest-to-price, with Distance in $.
Selection & Analysis Buttons
Each zone type — OB and FVG — has its own set of controls:
- Select Range
- Clear Range
- Track Zone
These buttons operate only on their associated zone category. For example, OB → Select Range affects only Order Blocks, while FVG → Select Range affects only Fair Value Gaps.
The Quality Score button is exclusive to Order Blocks. FVGs do not receive a Quality Score, so the FVG row contains only the first three buttons.
None of these buttons are displayed when reviewing historical zones in Consumed Only mode because there is no live scan available for selection, clearing, or tracking. The complete behavior of Consumed Only mode is explained in the Input Reference section.

NZDUSD, H4 — the FVG and OB rows both visible together, with their own Show/Hide toggle states on the right.
Select Range
The Select Range button activates Two-Point Selection Mode, allowing you to focus the indicator on a specific swing, price leg, session range, or other area instead of scanning the entire visible chart.
How Two-Point Selection Works
1. Arm the tool
Click Select Range. The button turns green, indicating that the indicator is ready for your selection.
2. Choose the first point
Click anywhere on the chart to mark the starting point of the range.
3. Choose the second point
Move your mouse to the desired second point. A gray rectangle appears as visual feedback, showing the temporary selection area. Click again to confirm the second point.
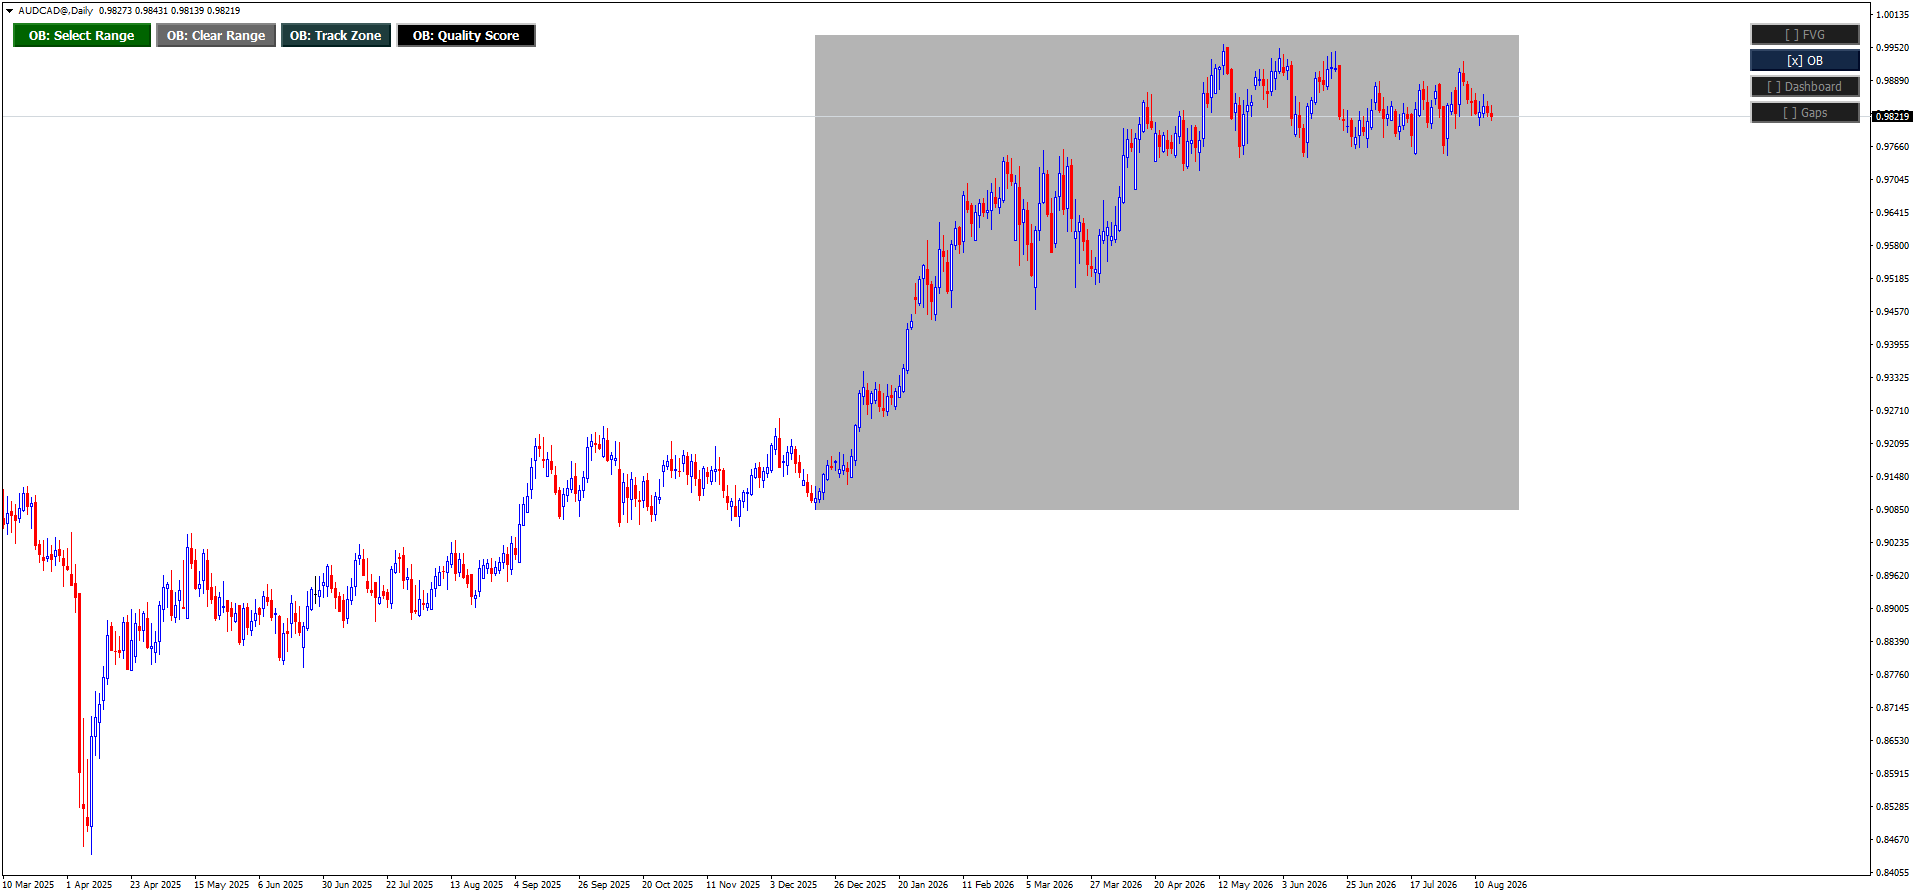
AUDCAD, Daily — Select Range armed (button glows green) with the gray rectangle marking the in-progress selection.
Once the second point is confirmed, the gray rectangle disappears and the indicator immediately switches to range-restricted scanning:
- Only zones inside the selected range are scanned.
- Everything outside the selected range is ignored.
- The indicator behaves as if the selected range were the entire chart.
This makes Two-Point Selection particularly useful for isolating a specific move, session, or structural leg.
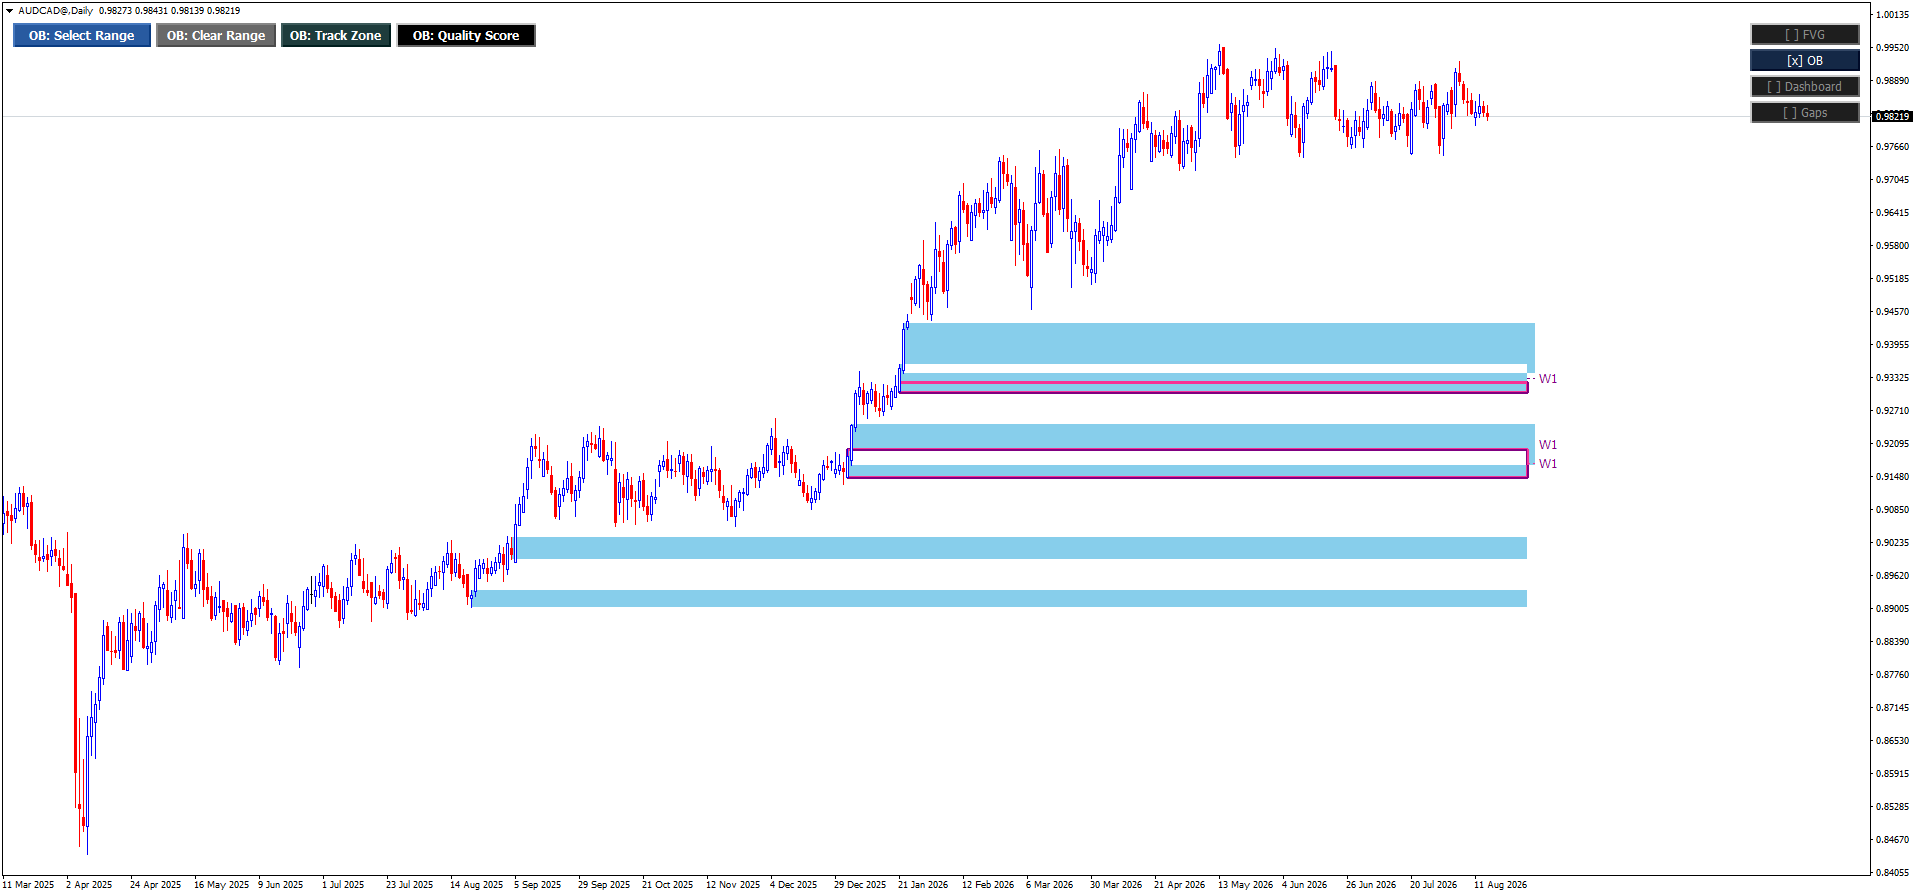
AUDCAD, Daily — the result after both points are confirmed: only Order Blocks inside the selected range remain, aligned with W1 where applicable.
Fibonacci Filter Inside Two-Point Selection
By default, the indicator applies a Fibonacci filter inside the selected range, showing only zones that fall between 50% and 127.2% of the measured swing.
The Fibonacci filter can be:
- turned off,
- customized, or
- expanded or narrowed.
All Fibonacci-related behavior is explained in detail in the Input Reference section.
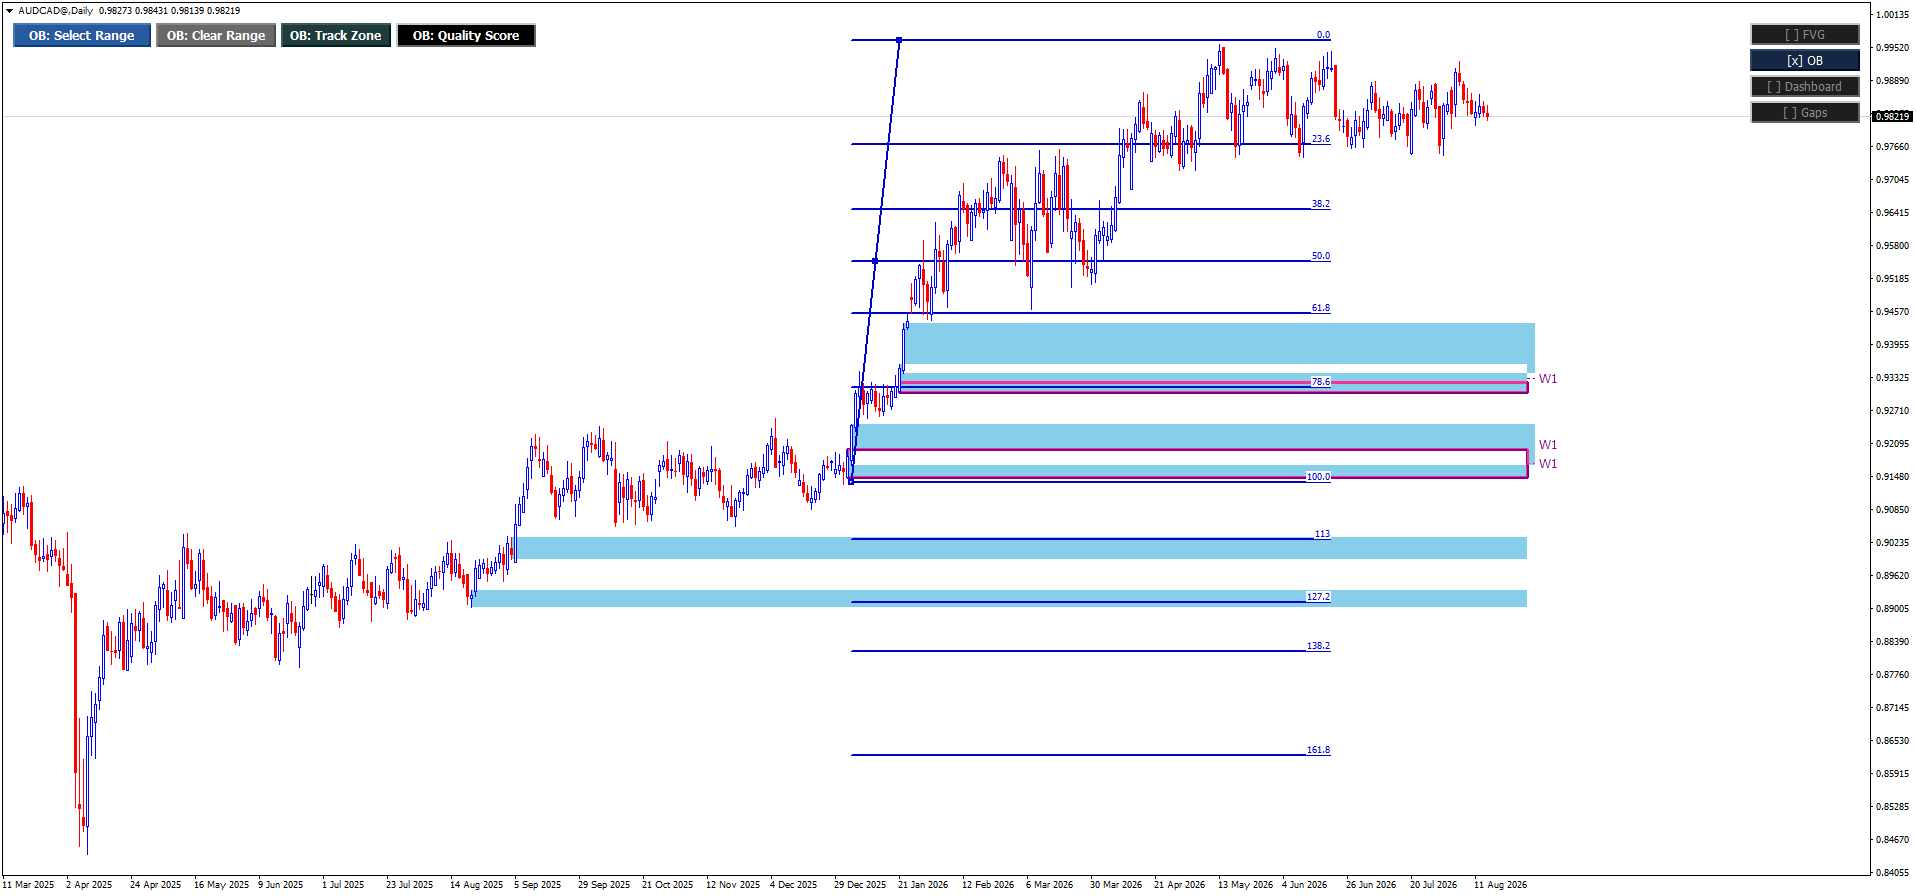
AUDCAD, Daily — the same range with its Fibonacci levels shown: the default filter keeps zones between the 50% and 127.2% levels.
Practical Notes
- The selection process is similar to drawing a Fibonacci retracement on the chart.
- If the chart shifts after you click the first point, simply click another point and start the selection again.
-
Two-Point Selection is especially useful when analyzing a single impulsive leg, a session range, a specific swing high → swing low, a consolidation breakout, or any structure you want to isolate from the rest of the chart.
Clear Range
The Clear Range button cancels Two-Point Selection Mode and returns the indicator to scanning the full visible chart.
For Order Blocks, clearing the range also resets the manual-deletion blacklist. Any Order Block you manually removed earlier becomes eligible to reappear during the fresh full-chart rescan.
This ensures that the new scan behaves as if no manual OB deletions had previously occurred.
Track Zone
The Track Zone button activates tracking mode for a single zone.
1. Arm tracking
Click Track Zone. The button glows bright teal to indicate that tracking mode is armed.
2. Select a zone
Click directly on an Order Block or FVG fill on the current timeframe to capture it.
Once captured:
- The tracked zone is projected as a dotted rectangle onto lower timeframes for the same symbol.
- It remains hidden on the timeframe where it was selected and on higher timeframes, since the original zone is already visible there.
- The rectangle’s right edge extends dynamically with each new bar.
The rectangle’s color indicates the current position of price relative to the tracked zone:
- teal — price has not yet reached the zone,
- orange — price is currently inside the zone,
- red — price has closed beyond the zone.
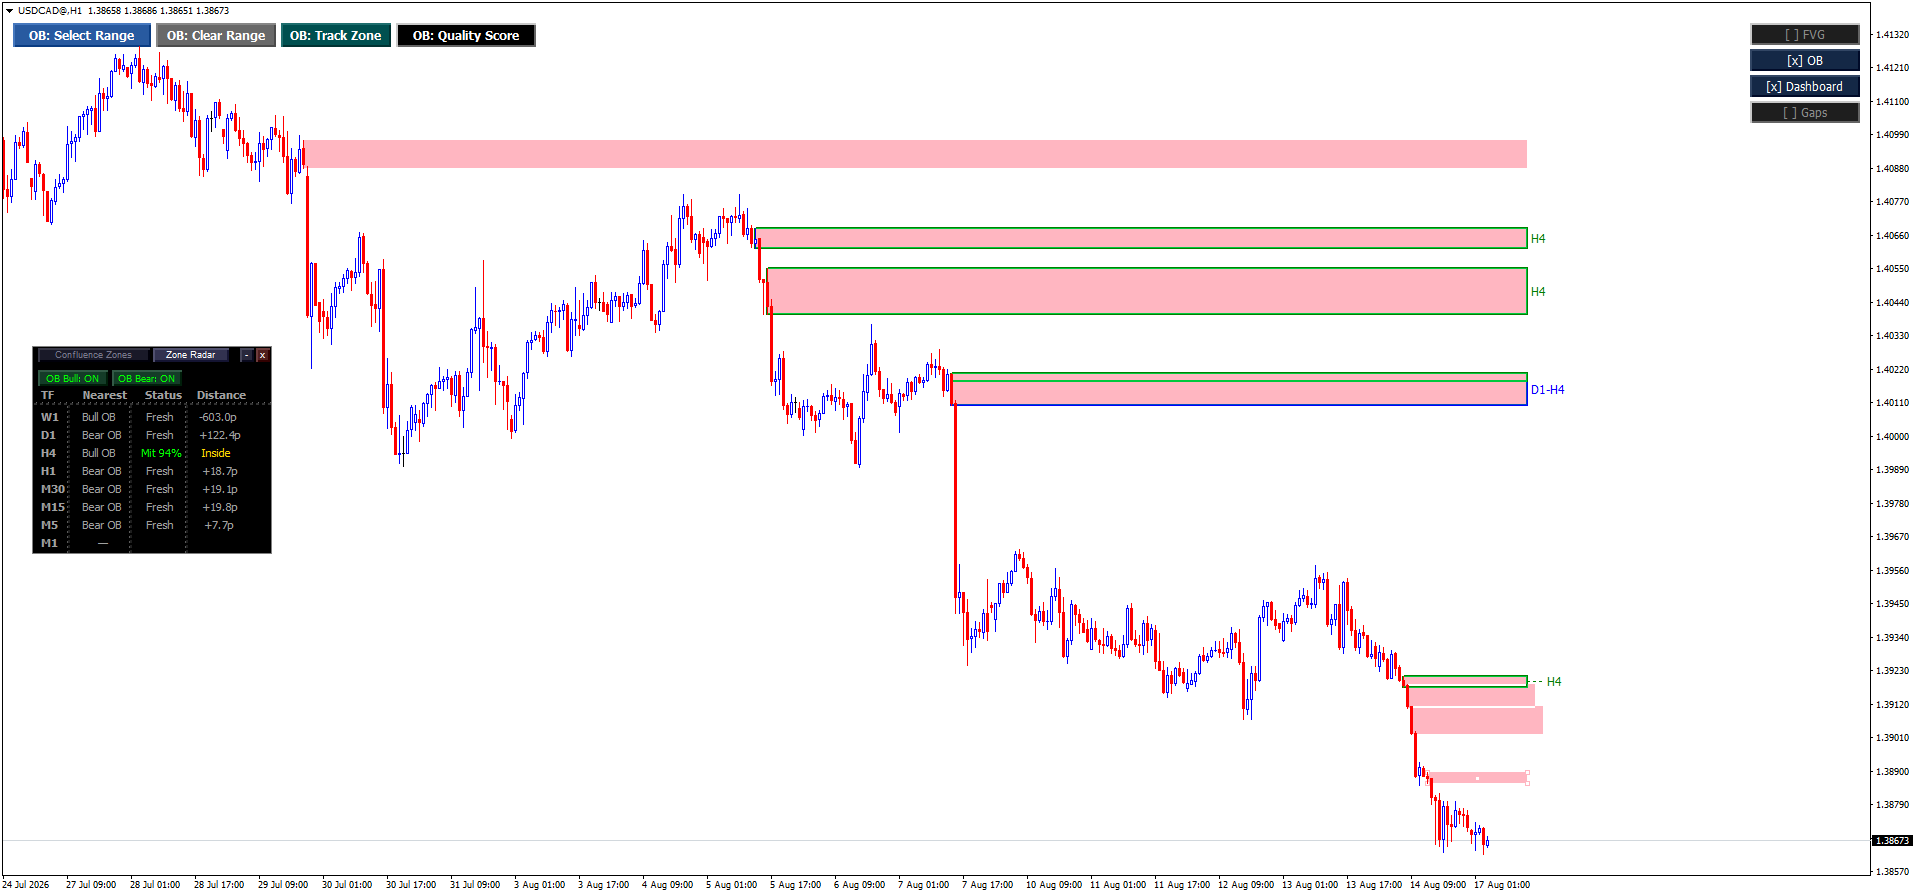
USDCAD, H1 — the source chart. Track Zone armed, ready to capture one of the Order Blocks shown here.
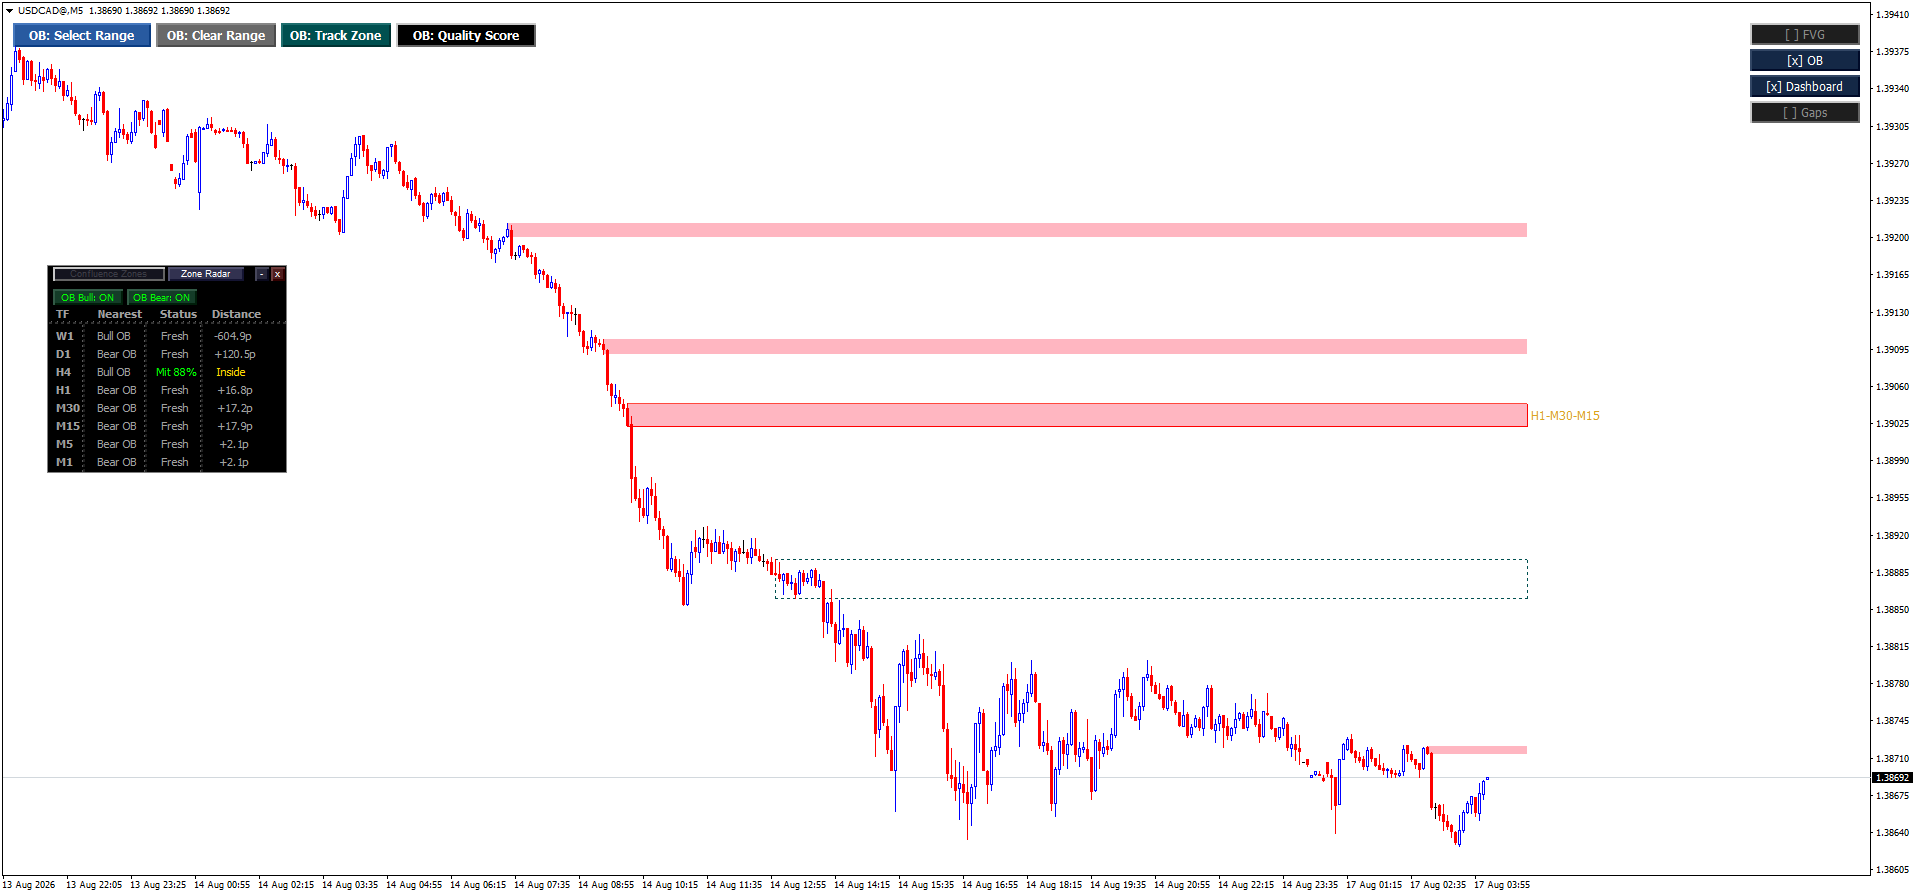
USDCAD, M5 — the same captured zone projected as a dotted rectangle on a lower timeframe chart.
Click Track Zone again at any time to clear the tracked zone and disarm tracking mode.
Quality Score — Order Blocks Only
The Quality Score button toggles the Quality Score panel on or off.
When enabled:
- By default, the Quality Score panel shows the nearest OB score.
- Hovering over any Order Block displays its live quality breakdown.
- Clicking an Order Block pins the panel to that zone, so it stops following the cursor.
- Clicking the same pinned Order Block again unpins the panel and returns the panel to hover mode.
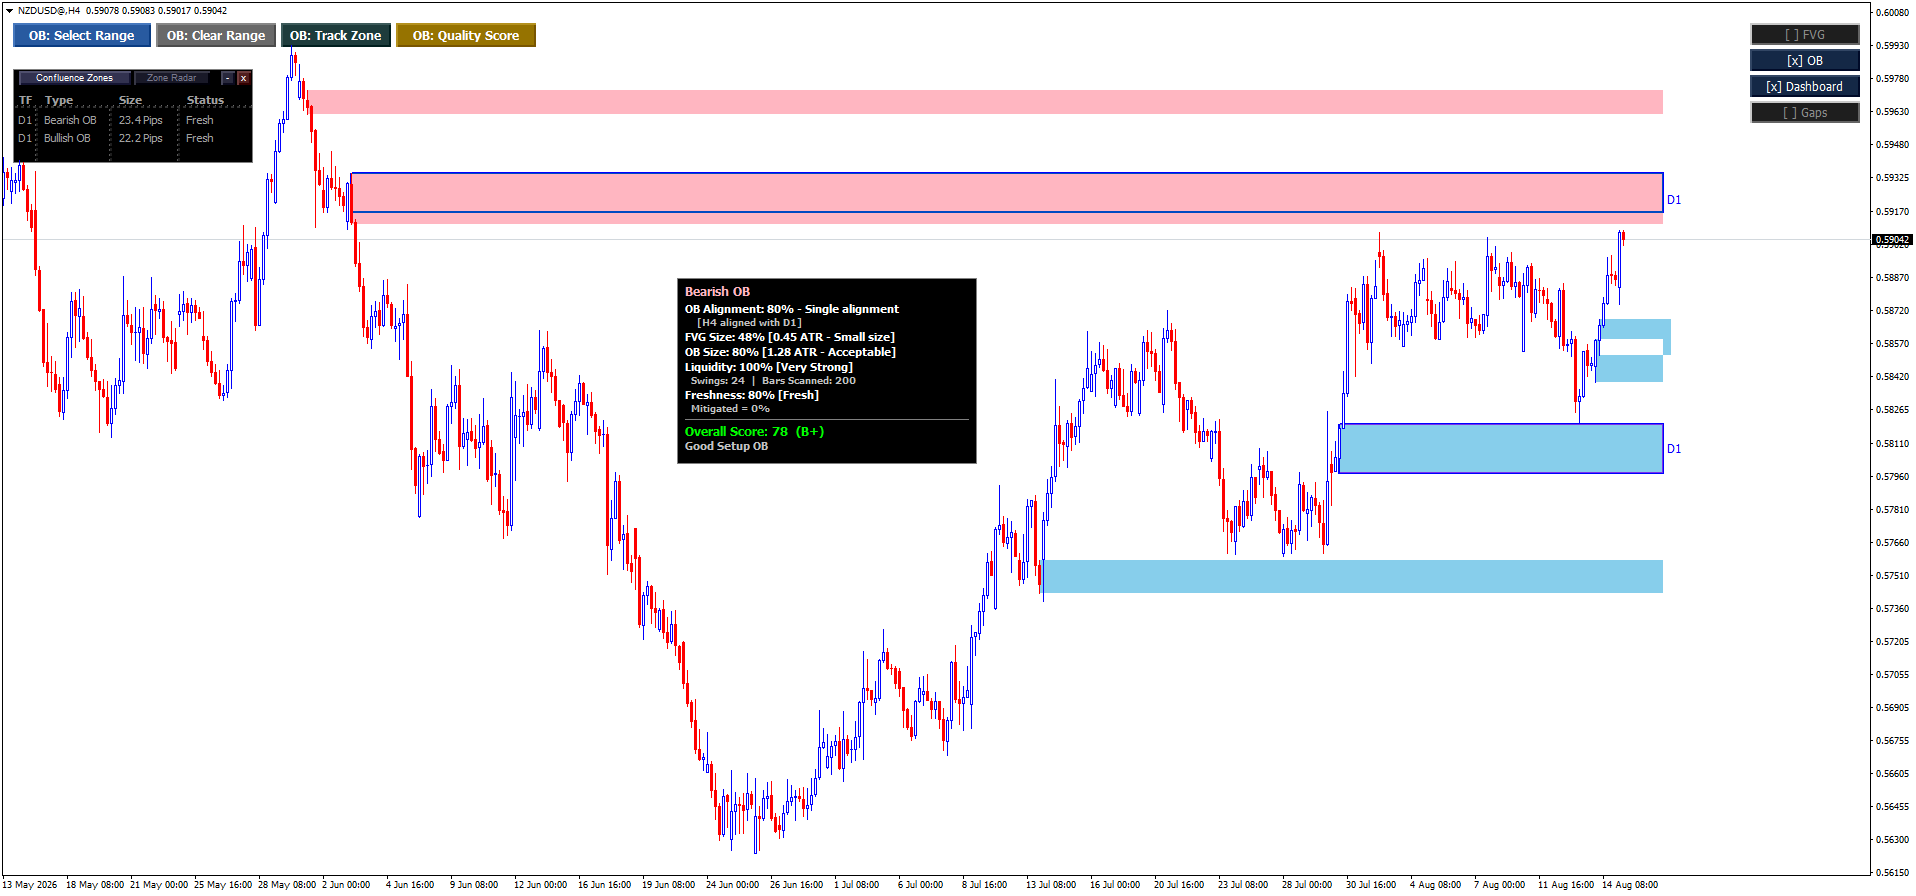
NZDUSD, H4 — the Quality Score panel in hover mode, showing the breakdown for the nearest Order Block.

NZDUSD, H4 — the panel pinned to a clicked Order Block, marked [PINNED] and no longer following the cursor.
The scoring model — Alignment, Freshness, Order Block Size, FVG Size, and Liquidity as the five core components, plus a Liquidity Sweep bonus — is explained later in this manual.
Export Log
The Export Log button only appears in Consumed Only mode, occupying the same corner where Select Range, Clear Range, Track Zone, and Quality Score normally sit. There is no live scan to select, clear, track, or score in Consumed Only mode, so those four buttons are hidden and this one takes their place.
Clicking it writes the full Consumed OB history to a text file — the same export triggered by the OB_ExportConsumedLog input. See OB_ExportConsumedLog and OB_ShowConsumedOnly in Input Reference for the file location, format, and overwrite behavior.
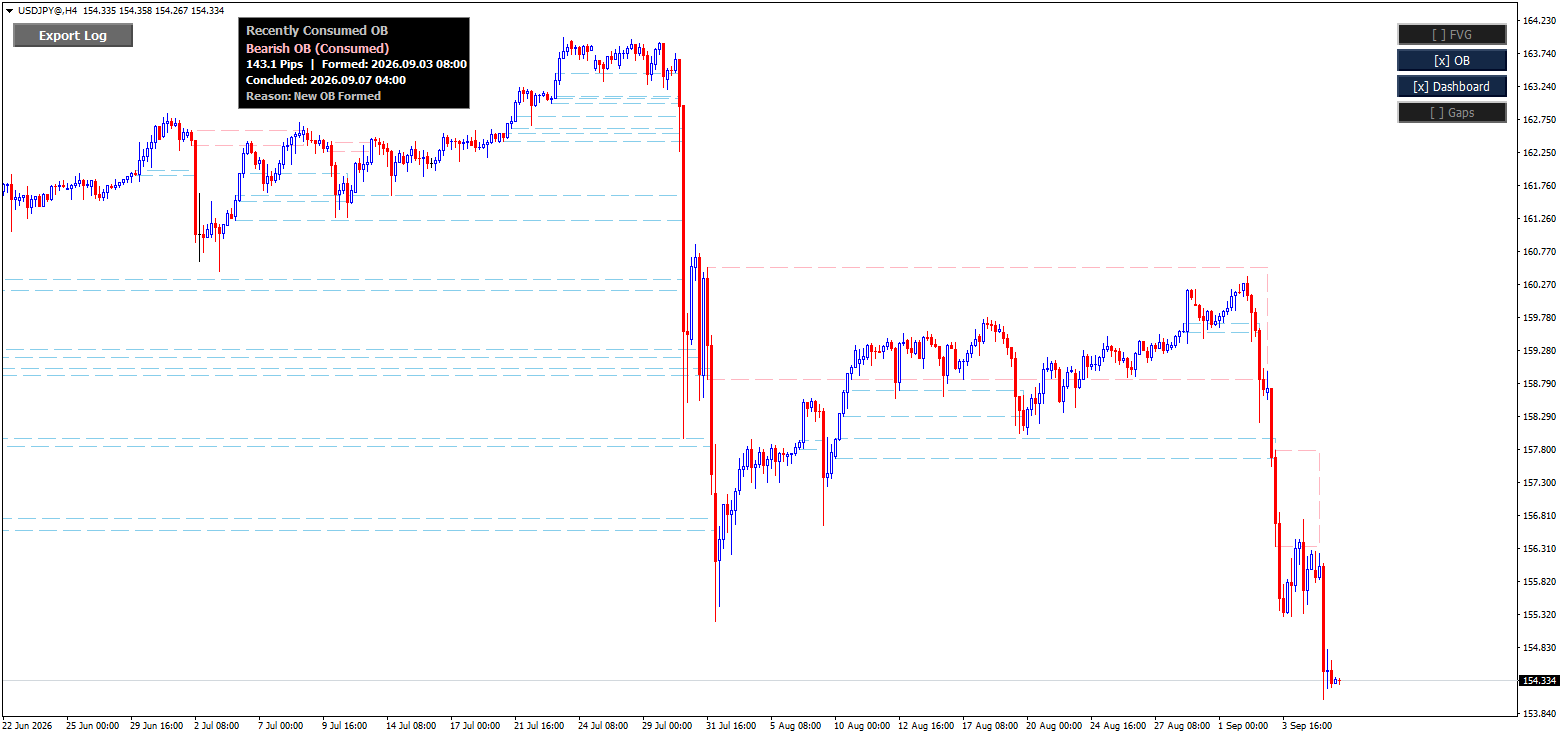
USDJPY, H4 — Consumed Only mode, with Export Log in place of the usual Selection & Analysis buttons and the Recently Consumed OB panel showing the most recently concluded record.
Zone Tooltips
Hovering over a visible zone displays a floating tooltip next to the cursor. Tooltips are available whenever the corresponding zone is visible and disappear as soon as the cursor leaves the zone.
Each zone type has its own tooltip content.
Only one tooltip is displayed at a time. Hovering over another zone immediately replaces the previous tooltip.
When reviewing archived, consumed Order Blocks in Consumed Only mode, the standard hover tooltip is replaced by a fixed-position information panel. The complete behavior of Consumed Only mode is explained in the Input Reference section.
Order Block Tooltip
Hovering over an Order Block displays:- Direction — Bullish OB / Bearish OB
- Size and how many bars ago it formed
- Letter Grade and numeric Quality Score
- Status — Fresh, or Tapped/Mitigated with live body% and wick% penetration
- Aligned Timeframes, when applicable
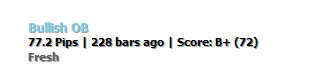
Bullish OB — no alignment; the Aligned line is omitted entirely.
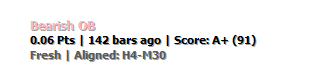
Bearish OB — aligned with H4-M30, shown on the Status line.
A fourth line, Max Wick Penetration, appears only when the deepest wick penetration the zone has ever experienced is meaningfully greater than its current penetration.
This helps identify zones that were tested more deeply in the past than their current status alone indicates.
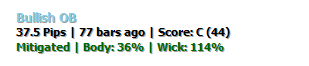
A Mitigated Order Block with no fourth line — the peak wick wasn’t meaningfully deeper than the current reading.
If a wick has fully crossed the opposite side of the zone, the Max Wick Penetration line displays “Crossed” instead of a percentage above 100%.
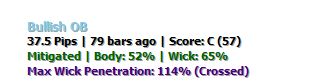
The same kind of Order Block with a genuinely deeper historical wick — the fourth line appears, and “(Crossed)” marks a wick that punched through the opposite side.
FVG Tooltip
Hovering over a Fair Value Gap displays:
- Direction — Bullish FVG / Bearish FVG
- Remaining Size — the live, unfilled portion of the gap
- how many bars ago it formed
- Aligned Timeframes, or “None” if no higher-timeframe alignment exists
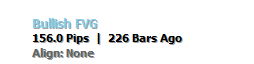
Bullish FVG — unaligned, showing “Align: None” explicitly.
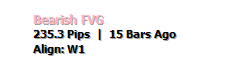
Bearish FVG — aligned with W1.
Regular Gap Tooltip
Hovering over a Regular Gap displays:
- Direction — Bullish Gap / Bearish Gap
- Size and how many bars ago it formed
- Status — Fresh, Tapped, or Filled, including the current fill percentage
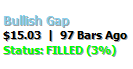
Bullish Gap — Filled (3%).
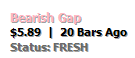
Bearish Gap — Fresh.
OB Quality Score System
Every Order Block the indicator detects is assigned a Quality Score from 0 to 100. This score determines the letter grade and numeric score displayed in the Order Block tooltip, populates the Quality Score panel, and provides the value used by the OB_MinDisplayScore input to filter out lower-conviction zones.
Fair Value Gaps and Regular Gaps are not scored. The Quality Score system applies exclusively to Order Blocks.
How the Score Is Built
Five components form the structural core of the Quality Score:
- Alignment — up to 25 points
- Freshness / Mitigation Quality — up to 25 points
- Order Block Size — up to 20 points
- FVG Size — up to 25 points
- Liquidity — up to 25 points
Together, these five components have a maximum structural score of 120 points.
A separate Liquidity Sweep Bonus can then add additional points when the Order Block’s origin candle has swept qualifying prior liquidity.
The final score is calculated using a fixed 120-point denominator:
Overall Score = round((Structural Sum + Sweep Bonus) ÷ 120 × 100), capped at 100
The 120-point denominator is intentional. It represents the maximum score available from the five primary structural components alone. The Liquidity Sweep is an optional bonus, rather than a required component for achieving a perfect structural score.
This means a flawless Order Block can achieve 100 even when no liquidity sweep is present. When a genuine liquidity sweep is detected, its weighted contribution is added to the structural score before normalization. This can produce a calculated value above 100, but the final Quality Score is capped at 100.
Using 120 rather than 136 as the denominator therefore ensures that the optional sweep bonus can enhance a strong setup without making a perfect structural score dependent on having a sweep.
The sections below explain each component.
Alignment — Up to 25 Points
Alignment measures how many qualifying higher-timeframe Order Blocks overlap the Order Block’s price range. This is the same alignment represented visually by the border boxes and combined labels described in the Color & Timeframe Legend.
- No aligned timeframe — 0 points
- One aligned timeframe (Single alignment) — 20 points
- Two aligned timeframes (Double alignment) — 22 points
- Three or more aligned timeframes (Full alignment) — 25 points
Freshness / Mitigation Quality — Up to 25 Points
Freshness / Mitigation Quality is based on how deeply price has penetrated into the Order Block.
This scoring ladder is not a simple “fresher is always better” curve. Instead, the score peaks in the middle of the zone, at 35–50% penetration (Equilibrium), and decreases as penetration moves farther toward either extreme.
- 0% — Fresh — 20 points
- 1–5% — Tapped — 21 points
- 5–25% — Lightly Mitigated — 22 points
- 25–35% — Moderately Mitigated — 23 points
- 35–50% — Equilibrium — 25 points
- 50–60% — Deeply Mitigated — 21 points
- 60–75% — Heavily Mitigated — 16 points
- 75–90% — Near Failure — 8 points
- 90–99% — Almost Consumed — 4 points
- Above 99% — Invalid — 0 points
Why does Equilibrium receive the highest score?
The scoring model treats an Order Block that has been tested and is progressing toward equilibrium as potentially more informative than a completely untouched zone.
Once price moves beyond equilibrium and continues deeper into the zone, the Order Block is increasingly considered consumed and its score declines.
A completely untouched Order Block has not yet been tested, which is why Fresh receives slightly fewer points than an Order Block approaching the Equilibrium range.
Order Block Size — Up to 20 Points
Order Block Size is measured relative to ATR at the time the Order Block formed.
The scoring favors a moderate zone size rather than simply rewarding larger zones. Very small zones may provide less meaningful structure, while excessively large zones may be less precise.
- Below 0.30× ATR — Very Small — 3 points
- 0.30–0.50× ATR — Small Size — 8 points
- 0.50–0.90× ATR — Good Size — 16 points
- 0.90–1.20× ATR — Optimum Size — 20 points
- 1.20–2.00× ATR — Acceptable — 16 points
- 2.00–3.00× ATR — Too Large — 10 points
- Above 3.00× ATR — Very Large — 3 points
The 0.90–1.20× ATR range represents the scoring peak.
FVG Size — Up to 25 Points
FVG Size measures the Fair Value Gap associated with the Order Block, relative to ATR.
Unlike Order Block Size, this component follows a progressive scale: larger FVGs receive higher scores.
- Below 0.10× ATR — Negligible — 2 points
- 0.10–0.30× ATR — Very Small — 5 points
- 0.30–0.50× ATR — Small Size — 12 points
- 0.50–0.70× ATR — Acceptable — 16 points
- 0.70–1.00× ATR — Good Size — 18 points
- 1.00–2.00× ATR — Very Good Size — 22 points
- Above 2.00× ATR — Exceptional — 25 points
The FVG Size contribution reaches its maximum when the associated FVG measures more than 2.00× ATR.
Liquidity — Up to 25 Points
The Liquidity component counts qualifying swing highs or lows located beyond the Order Block — potential resting liquidity that the price move may be targeting.
The indicator scans up to 200 bars back and requires at least 5 bars between qualifying swing points.
- No qualifying swings — 0 points
- One swing (Weak) — 8 points
- Two swings (Moderate) — 15 points
- Three swings (Strong) — 22 points
- Four or more swings (Very Strong) — 25 points
Equal-High / Equal-Low Bonus
An additional +5-point bonus can be applied when two of the nearest qualifying swing levels are within 25% of current ATR of each other.
This identifies a potential equal-highs or equal-lows liquidity cluster, which can represent a concentrated liquidity pool.
The Liquidity component is capped at 25 points, so this bonus cannot increase the component beyond its maximum.
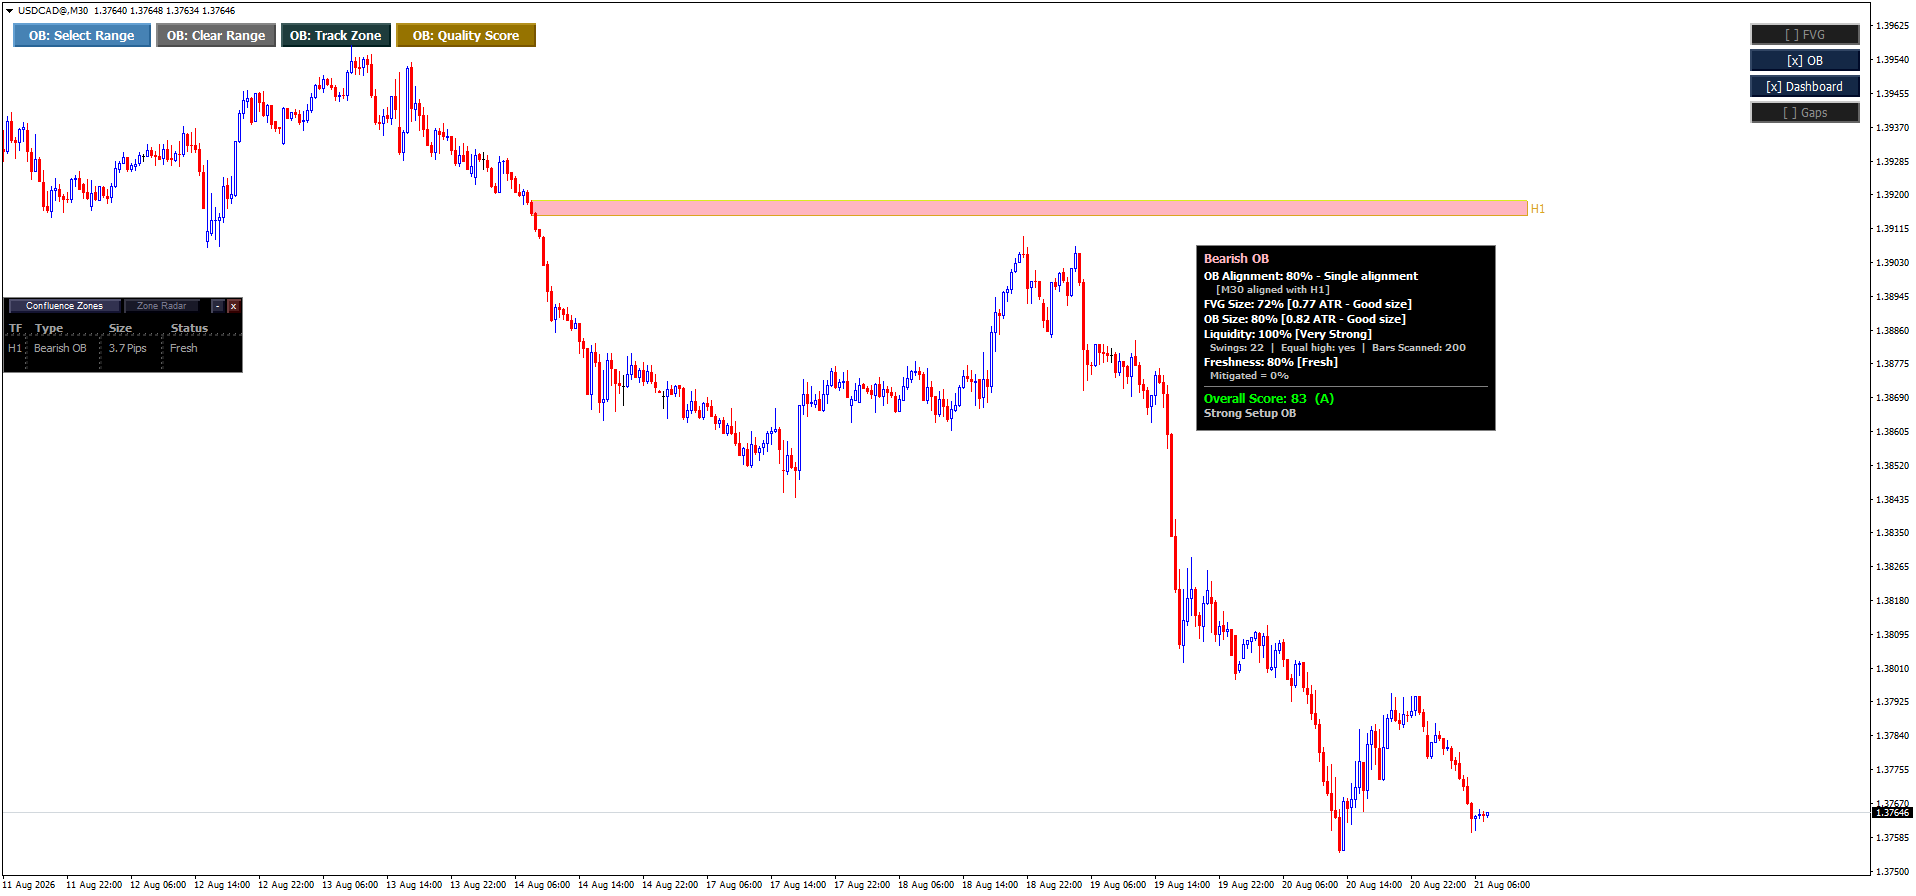
USDCAD, M30 — an equal-high liquidity cluster (Equal high: yes), contributing to a Liquidity score of 100% [Very Strong].

EURUSD, H1 — an equal-low liquidity cluster (Equal low: yes), contributing to a Liquidity score of 100% [Very Strong].
Liquidity Sweep Bonus
The Liquidity Sweep Bonus is a separate secondary factor rather than one of the five primary structural components.
It evaluates whether the Order Block’s origin candle actually swept qualifying prior liquidity before reversing:
- For a bullish Order Block, the origin candle may receive a sweep bonus when it sweeps a prior swing low.
- For a bearish Order Block, the origin candle may receive a sweep bonus when it sweeps a prior swing high.
The raw Liquidity Sweep score has a maximum of 20 points, but it contributes to the overall score at 80% weight. Therefore, its maximum contribution to the overall calculation is 16 points.
The Quality Score panel displays the raw sweep score against its own 20-point maximum. For example, a perfect sweep displays as 100% within the Liquidity Sweep component.
The 80% weighting is applied only when calculating the sweep’s contribution to the Overall Score.

AUDUSD, M15 — a 25% [Extended] sweep, 0.86 ATR below the swing low. Overall Score 81 (A).

EURUSD, M30 — a 100% [Sweet Spot (Excellent)] sweep, 0.37 ATR below the swing low. Overall Score 96 (A+).
Grade Bands
The final 0–100 Quality Score maps to a letter grade and setup label. These are the same values displayed in the Order Block tooltip and Quality Score panel, as described in On-Chart Controls.
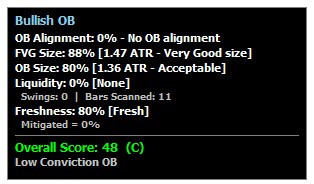
Score 48 — C — Low Conviction OB.
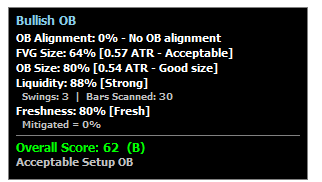
Score 62 — B — Acceptable Setup OB.
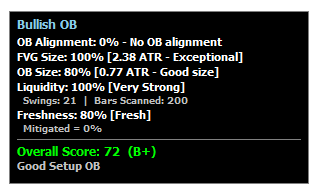
Score 72 — B+ — Good Setup OB.
| Score | Grade | Setup Label |
|---|---|---|
| 90-100 | A+ | High Probability |
| 80–89 | A | Strong Setup |
| 70–79 | B+ | Good Setup |
| 60–69 | B | Acceptable Setup |
| Below 60 | C | Low Conviction |