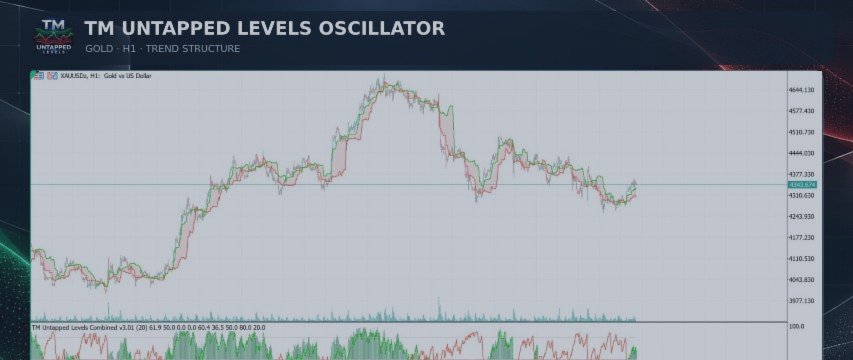
TM Untapped Levels Oscillator for MT5 – See Market Pressure Beyond Price

TM Untapped Levels Oscillator for MT5 – See Market Pressure Beyond Price
Markets constantly leave behind unfinished price interaction. Some highs remain unchallenged, some lows remain protected, and the balance between these opposing structures can reveal useful information about the current market environment.
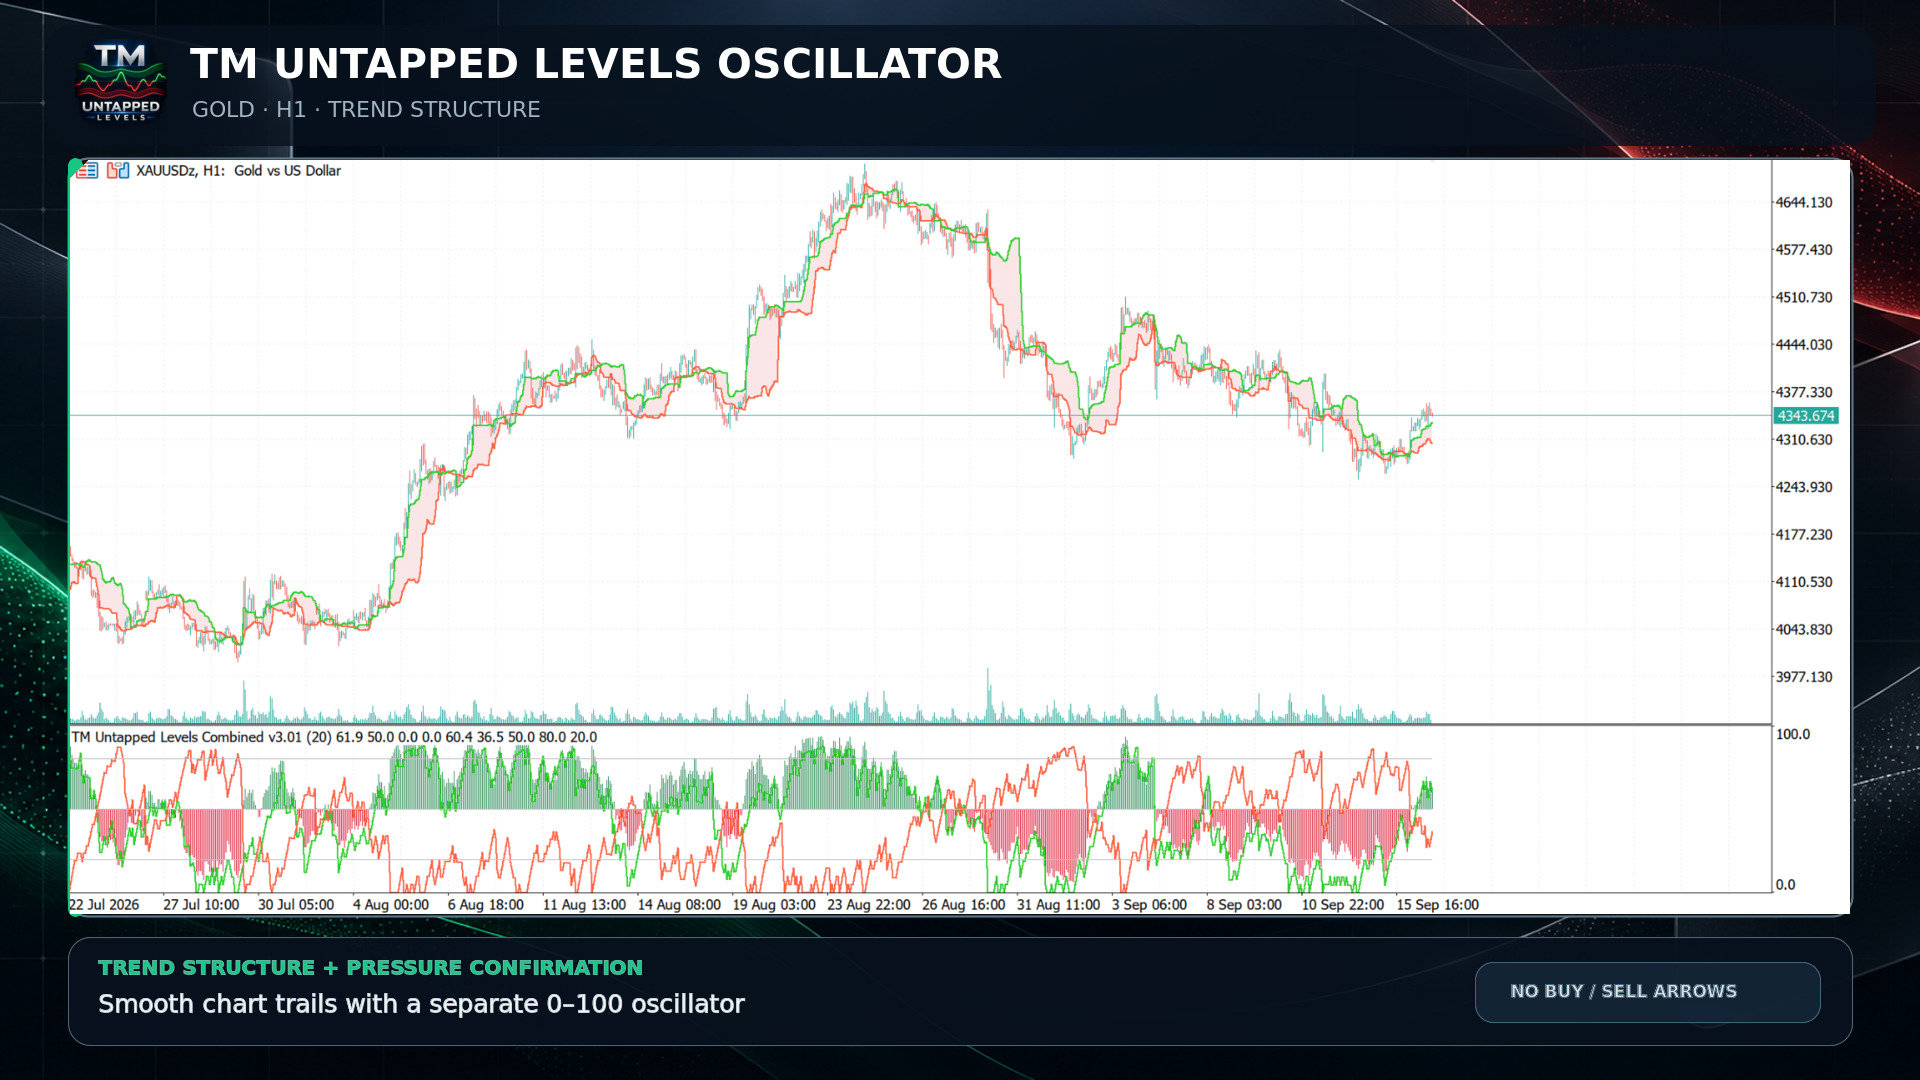
TM Untapped Levels Oscillator is a free MetaTrader 5 indicator designed to measure that balance and present it through two connected visual components:
-
Smooth dynamic trails directly on the main price chart
-
A separate 0–100 oscillator with bullish and bearish lines
-
A pressure histogram for easier visual confirmation
-
Adjustable upper, middle and lower reference levels
-
Optional chart-zone shading
-
Configurable alerts
-
No Buy or Sell arrows
The objective is not to predict every market turn. The indicator is designed to help traders understand whether bullish or bearish market pressure is becoming persistent, weakening or shifting.
Why combine chart trails with an oscillator?
A conventional oscillator is displayed separately from price. Although this keeps the chart clean, it can sometimes make the relationship between market structure and oscillator behaviour harder to observe.
TM Untapped Levels Oscillator combines both perspectives.
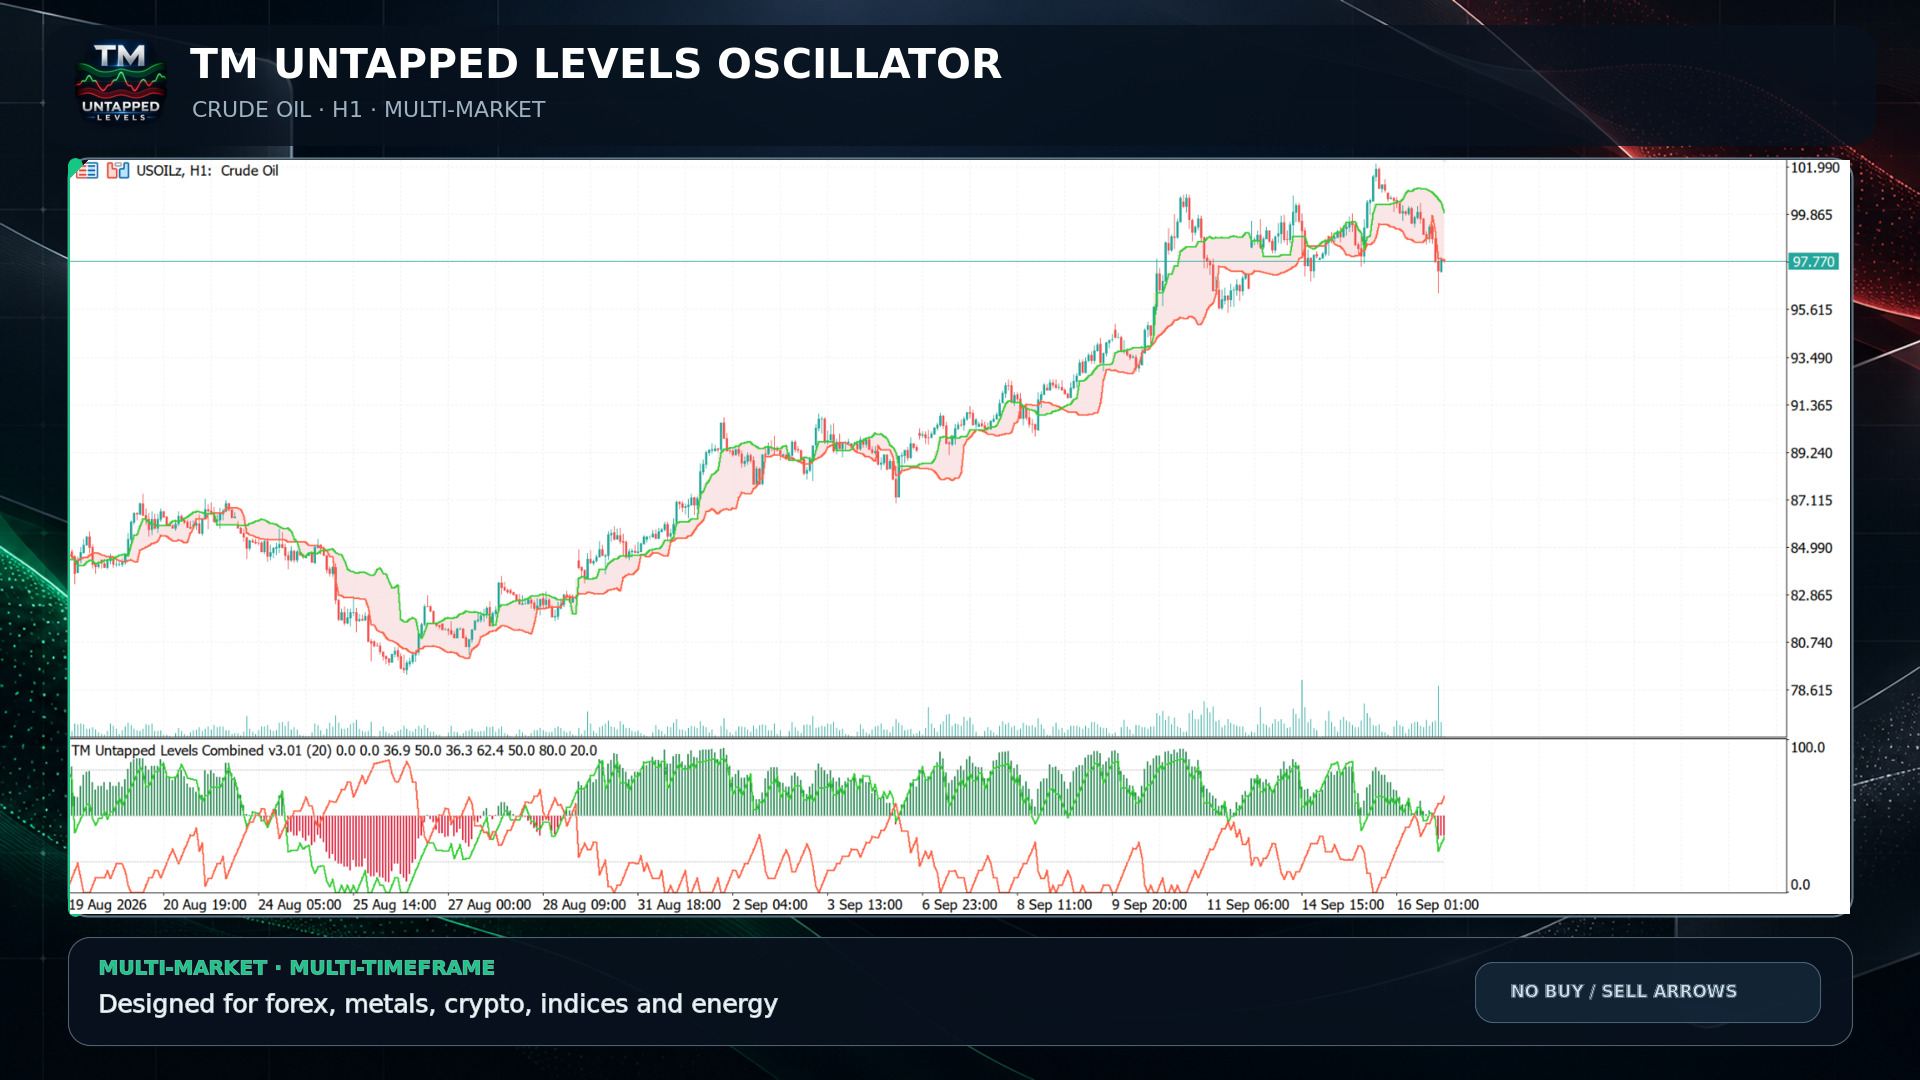
The smooth trails on the main chart provide immediate structural context, while the oscillator below the chart shows the developing balance between bullish and bearish pressure.
This makes it possible to examine:
-
Whether price is holding above or below its dynamic trail
-
Whether bullish or bearish pressure is increasing
-
Whether price structure and oscillator behaviour agree
-
Whether the market is trending, transitioning or becoming balanced
-
Whether a sudden reversal has enough persistence to deserve attention
Understanding the oscillator
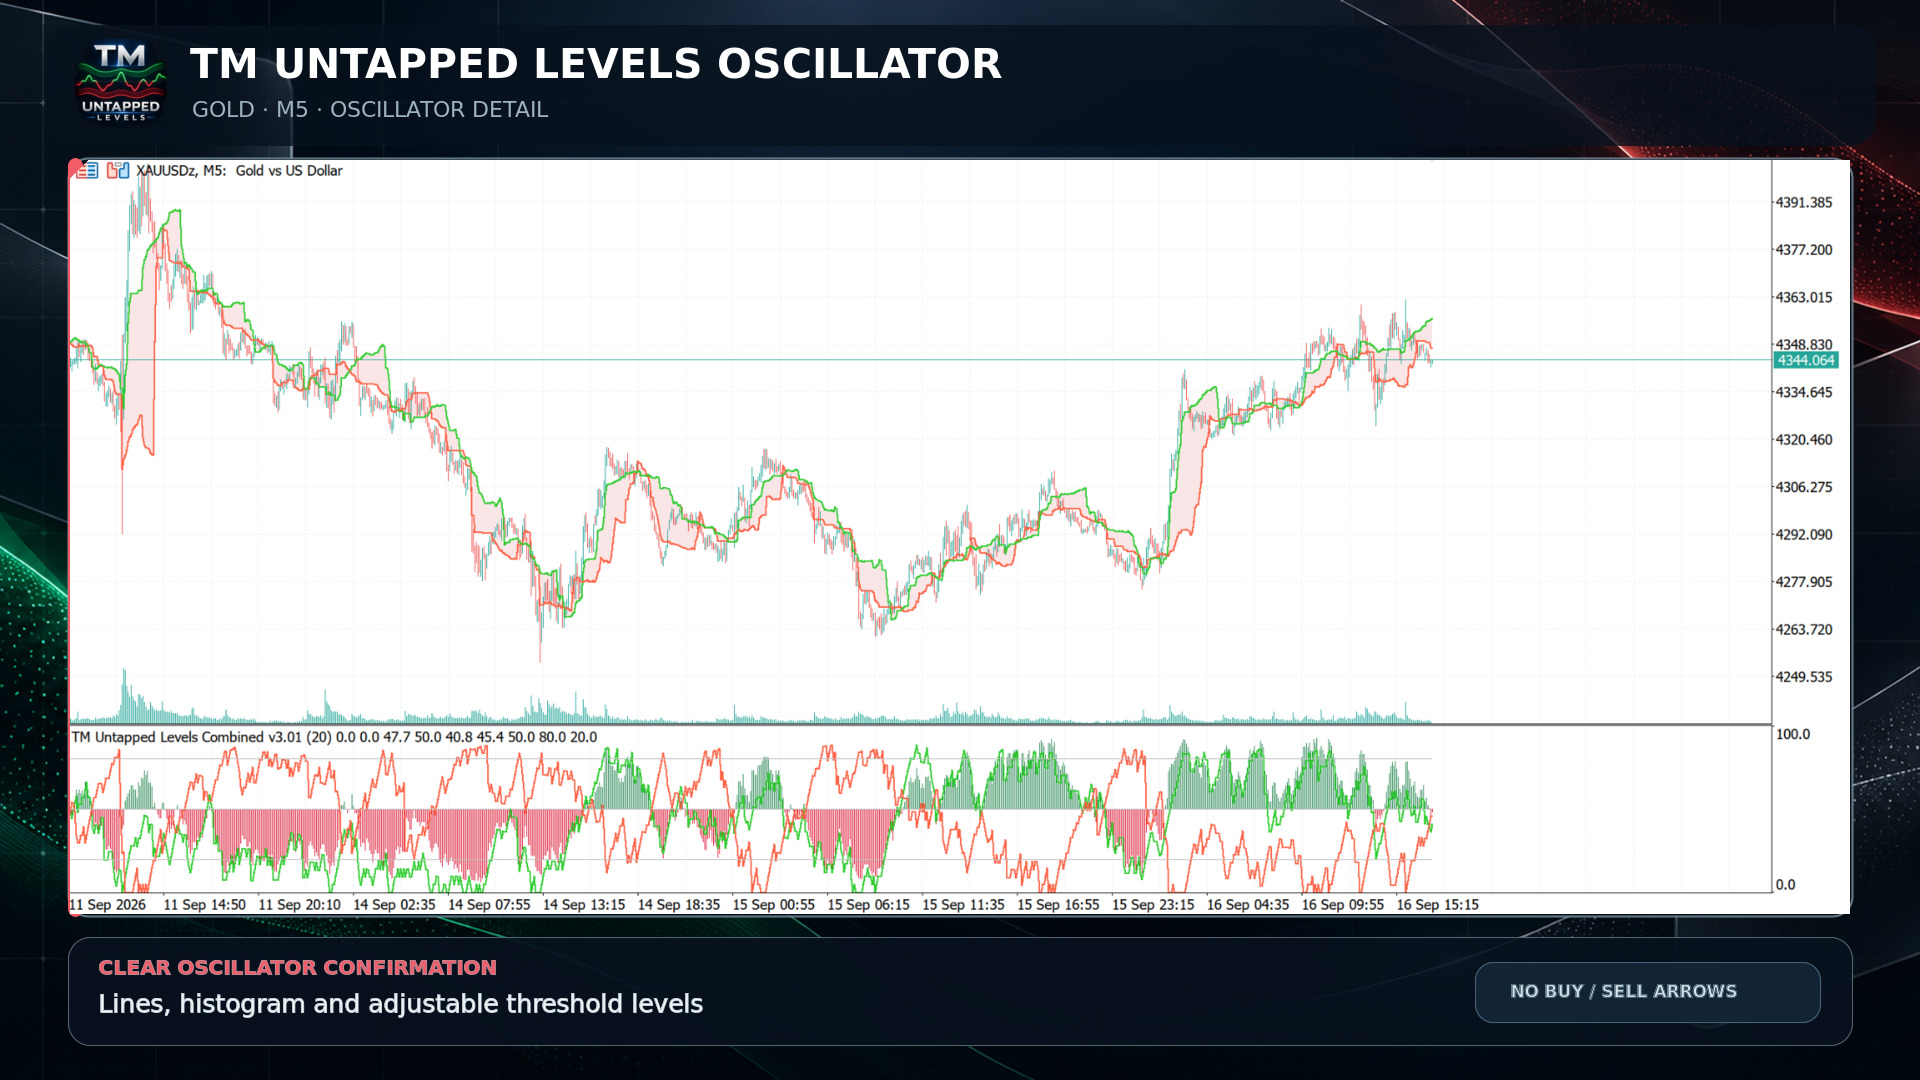
The indicator plots bullish and bearish pressure on a scale from 0 to 100.
The default reference levels are:
-
80: Upper threshold
-
50: Balance level
-
20: Lower threshold
These levels can be changed from the indicator settings.
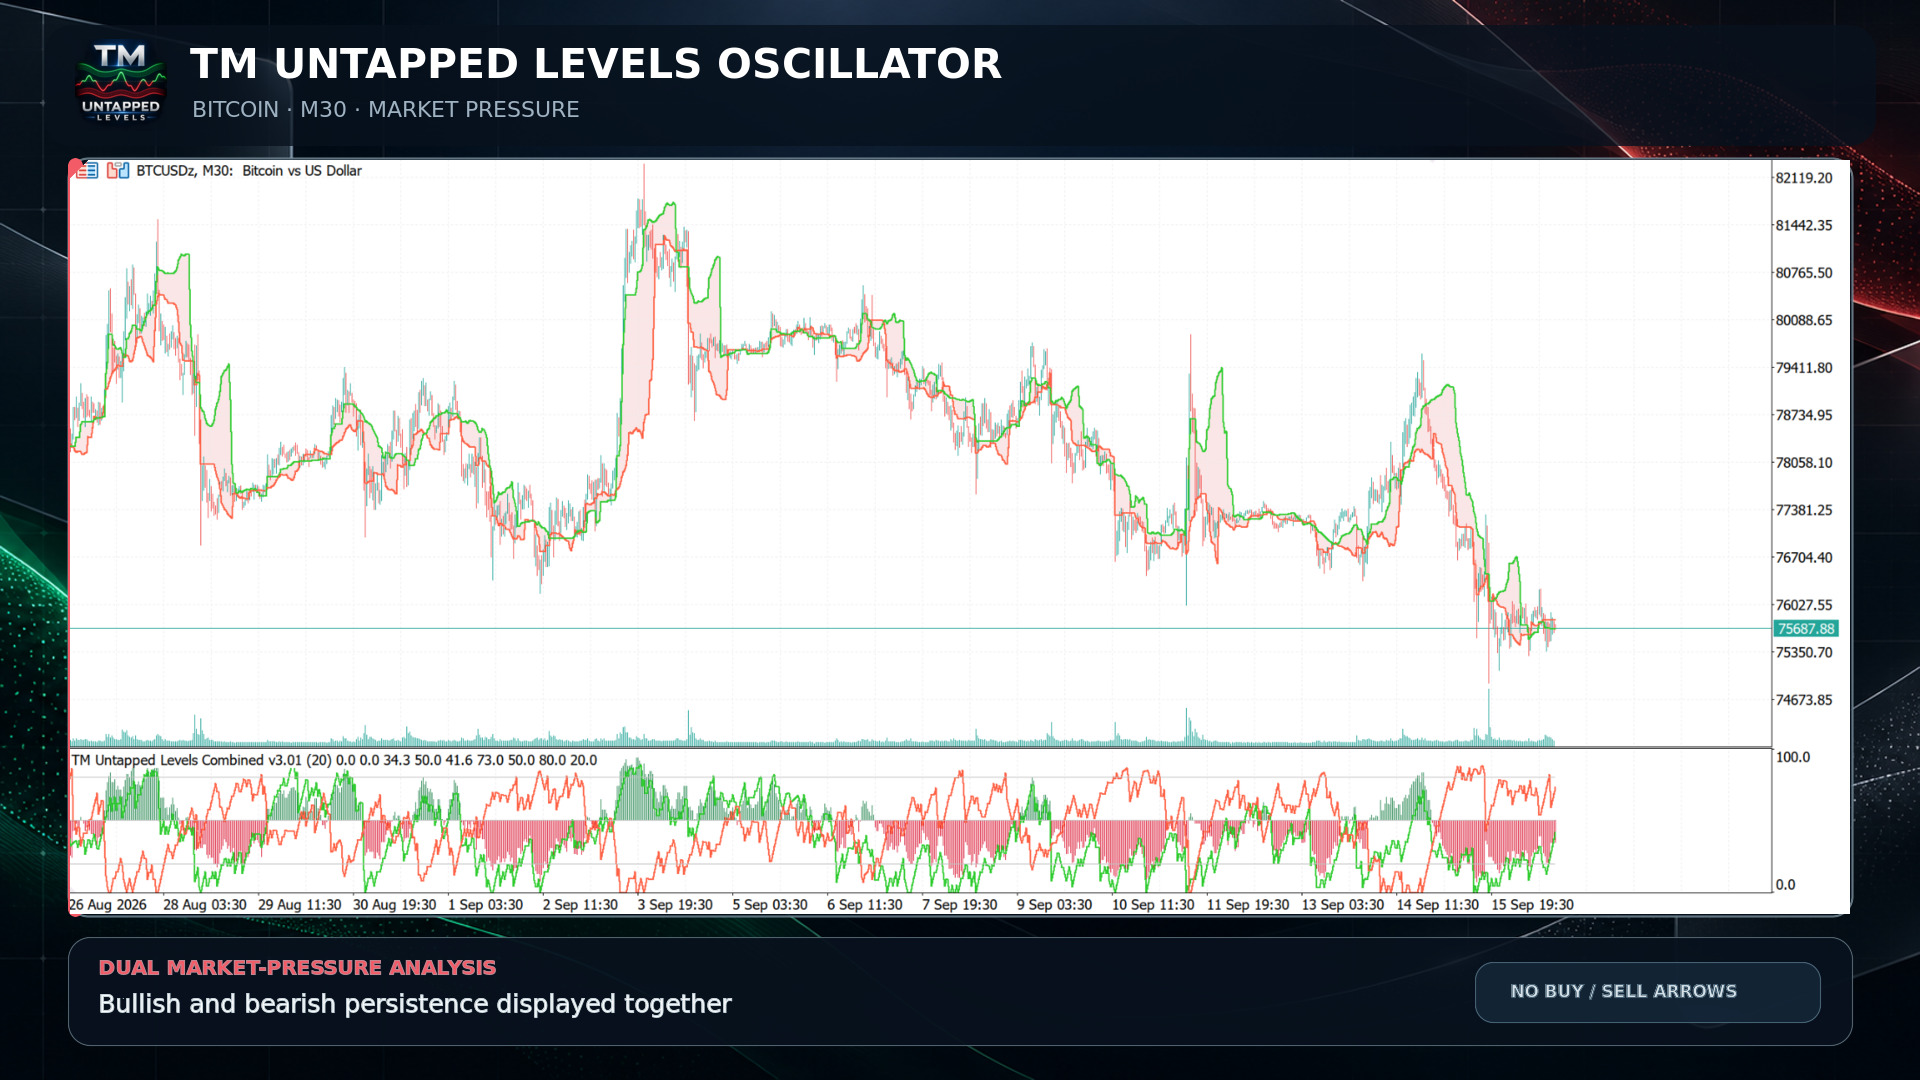
The green and red lines represent opposing market-pressure conditions. Their relative position, direction and persistence can be more informative than a single crossover.
Instead of treating every crossing as an automatic trading signal, traders can study whether the new condition remains active and receives confirmation from the main price chart.
Reducing sudden opposite indications
One of the problems with highly sensitive indicators is that they can alternate rapidly between bullish and bearish conditions during sideways or noisy markets.
TM Untapped Levels Oscillator uses smoothing and structural persistence to create a more stable visual interpretation while preserving a practical number of market indications.
This does not remove every short-term fluctuation. No technical indicator can completely eliminate market noise without also introducing considerable delay. The goal is to achieve a useful balance between responsiveness and stability.
For that reason, traders should evaluate:
-
The direction of the chart trail
-
The position and slope of the oscillator lines
-
The behaviour of the histogram
-
The broader trend and support/resistance structure
-
The conditions of the current timeframe
Smooth dynamic trails on the chart
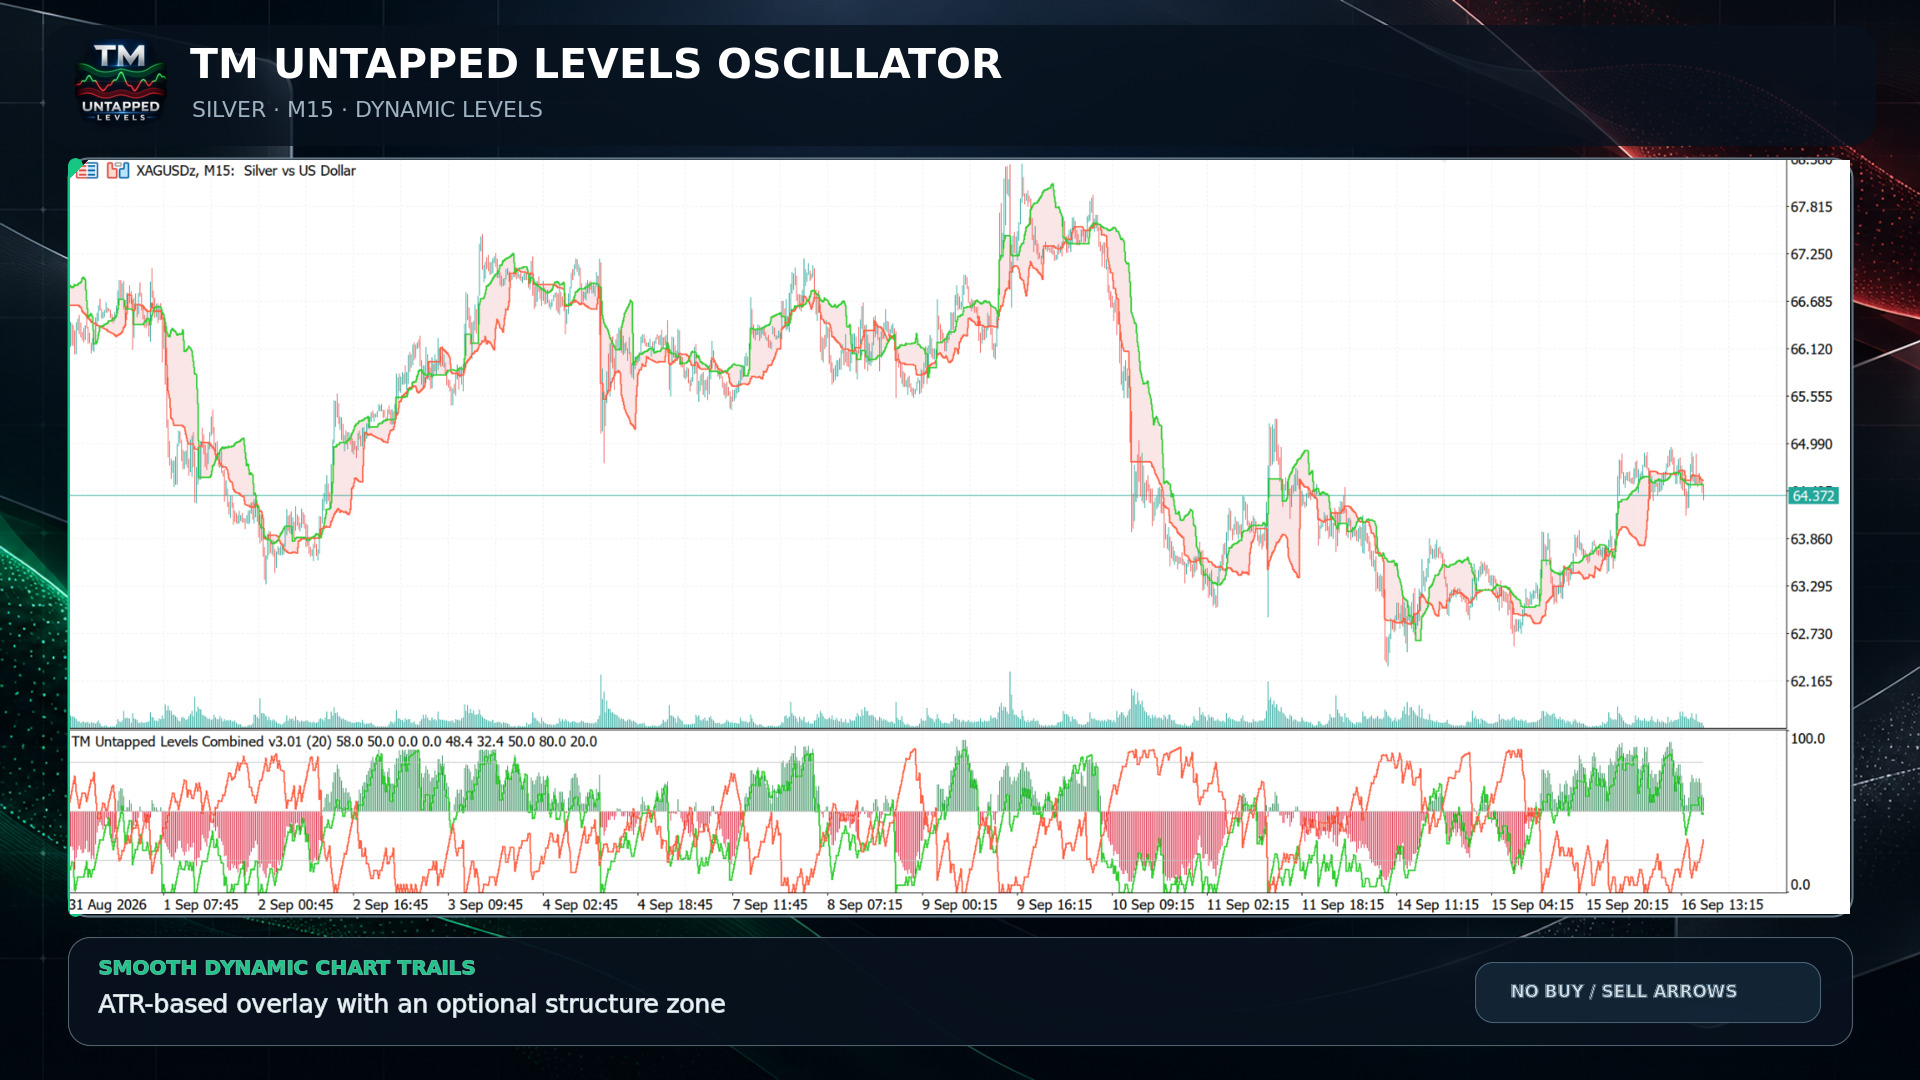
The main-chart component uses volatility-adjusted calculations to display smooth bullish and bearish trails around price.
These trails can help traders recognise:
-
Developing directional structure
-
Potential trend continuation
-
Periods of compression or balance
-
Changes in short-term market control
-
Areas where oscillator confirmation may be useful
An optional shaded zone can also be displayed to make the relationship between price and the dynamic trails easier to read.
How the histogram helps
The histogram provides another way to interpret the difference between bullish and bearish pressure.
A stronger green histogram suggests that bullish pressure has gained relative strength. A stronger red histogram suggests that bearish pressure is dominant.
The histogram should not be considered a standalone entry signal. It is better used as confirmation alongside:
-
Price structure
-
The two oscillator lines
-
Dynamic chart trails
-
Support and resistance
-
The broader market trend
Multi-market and multi-timeframe use
TM Untapped Levels Oscillator is designed to work across different MetaTrader 5 symbols and timeframes.
It can be applied to:
-
Forex
-
Gold and silver
-
Stock indices
-
Cryptocurrencies
-
Energy markets
-
Other instruments supported by an MT5 broker
Lower timeframes normally produce faster changes and more market noise. Higher timeframes generally provide smoother structural readings but fewer transitions.
Traders should adjust the indicator settings according to the volatility and behaviour of the selected market.
Suggested method of interpretation
The indicator does not display Buy or Sell arrows. This is intentional.
A complete trading decision should not depend on one arrow or one crossover. Instead, traders can create their own confirmation process.
A possible bullish observation may include:
-
Price holding above the bullish chart trail
-
Bullish oscillator pressure rising
-
Bearish pressure weakening
-
A positive or expanding histogram
-
Confirmation from market structure
A possible bearish observation may include:
-
Price holding below the bearish chart trail
-
Bearish oscillator pressure rising
-
Bullish pressure weakening
-
A negative or expanding bearish histogram
-
Confirmation from market structure
These conditions are examples of interpretation—not guaranteed trading signals.
Flexible settings
The indicator includes adjustable parameters so it can be adapted to different trading styles.
Users can control settings related to:
-
Calculation length
-
Smoothing
-
Dynamic trail behaviour
-
Oscillator thresholds
-
Colours and visual appearance
-
Chart-zone visibility
-
Alerts
-
Historical calculation depth
Increasing smoothing can create steadier lines but may introduce more delay. Reducing smoothing can make the indicator react faster but may also increase noise.
Who may find it useful?
TM Untapped Levels Oscillator may be useful for:
-
Trend-following traders
-
Intraday traders
-
Swing traders
-
Market-structure analysts
-
Traders who use confirmation-based systems
-
Traders who prefer visual tools without automatic trade arrows
It can also be combined with independent methods such as support and resistance, trendlines, Elliott Wave analysis, moving averages or price-action confirmation.
Download TM Untapped Levels Oscillator
TM Untapped Levels Oscillator is available free for MetaTrader 5.
Download it here:
https://www.mql5.com/en/market/product/196347
Install the indicator, test it on your preferred symbols and timeframes, and adjust the inputs according to your trading approach.
Feedback and constructive suggestions are welcome. If you test the indicator, share which market and timeframe you used and how the oscillator behaved under those conditions.
Important: This indicator is a technical-analysis tool and does not guarantee profitable results. Always apply independent analysis and appropriate risk management.