
$2.3M in One Mode, 91% Win Rate in Another: The Full Diamond Scalper Backtest

"No hype. No empty promises." isn't just a slogan on the Diamond Scalper sales page - this article backs it up with real numbers. Instead of showing only the prettiest equity curve, we backtested all 11 Trading Modes under the exact same conditions and the same time period, so you can compare them yourself and pick the mode that best fits your risk appetite and trading style.
Note: Download the full backtest report from the Attachments section below.
Backtest Conditions
| Symbol | XAUUSD (Gold) |
| Chart Period | M1 |
| Model | Every tick based on real ticks |
| Broker / historical data source | VantageFX |
| Test period | 01/01/2025 — present |
| Initial Deposit | $10,000 |
| Leverage | 1:500 |
| Spread | Current (based on VantageFX real tick data) |
| Money Management | Fixed Risk 2% / trade (kept constant across every mode so Mode is the only variable) |
| Strategies applied | All 3 strategies at once (Strategy 1 + 2 + 3 all enabled) - the only variable across the 11 test runs is the Trading Mode, so buyers can clearly see which mode to pick when running the full set of 3 strategies |
All 11 tests use the same base set file, changing only the Trading Mode parameter - so any difference in results between modes reflects that mode's own nature, not noise from anything else.
Why the 2025 - present period? This isn't a cherry-picked stretch chosen to look good: it has already gone through the market's main phases - a very strong rally, followed by a correction/pullback, and currently a sideways range. For a rule set with no martingale/grid, this is a fairly complete stress test of adaptability across different trend phases within a short window.
Backtest expansion plan: For an even more rigorous, standard backtest suite, we plan to run a deeper backtest covering 2020-2024 - a much longer window spanning multiple distinct up/down/sideways cycles of Gold. Results from this extended test will be added to this article once complete, giving a fuller picture of all 11 modes' performance beyond just one recent market cycle.
Summary Comparison of All 11 Modes
| Mode | Display Name | Net Profit | Profit Factor | Max Drawdown % | Win Rate | Trades | Recovery Factor |
| 1 | Precision Scalper (Tightest) | $152,739.57 | 3.30 | 11.37% | 82.80% | 558 | 27.31 |
| 2 | Rapid Scalper | $155,730.09 | 3.43 | 6.77% | 85.74% | 554 | 26.30 |
| 3 | Classic Scalper | $106,210.97 | 3.17 | 7.94% | 86.52% | 549 | 28.80 |
| 4 | Active Trader | $83,313.98 | 3.02 | 7.78% | 86.76% | 544 | 15.74 |
| 5 | Balanced Trader | $63,584.37 | 2.70 | 8.21% | 87.94% | 539 | 10.71 |
| 6 | Swing Trader | $51,330.48 | 2.41 | 9.56% | 88.17% | 541 | 9.81 |
| 7 | Intraday Trader | $39,090.20 | 2.46 | 6.64% | 90.30% | 536 | 11.68 |
| 8 | Momentum Trader | $34,553.59 | 2.52 | 7.55% | 91.29% | 528 | 10.63 |
| 9 | Extended Session Trader | $17,426.55 | 1.98 | 10.23% | 90.21% | 521 | 5.64 |
| 10 | Position Trader (Widest) | $12,551.26 | 1.69 | 9.62% | 87.84% | 510 | 7.21 |
| 11 | Breakout Elite * | $2,340,037.82 | 4.19 | 15.51% | 67.26% | 559 | 27.80 |
* Mode 11 uses a completely different, asymmetric SL/TP structure than the other 10 modes, so its Net Profit figure cannot be compared on the same scale - see the detailed explanation under Mode 11 below before drawing conclusions.
Mode-by-Mode Detail
Mode 1 — Precision Scalper (Tightest)
The tightest mode of all 11 - the shortest SL/TP/trailing distance, suited to high-frequency scalping with quick entries and exits.
Strategy Tester Results — Mode 1: Precision Scalper (Tightest)
| History Quality | 100% |
| Initial Deposit | $10,000.00 |
| Total Net Profit | $152,739.57 |
| Gross Profit / Gross Loss | $219,163.32 / -$66,423.75 |
| Profit Factor | 3.30 |
| Recovery Factor | 27.31 |
| Expected Payoff | $273.73 |
| Sharpe Ratio | 93.85 |
| Balance Drawdown Maximal | $3,342.72 (2.06%) |
| Equity Drawdown Maximal | $5,593.41 (4.19%) |
| Equity Drawdown Relative | 11.37% ($2,176.35) |
| Total Trades / Total Deals | 558 / 1,116 |
| Profit Trades (Win Rate) | 462 (82.80%) |
| Loss Trades | 96 (17.20%) |
| Short Trades (won %) | 224 (81.25%) |
| Long Trades (won %) | 334 (83.83%) |
| Largest profit / loss trade | $3,962.06 / -$3,278.46 |
| Average profit / loss trade | $474.38 / -$645.41 |
| Max consecutive wins | 27 trades ($27,471.49) |
| Max consecutive losses | 3 trades (-$1,627.37) |
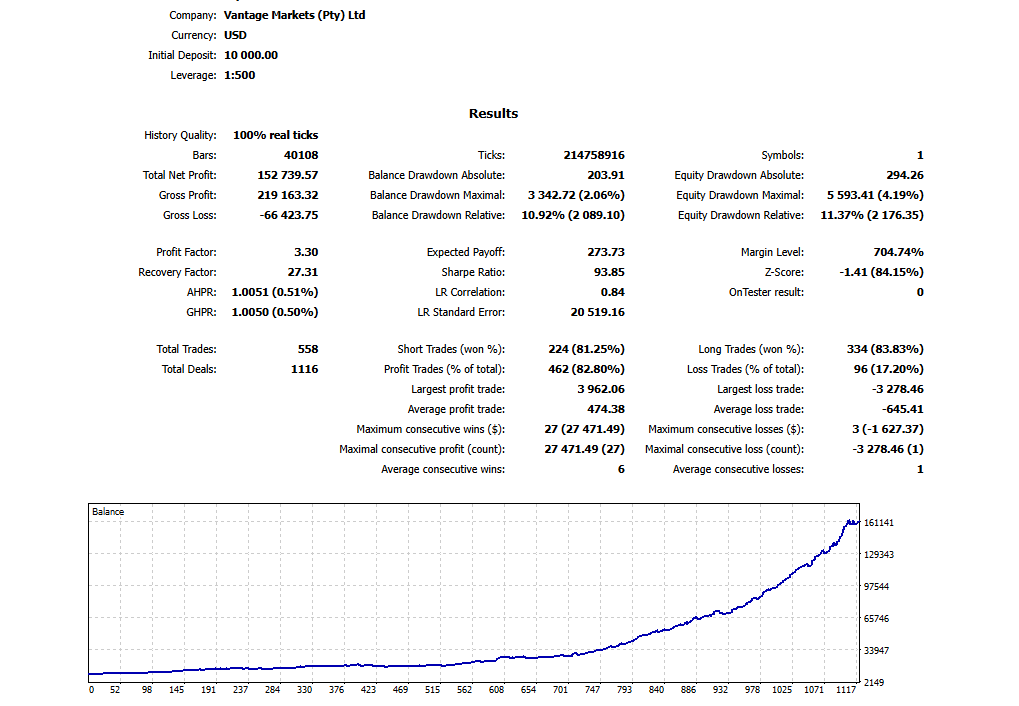
Analysis: Precision Scalper delivers a very high win rate (82.80%) and Profit Factor/Recovery Factor among the strongest in the whole range (3.30 and 27.31) - meaning the profit generated relative to the losses/drawdown incurred is highly efficient. Worth noting: the average losing trade (-$645.41) is larger than the average winning trade ($474.38) - a typical trait of a tight SL/TP mode: most winners close quickly at a small target, while the few losers tend to run the full stop distance. This mode's edge comes from a very high win frequency, not from a large per-trade reward-to-risk ratio. An Equity Drawdown Relative of 11.37% is acceptable for the "tightest" mode, suiting traders who want high trading frequency and minimal exposure to prolonged losing trades.
Mode 2 — Rapid Scalper
One step wider than Mode 1 - still a fast scalping style, but with a slightly larger SL/TP/trailing distance.
Strategy Tester Results — Mode 2: Rapid Scalper
| History Quality | 100% |
| Initial Deposit | $10,000.00 |
| Total Net Profit | $155,730.09 |
| Gross Profit / Gross Loss | $219,739.72 / -$64,009.63 |
| Profit Factor | 3.43 |
| Recovery Factor | 26.30 |
| Expected Payoff | $281.10 |
| Sharpe Ratio | 80.68 |
| Balance Drawdown Maximal | $5,305.41 (4.06%) |
| Equity Drawdown Maximal | $5,921.12 (4.51%) |
| Equity Drawdown Relative | 6.77% ($1,004.33) |
| Total Trades / Total Deals | 554 / 1,108 |
| Profit Trades (Win Rate) | 475 (85.74%) |
| Loss Trades | 79 (14.26%) |
| Short Trades (won %) | 223 (86.55%) |
| Long Trades (won %) | 331 (85.20%) |
| Largest profit / loss trade | $3,731.40 / -$3,389.20 |
| Average profit / loss trade | $462.61 / -$768.29 |
| Max consecutive wins | 47 trades ($45,877.27) |
| Max consecutive losses | 3 trades (-$2,267.24) |
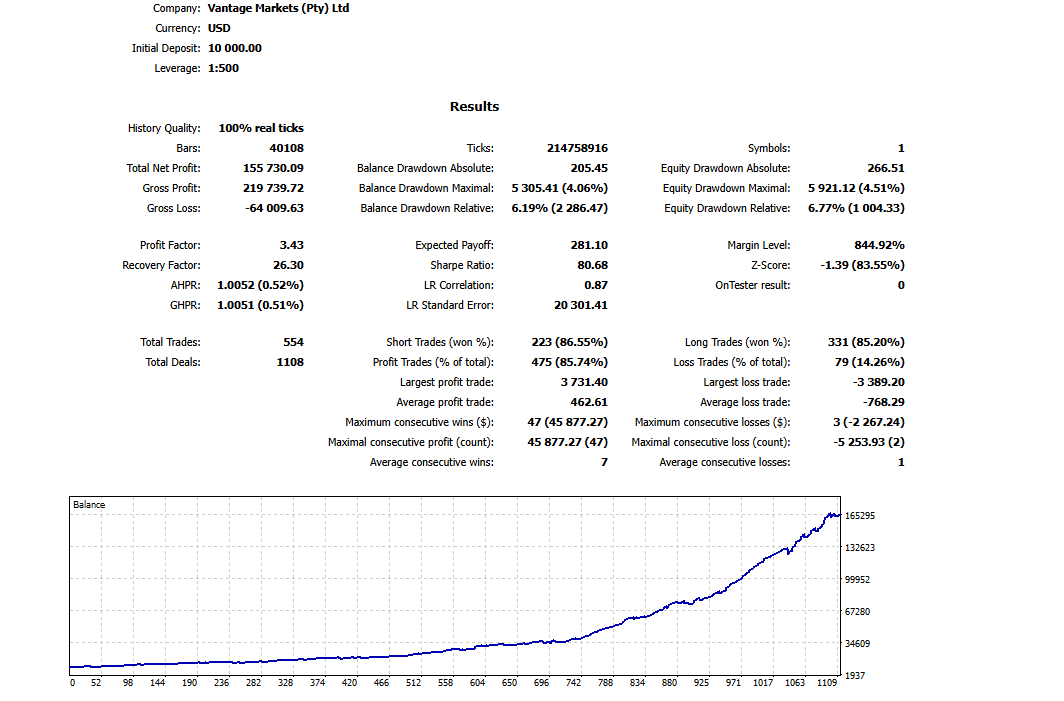
Analysis: Compared with Mode 1, Rapid Scalper improves on almost every front: a higher win rate (85.74% vs 82.80%), a slightly better Profit Factor (3.43 vs 3.30), and notably a much lower Equity Drawdown Relative at 6.77% (vs 11.37% in Mode 1) - a visibly smoother equity curve while still keeping a high-frequency scalping style (554 trades, close to Mode 1). In exchange, the per-trade profit/loss range widens: the average losing trade grows to -$768.29 (vs -$645.41), while the average winning trade stays almost flat ($462.61) - so the loss/win ratio is slightly worse than Mode 1's, but fully offset by the lower drawdown and an impressive winning streak (47 consecutive winning trades). This is the mode that shows the best balance between high trading frequency and equity-curve stability.
Mode 3 — Classic Scalper
The standard scalping mode - one notch wider SL/TP/trailing than Mode 1 and 2.
Strategy Tester Results — Mode 3: Classic Scalper
| History Quality | 100% |
| Initial Deposit | $10,000.00 |
| Total Net Profit | $106,210.97 |
| Gross Profit / Gross Loss | $155,190.27 / -$48,979.30 |
| Profit Factor | 3.17 |
| Recovery Factor | 28.80 |
| Expected Payoff | $193.46 |
| Sharpe Ratio | 65.63 |
| Balance Drawdown Maximal | $2,979.18 (2.56%) |
| Equity Drawdown Maximal | $3,687.36 (3.30%) |
| Equity Drawdown Relative | 7.94% ($1,115.40) |
| Total Trades / Total Deals | 549 / 1,098 |
| Profit Trades (Win Rate) | 475 (86.52%) |
| Loss Trades | 74 (13.48%) |
| Short Trades (won %) | 221 (85.97%) |
| Long Trades (won %) | 328 (86.89%) |
| Largest profit / loss trade | $2,334.70 / -$2,370.68 |
| Average profit / loss trade | $326.72 / -$635.11 |
| Max consecutive wins | 29 trades ($19,509.43) |
| Max consecutive losses | 3 trades (-$825.07) |
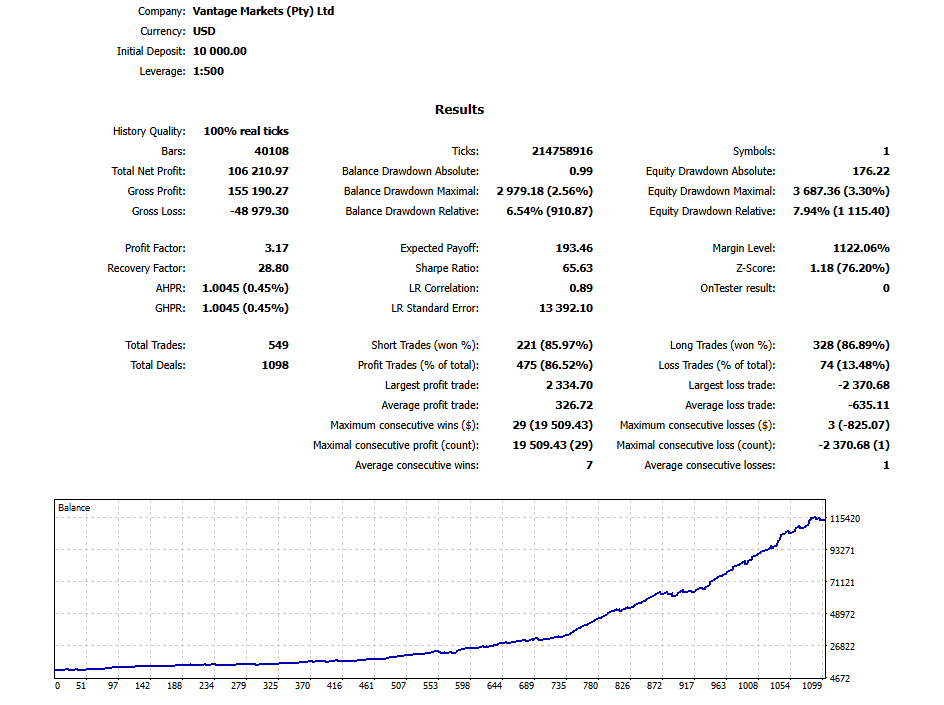
Analysis: Classic Scalper posts the highest win rate of the first three modes (86.52%), yet Net Profit comes in noticeably lower than Mode 1 and 2 ($106,210.97 vs $152,739.57 and $155,730.09) - because the average winning trade drops sharply to just $326.72 (vs roughly $460-470 in the two prior modes), while the average losing trade stays about the same (-$635.11). In other words, this mode wins more often but each win "earns" less, so total profit is lower despite the better win rate. In return, it has the highest Recovery Factor so far (28.80) and a much smaller single largest loss (-$2,370.68 vs over -$3,200 in Mode 1-2) - suiting traders who prioritize stability and lower volatility over maximizing absolute profit.
Mode 4 — Active Trader
Enters the "middle" region of the mode range - SL/TP/trailing distance clearly wider than the pure scalping group (Mode 1-3).
Strategy Tester Results — Mode 4: Active Trader
| History Quality | 100% |
| Initial Deposit | $10,000.00 |
| Total Net Profit | $83,313.98 |
| Gross Profit / Gross Loss | $124,628.86 / -$41,314.88 |
| Profit Factor | 3.02 |
| Recovery Factor | 15.74 |
| Expected Payoff | $153.15 |
| Sharpe Ratio | 57.99 |
| Balance Drawdown Maximal | $4,804.37 (4.99%) |
| Equity Drawdown Maximal | $5,293.78 (5.47%) |
| Equity Drawdown Relative | 7.78% ($1,032.10) |
| Total Trades / Total Deals | 544 / 1,088 |
| Profit Trades (Win Rate) | 472 (86.76%) |
| Loss Trades | 72 (13.24%) |
| Short Trades (won %) | 218 (85.32%) |
| Long Trades (won %) | 326 (87.73%) |
| Largest profit / loss trade | $1,888.34 / -$2,170.71 |
| Average profit / loss trade | $264.04 / -$553.64 |
| Max consecutive wins | 29 trades ($14,166.35) |
| Max consecutive losses | 3 trades (-$769.17) |
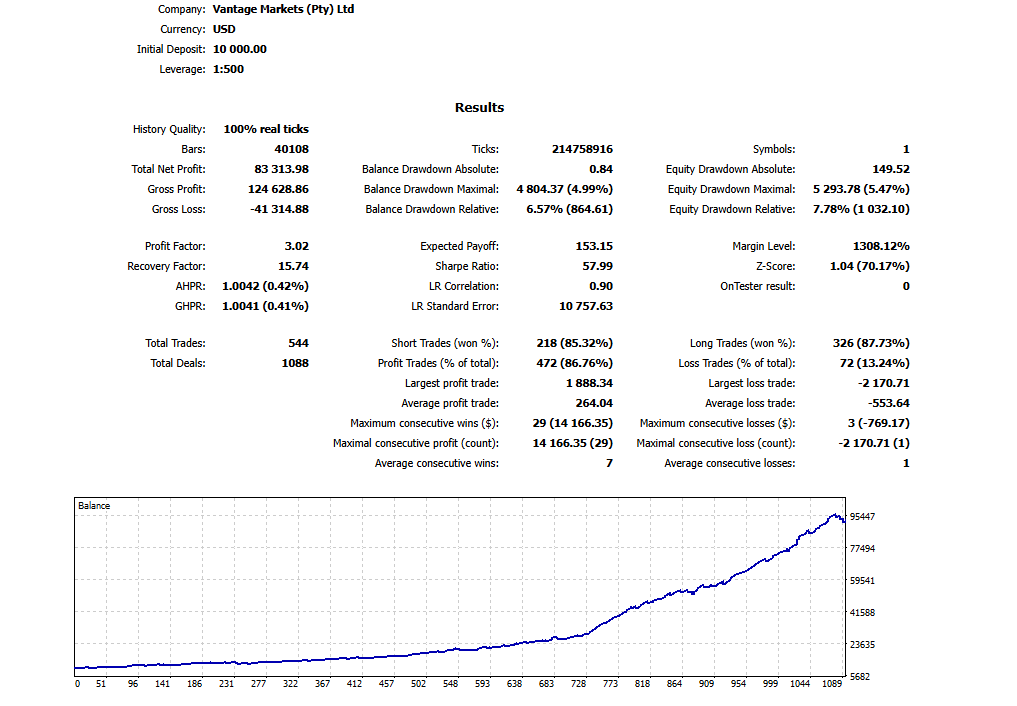
Analysis: Win rate keeps climbing, reaching the highest of the first four modes (86.76%), but the declining trend in Net Profit and Recovery Factor already visible since Mode 3 is now even clearer: Net Profit falls to $83,313.98 (vs the $155,730.09 peak in Mode 2) and Recovery Factor drops sharply to 15.74 (vs 28.80 in Mode 3). The main driver is the average winning trade shrinking further (down to just $264.04, over 40% lower than Mode 3), while the average losing trade declines much more slowly (-$553.64). This is an important signal for the whole mode range: as SL/TP widens, win rate tends to rise, but the profit margin per winning trade shrinks faster than losses shrink - causing overall efficiency (Net Profit, Recovery Factor) to peak early around Mode 2-3, then decline from Mode 4 onward in this dataset.
Mode 5 — Balanced Trader
Widens further from Mode 4 - true to its name, aiming for a balance between trading frequency and stop distance.
Strategy Tester Results — Mode 5: Balanced Trader
| History Quality | 100% |
| Initial Deposit | $10,000.00 |
| Total Net Profit | $63,584.37 |
| Gross Profit / Gross Loss | $100,941.02 / -$37,356.65 |
| Profit Factor | 2.70 |
| Recovery Factor | 10.71 |
| Expected Payoff | $117.97 |
| Sharpe Ratio | 50.94 |
| Balance Drawdown Maximal | $5,610.81 (7.19%) |
| Equity Drawdown Maximal | $5,937.03 (7.58%) |
| Equity Drawdown Relative | 8.21% ($1,117.40) |
| Total Trades / Total Deals | 539 / 1,078 |
| Profit Trades (Win Rate) | 474 (87.94%) |
| Loss Trades | 65 (12.06%) |
| Short Trades (won %) | 214 (85.98%) |
| Long Trades (won %) | 325 (89.23%) |
| Largest profit / loss trade | $1,306.65 / -$1,677.36 |
| Average profit / loss trade | $212.96 / -$557.83 |
| Max consecutive wins | 29 trades ($11,244.17) |
| Max consecutive losses | 3 trades (-$4,825.16) |
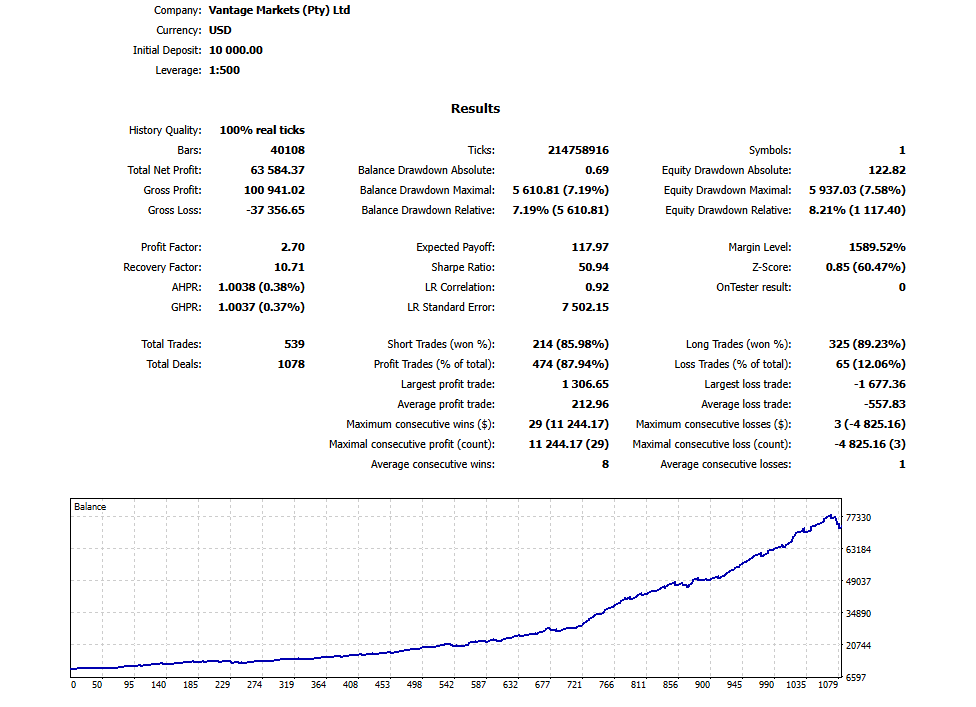
Analysis: Win rate sets a new high again (87.94%), but the overall efficiency decline seen since Mode 4 clearly continues: Net Profit falls to $63,584.37, Profit Factor drops to 2.70 (the lowest so far), and Recovery Factor is down to just 10.71 - less than half of Mode 3's. The average winning trade keeps shrinking sharply, down to $212.96 (less than half of Mode 3's). Most notable: the worst consecutive-loss streak (3 trades) jumps to -$4,825.16, versus only -$769.17 in Mode 4 - this mode's volatility is markedly higher even though overall drawdown (8.21%) stays moderate. This is a sign that the "balanced" mode group trades away per-winning-trade profit for a wider stop, but must accept larger swings within individual trade clusters.
Mode 6 — Swing Trader
The widest mode in the "Balanced Trader" group (4-6) - closing out this group before moving into the wider Intraday range (7-10).
Strategy Tester Results — Mode 6: Swing Trader
| History Quality | 100% |
| Initial Deposit | $10,000.00 |
| Total Net Profit | $51,330.48 |
| Gross Profit / Gross Loss | $87,819.93 / -$36,489.45 |
| Profit Factor | 2.41 |
| Recovery Factor | 9.81 |
| Expected Payoff | $94.88 |
| Sharpe Ratio | 43.46 |
| Balance Drawdown Maximal | $4,933.81 (7.54%) |
| Equity Drawdown Maximal | $5,231.76 (7.96%) |
| Equity Drawdown Relative | 9.56% ($1,361.42) |
| Total Trades / Total Deals | 541 / 1,082 |
| Profit Trades (Win Rate) | 477 (88.17%) |
| Loss Trades | 64 (11.83%) |
| Short Trades (won %) | 214 (87.38%) |
| Long Trades (won %) | 327 (88.69%) |
| Largest profit / loss trade | $1,406.16 / -$1,415.73 |
| Average profit / loss trade | $184.11 / -$556.52 |
| Max consecutive wins | 34 trades ($1,957.61) |
| Max consecutive losses | 3 trades (-$4,064.10) |
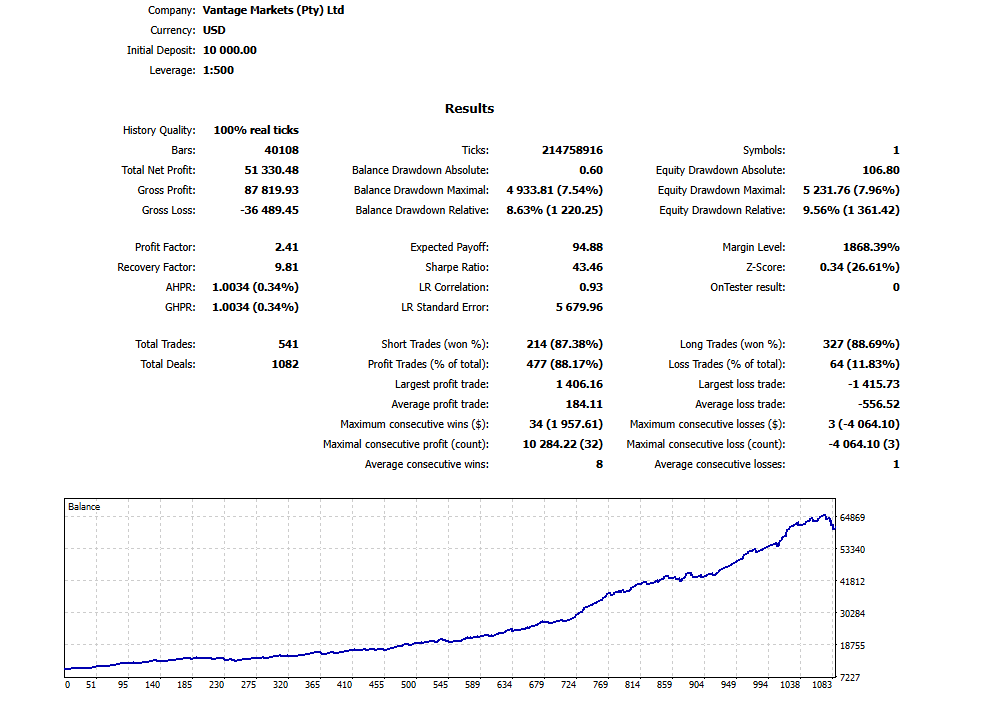
Analysis: Win rate sets a new record for the whole test range so far (88.17%), but this is also the mode with the lowest Profit Factor (2.41) and Recovery Factor (9.81) among the 6 modes tested so far. The average winning trade keeps shrinking to $184.11 - roughly a third of the peak seen in Mode 1-2 - while the average losing trade stays nearly flat (-$556.52). One bright spot: the single largest loss drops to the lowest level across all 6 modes (-$1,415.73), showing individual-trade volatility is better controlled here. Overall, the Mode 4-6 group closes out with a clear pattern: the wider the SL/TP within this "balanced" range, the higher the win rate, but per-trade profitability shrinks faster than risk does - the Mode 1-3 group is still showing far better capital efficiency through Mode 6.
Mode 7 — Intraday Trader
The first mode in the "Intraday / Prop-Firm-friendly" group (7-10) - SL/TP/trailing distance noticeably wider than the Mode 4-6 group.
Strategy Tester Results — Mode 7: Intraday Trader
| History Quality | 100% |
| Initial Deposit | $10,000.00 |
| Total Net Profit | $39,090.20 |
| Gross Profit / Gross Loss | $65,936.97 / -$26,846.77 |
| Profit Factor | 2.46 |
| Recovery Factor | 11.68 |
| Expected Payoff | $72.93 |
| Sharpe Ratio | 36.96 |
| Balance Drawdown Maximal | $3,175.03 (6.14%) |
| Equity Drawdown Maximal | $3,346.80 (6.45%) |
| Equity Drawdown Relative | 6.64% ($2,556.33) |
| Total Trades / Total Deals | 536 / 1,072 |
| Profit Trades (Win Rate) | 484 (90.30%) |
| Loss Trades | 52 (9.70%) |
| Short Trades (won %) | 213 (88.26%) |
| Long Trades (won %) | 323 (91.64%) |
| Largest profit / loss trade | $838.84 / -$1,073.88 |
| Average profit / loss trade | $136.23 / -$504.78 |
| Max consecutive wins | 33 trades ($1,884.80) |
| Max consecutive losses | 3 trades (-$3,165.76) |
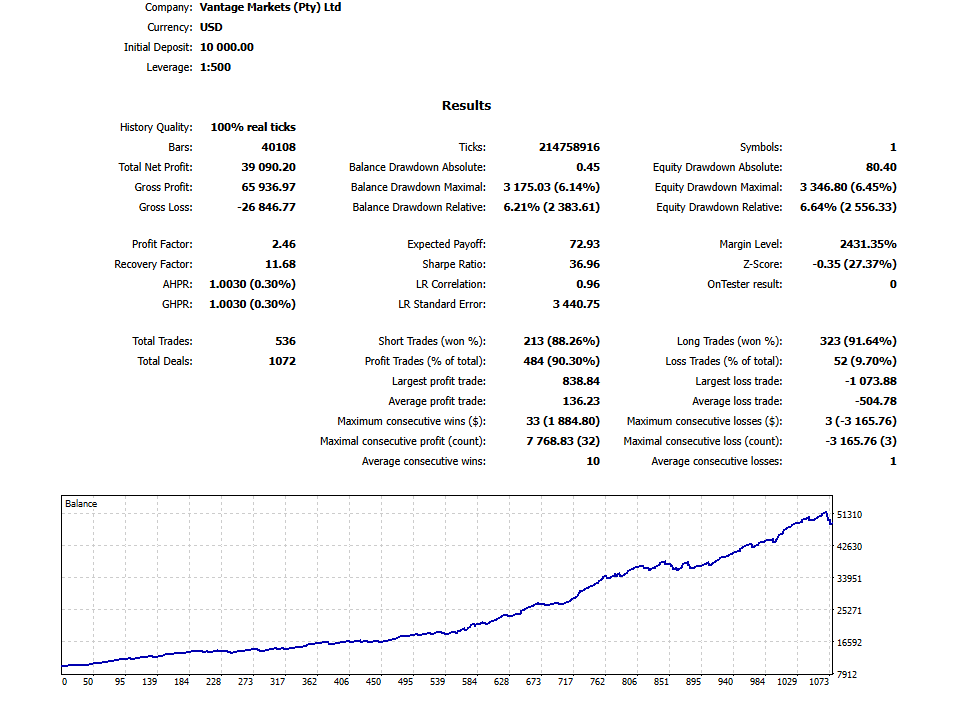
Analysis: Mode 7 marks a turning point after the continuous decline seen from Mode 3-6: this is the first mode to break the 90% win-rate mark (90.30%), while Profit Factor (2.46) and Recovery Factor (11.68) both improve again compared with Mode 6 (2.41 and 9.81) - even though Net Profit keeps declining as expected ($39,090.20). Most notably, Equity Drawdown Relative drops sharply to 6.64% - better than Mode 6 (9.56%) and second only to Mode 2 (6.77%) across all 7 modes tested so far. This result matches the earlier prediction in the "Choosing a Mode by Broker Spread Quality" section above: the Mode 7-10 group has a stop distance wide enough to keep the equity curve noticeably smoother, less disturbed by short-term volatility - closer to the kind of risk profile many prop firms favor.
Mode 8 — Momentum Trader
Widens further than Mode 7 within the Intraday group.
Strategy Tester Results — Mode 8: Momentum Trader
| History Quality | 100% |
| Initial Deposit | $10,000.00 |
| Total Net Profit | $34,553.59 |
| Gross Profit / Gross Loss | $57,257.51 / -$22,703.92 |
| Profit Factor | 2.52 |
| Recovery Factor | 10.63 |
| Expected Payoff | $65.44 |
| Sharpe Ratio | 31.83 |
| Balance Drawdown Maximal | $2,854.28 (6.07%) |
| Equity Drawdown Maximal | $3,250.28 (6.86%) |
| Equity Drawdown Relative | 7.55% ($2,599.53) |
| Total Trades / Total Deals | 528 / 1,056 |
| Profit Trades (Win Rate) | 482 (91.29%) |
| Loss Trades | 46 (8.71%) |
| Short Trades (won %) | 210 (91.90%) |
| Long Trades (won %) | 318 (90.88%) |
| Largest profit / loss trade | $763.56 / -$958.72 |
| Average profit / loss trade | $118.79 / -$483.49 |
| Max consecutive wins | 56 trades ($7,676.56) |
| Max consecutive losses | 3 trades (-$2,819.20) |
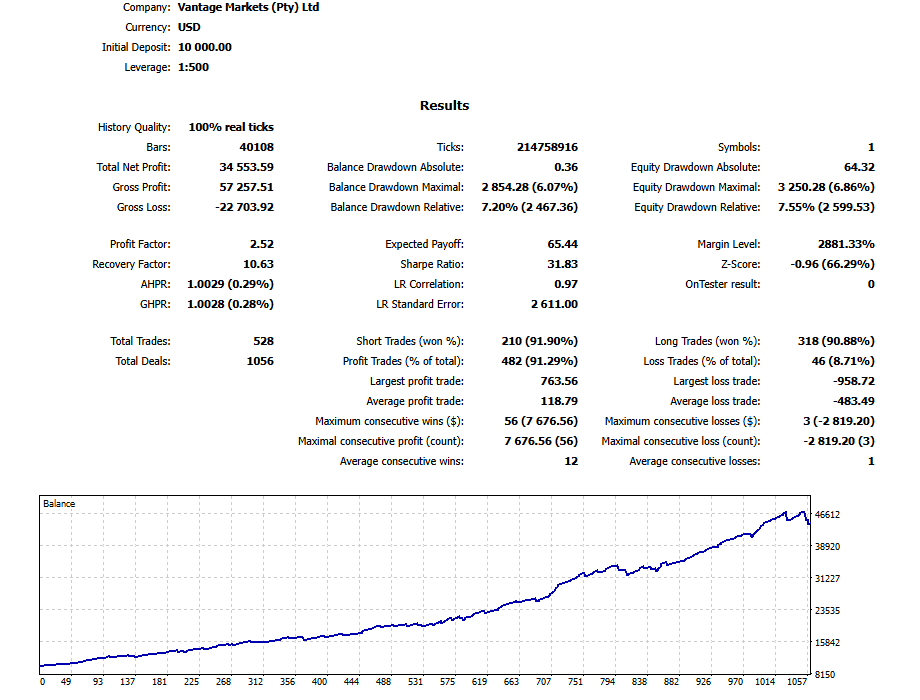
Analysis: Win rate keeps rising to 91.29% - the highest of the 8 modes tested so far - and Profit Factor also edges up to 2.52 (vs 2.46 in Mode 7), showing the Intraday group (7-10) is holding onto its stability advantage over the Mode 3-6 group. The most striking result: the longest winning streak of the whole test so far - 56 consecutive winning trades (nearly double Mode 7's previous record of 33). Recovery Factor eases slightly to 10.63 as Net Profit continues its expected decline ($34,553.59). Both the average winning and losing trade shrink together for the first time in the range, keeping the win/loss ratio fairly stable around the same level as Mode 7.
Mode 9 — Extended Session Trader
The second-widest mode across all 10 main modes - only Mode 10 (Position Trader) is wider.
Strategy Tester Results — Mode 9: Extended Session Trader
| History Quality | 100% |
| Initial Deposit | $10,000.00 |
| Total Net Profit | $17,426.55 |
| Gross Profit / Gross Loss | $35,299.72 / -$17,873.17 |
| Profit Factor | 1.98 |
| Recovery Factor | 5.64 |
| Expected Payoff | $33.45 |
| Sharpe Ratio | 17.94 |
| Balance Drawdown Maximal | $2,584.32 (8.65%) |
| Equity Drawdown Maximal | $3,088.44 (10.23%) |
| Equity Drawdown Relative | 10.23% ($3,088.44) |
| Total Trades / Total Deals | 521 / 1,042 |
| Profit Trades (Win Rate) | 470 (90.21%) |
| Loss Trades | 51 (9.79%) |
| Short Trades (won %) | 207 (90.34%) |
| Long Trades (won %) | 314 (90.13%) |
| Largest profit / loss trade | $625.26 / -$596.97 |
| Average profit / loss trade | $75.11 / -$345.58 |
| Max consecutive wins | 49 trades ($3,828.30) |
| Max consecutive losses | 2 trades (-$1,192.05) |
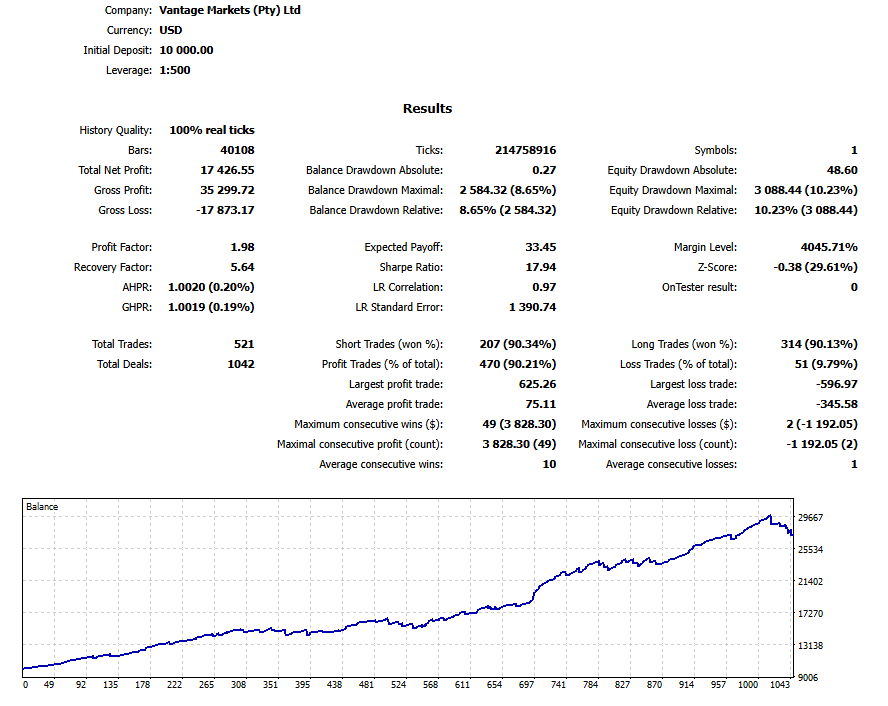
Analysis: This is the first mode in the whole test range to show a clear weakening across almost every metric at once, not just Net Profit: Profit Factor drops below the 2.0 threshold for the first time (1.98), Recovery Factor falls sharply to 5.64 (the lowest so far), and notably Equity Drawdown Relative jumps to 10.23% - the highest across all 9 modes tested, surpassed only by Mode 1 (11.37%). Win rate also stalls, easing slightly to 90.21% after repeatedly setting new highs in Mode 7-8. Net Profit falls sharply to just $17,426.55 - less than half of Mode 8's. This data shows that within the Intraday group (7-10), the stability advantage does not scale linearly with widening SL/TP - Mode 7-8 turns out to be this group's true sweet spot, while Mode 9 starts showing signs of being "too wide," with efficiency falling while risk rises.
Mode 10 — Position Trader (Widest)
The widest of the 10 main modes - the largest SL/TP/trailing distance, aimed at the longest-hold trading style in the test range.
Strategy Tester Results — Mode 10: Position Trader (Widest)
| History Quality | 100% |
| Initial Deposit | $10,000.00 |
| Total Net Profit | $12,551.26 |
| Gross Profit / Gross Loss | $30,694.35 / -$18,143.09 |
| Profit Factor | 1.69 |
| Recovery Factor | 7.21 |
| Expected Payoff | $24.61 |
| Sharpe Ratio | 10.23 |
| Balance Drawdown Maximal | $1,547.13 (7.52%) |
| Equity Drawdown Maximal | $1,740.39 (8.44%) |
| Equity Drawdown Relative | 9.62% ($1,499.54) |
| Total Trades / Total Deals | 510 / 1,020 |
| Profit Trades (Win Rate) | 448 (87.84%) |
| Loss Trades | 62 (12.16%) |
| Short Trades (won %) | 199 (87.44%) |
| Long Trades (won %) | 311 (88.10%) |
| Largest profit / loss trade | $425.88 / -$468.30 |
| Average profit / loss trade | $68.51 / -$290.08 |
| Max consecutive wins | 48 trades ($2,757.65) |
| Max consecutive losses | 3 trades (-$711.00) |
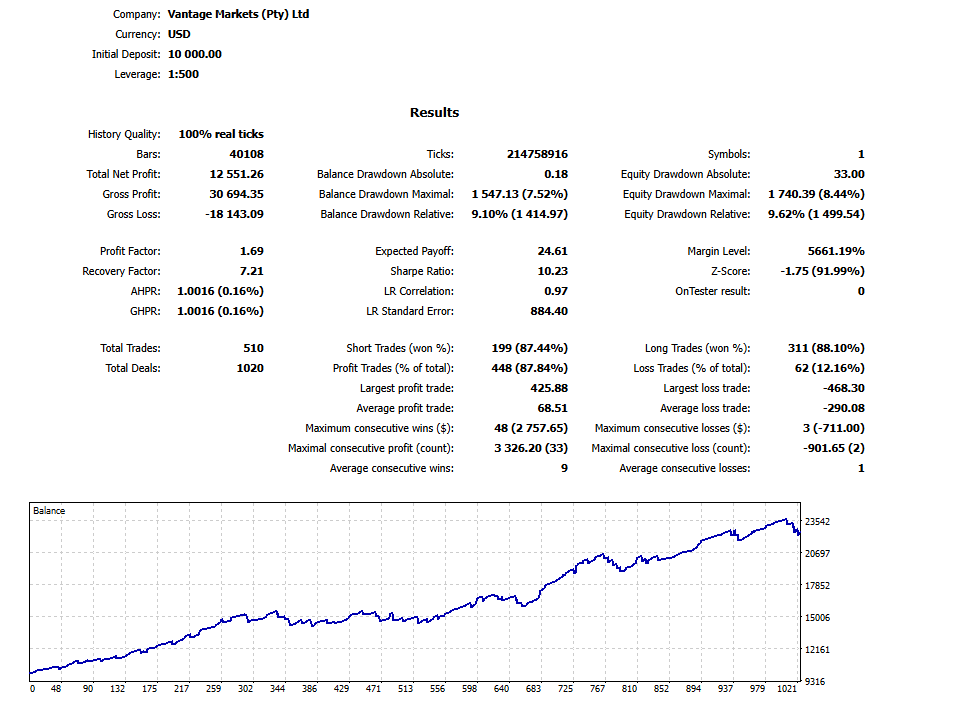
Analysis: Position Trader closes out the 10 main modes with the lowest Profit Factor of the whole test (1.69) and the lowest Net Profit (just $12,551.26 - less than 1/12th of the peak in Mode 2). Notably, win rate drops for the first time instead of rising versus the mode right before it (87.84% vs 90.21% in Mode 9) - breaking the pattern of steadily rising win rate seen throughout Mode 1-9. The one bright spot: Recovery Factor ticks up slightly to 7.21 (vs 5.64 in Mode 9) thanks to a small drawdown improvement. Looking at the whole Mode 7-10 group: Mode 7 and 8 remain the best balance point of the Intraday group - moving into Mode 9-10, both profitability and stability decline together, showing that pushing SL/TP even wider no longer pays off for Diamond Scalper's 3-strategy combination over the market period tested.
Mode 11 — Breakout Elite
A completely different profile from the other 10 modes: a tight stop paired with a far take-profit target (asymmetric), dedicated to the breakout modules (Strategy 2 and 3). Because its SL/TP structure is fundamentally different, this mode's results should not be compared directly on the same scale as Mode 1-10.
Strategy Tester Results — Mode 11: Breakout Elite
| History Quality | 100% |
| Initial Deposit | $10,000.00 |
| Total Net Profit | $2,340,037.82 |
| Gross Profit / Gross Loss | $3,072,828.24 / -$732,790.42 |
| Profit Factor | 4.19 |
| Recovery Factor | 27.80 |
| Expected Payoff | $4,186.11 |
| Sharpe Ratio | 89.83 |
| Balance Drawdown Maximal | $66,859.79 (8.74%) |
| Equity Drawdown Maximal | $84,177.82 (10.77%) |
| Equity Drawdown Relative | 15.51% ($2,674.42) |
| Total Trades / Total Deals | 559 / 1,118 |
| Profit Trades (Win Rate) | 376 (67.26%) |
| Loss Trades | 183 (32.74%) |
| Short Trades (won %) | 225 (64.00%) |
| Long Trades (won %) | 334 (69.46%) |
| Largest profit / loss trade | $97,900.00 / -$24,600.00 |
| Average profit / loss trade | $8,172.42 / -$3,773.45 |
| Max consecutive wins | 14 trades ($126,349.03) |
| Max consecutive losses | 5 trades (-$1,628.81) |
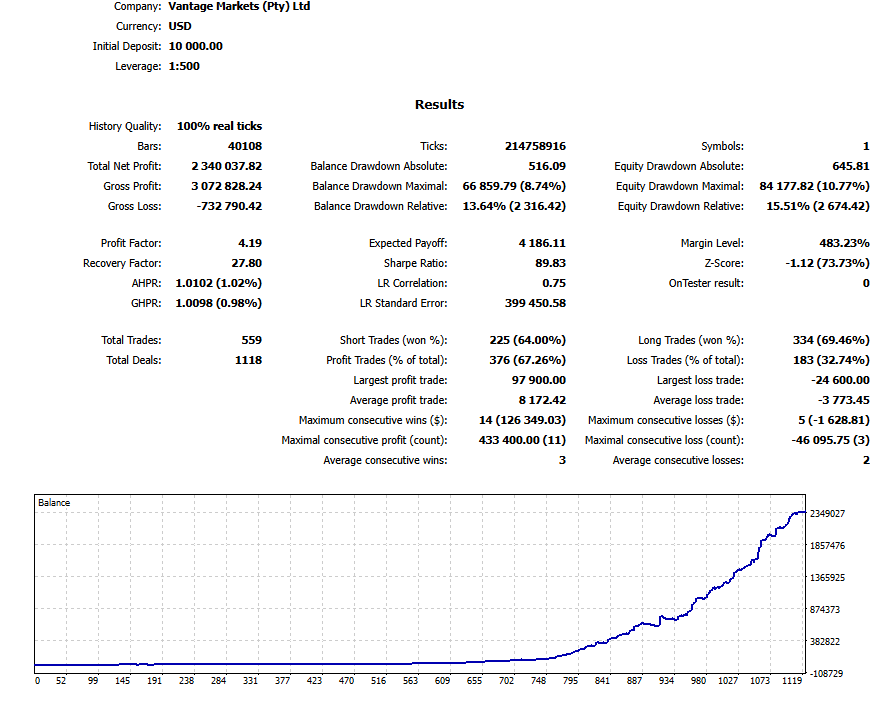
Important note - why this number is unusually large: A Net Profit of $2,340,037.82 (over 15 times Mode 1-2) does not mean Mode 11 is "15 times stronger" than the other modes. Two compounding factors explain this:
- The asymmetric structure: a tight stop plus a far take-profit target means every winning trade earns far more than every losing trade costs - clearly reflected in the average winning trade ($8,172.42), over twice the average losing trade (-$3,773.45), even though the win rate is the lowest of all 11 modes (67.26%, versus 82-91% for the other modes). The large reward-to-risk ratio compensates for winning less often.
- The compounding effect of Fixed Risk 2%: because this money-management method sizes risk as a percentage of the current balance (not a fixed dollar amount), as the account grew dramatically over the course of the test, position size - and therefore profit/loss in dollar terms - grew right along with it. This is why the largest single winning trade reaches $97,900 and the largest single losing trade reaches -$24,600, even though the test started with just $10,000 - these trades fall late in the test, once the account (under compounding) had grown far beyond its starting capital.
On real-world risk: Don't look at Net Profit alone - Mode 11's Equity Drawdown Relative is 15.51%, the highest of all 11 modes tested (surpassing even Mode 1's 11.37%). This is the most volatile mode in the whole test, suited to traders who accept higher risk in exchange for a much larger profit potential - it is not the "safe" choice. Because of its tight stop, this mode is also as sensitive to spread/slippage quality as the Mode 1-3 group - a broker with tight, stable XAUUSD spreads is preferable when running this mode. Traders should carefully weigh their personal risk appetite, and may want to test a lower risk % specifically for this mode to soften the absolute size of the swings as the account grows.
So Which Mode Should You Choose?
- High-frequency scalpers (Mode 1-3 — Precision Scalper, Rapid Scalper, Classic Scalper): This group delivers the highest Net Profit of the whole test (Mode 1-2 lead with $152,739 and $155,730), Profit Factor among the highest (3.17-3.43), and the highest trading frequency (549-558 trades). The trade-off: this is also the group most sensitive to execution cost (spread + slippage), since its SL/TP/padding distance is the tightest of all 11 modes in absolute terms.
- Balanced traders (Mode 4-6 — Active Trader, Balanced Trader, Swing Trader): The real data shows a very clear trend: win rate rises steadily (86.76% → 87.94% → 88.17%) while Net Profit falls sharply with each mode ($83,313 → $63,584 → $51,330), and Profit Factor + Recovery Factor decline continuously to the lowest levels among the scalping/balanced groups (PF down to 2.41, RF down to 9.81 at Mode 6). This is the "least efficient trade-off" region across the whole 10-mode range for the market period tested.
- Longer-hold traders / Prop-Firm-friendly (Mode 7-10 — Intraday Trader → Position Trader): The real data shows Mode 7-8 are the best balance point of the entire 10-mode range: win rate breaks 90% for the first time (90.30% and 91.29%), Equity Drawdown Relative is the lowest across the whole test after Mode 2 (6.64% and 7.55%), and Profit Factor recovers (2.46, 2.52) after the continuous decline through Mode 3-6. In contrast, Mode 9-10 show that SL/TP "too wide" no longer pays off: Profit Factor falls to the lowest of the whole test (1.98 and 1.69), Net Profit is the lowest (just $17,426 and $12,551), and Mode 9's Drawdown Relative (10.23%) is nearly as high as Mode 1 - the tightest mode. So within this group, Mode 7 or 8 is worth far more consideration than Mode 9-10 if stability is the priority.
- Pure breakout (Mode 11 — Breakout Elite): A separate, asymmetric profile (tight stop, far take-profit target) dedicated to the breakout modules (Strategy 2 and 3), not on the same scale as the 10 modes above, so its Net Profit cannot be compared directly. This is the mode with the highest Profit Factor (4.19) but also the lowest win rate (67.26%) and the highest Equity Drawdown Relative (15.51%) of all 11 modes - the most volatile, suited to traders who accept higher risk for a much larger profit potential, not a "safe" choice. Because of its tight stop, this mode is also as sensitive to spread/slippage quality as the Mode 1-3 group - see the detailed explanation of the compounding effect under Mode 11 above.
Choosing a Mode by Broker Spread/Slippage Quality
All the figures in this article are measured on real tick data from VantageFX - a broker with good, stable XAUUSD spreads, so the results for the tight modes (1-3, 11) reflect close to their true potential. If you trade with a different broker, that broker's spread/slippage quality will directly affect which mode is right for you:
- Brokers with good, stable spreads (e.g. VantageFX, Ultima Markets, IC Markets, Tickmill): The tight Mode 1-3 (Precision Scalper, Rapid Scalper, Classic Scalper) clearly stand out - this is precisely the group with the highest Net Profit and Profit Factor in the backtest. With low, stable spreads, real execution cost per trade stays close to what the backtest simulated (using real tick data), so these modes perform close to the figures shown above.
- Brokers with wide or widening spreads (especially around news/session opens) or high slippage: Favor Mode 7-8 (Intraday Trader, Momentum Trader) for safer trading. The real data shows these two modes have an SL/TP distance wide enough that spread/slippage cost only takes up a small share of each trade, while still holding onto the best Profit Factor and Drawdown figures across the whole 10-mode range - it is not the case that a wider mode (Mode 9-10) is automatically safer/more efficient; the actual backtest shows the opposite. Avoid Mode 1-3 and Mode 11 on this type of broker, since a tight stop lets spread/slippage cost eat into per-trade profit at a much higher rate, and could even turn what should have been a small winning trade into a breakeven or losing one.
- Mode 4-6 and Mode 9-10 sit in a region with clearly lower Profit Factor/Recovery Factor than the rest of the current backtest data - while they still run fine on most mid-tier ECN brokers, they are not the optimal choice for capital efficiency based on the 2025-to-present test results, regardless of the broker's spread quality.
Limitations & Risk Notice
A backtest is a starting point, not a guarantee. Historical tick data quality depends on the broker providing it - the results above use real tick data from VantageFX and may differ with a different broker. Past performance, whether backtested or live, never guarantees future results. Always verify the EA's behavior on a demo account with your real broker before trading with real capital.
Live Signal: https://www.mql5.com/en/signals/2382857
Live Signal V1.3: https://www.mql5.com/en/signals/2390825
Product: Diamond Scalper on MQL5




