
See the Risk Hiding Inside Every Open Trade with Episode Health Monitor

💎 TL;DR
Episode Health Monitor is a real-time risk dashboard for XAUUSD manual traders and EA operators on MT5. It tracks the evolving state of your open position episode - health, risk, distance to your configured warning thresholds, inventory load, drift, recovery, spread pressure, and volatility regime - and displays a clear action state (HOLD/WATCH/NO ADD/REDUCE/FREEZE/EXIT) so you have an objective snapshot of your current exposure at all times. It does not open trades. It does not predict price. It gives you a clearer picture of what your open positions are doing to your account, in real time, so you can act on facts rather than instinct.

🔔 The Problem
You've been in this situation before.
You open a gold trade. Price moves $15 against you. Nothing unusual - XAUUSD breathes. You wait. Then it moves another $20. You add a second position because the level still looks valid. Another $18 down. Now you're sitting on three open positions, and your floating drawdown is starting to itch. You check the P/L number. You look at the chart. You tell yourself the structure is still holding.
But here's the truth: you don't actually know the health of your episode. You know the P/L number. That's it.
You don't know how long you've been exposed. You don't know how much your lot load is relative to what's manageable for your account. You don't know whether the spread is running hot right now and eating into your buffer. You don't know if market volatility has shifted into expansion mode, which changes how far price can travel against you before your structure breaks. You don't know whether the recovery from your worst floating is holding or quietly reversing.
So you sit. And you wait. And sometimes it works out. And sometimes that itch turns into a blowout.
This creates what we call the "invisible episode" problem. The trade is deteriorating in ways that are difficult to judge from price and floating P/L alone. Most of the signals are there - in the lot load, the drift, the spread, the time - but they're scattered across your terminal in numbers that require active mental effort to synthesize into a single risk picture. Under pressure, that synthesis rarely happens clearly or quickly enough.
🏆 The Real Engine
Most risk tools are static calculators. You plug in your lot size and stop loss, they tell you the dollar risk. That calculation is done by the time you press the button - it tells you nothing about what happens next as the episode evolves, as you add positions, as the market shifts regime.
Episode Health Monitor is built around a different philosophy. It reads your open positions as an evolving trade episode and computes a composite health profile that updates continuously. It's not measuring your lot size against a fixed stop. It's measuring whether your trade, as it exists right now, is stable or deteriorating - and through which specific channel.
The core output is three model-derived scores:
✅ Health % - a composite measure of how well your episode is holding up given its age, lot load, drift from entry, and current market conditions. A high score indicates minimal measured stress according to the monitor's model. When this number starts falling, something in the episode is changing.
✅ Risk % - an escalating exposure index weighted by inventory load, drawdown depth relative to your configured thresholds, spread friction, and deterioration speed. This is the monitor's internal composite score, not account risk in the strict mathematical sense. Low is fine. If this number climbs quickly, the episode pressure is building.
✅ Distance % - your remaining buffer before the episode reaches your configured warning thresholds. When this starts collapsing toward 20%, the monitor will tell you.
Underneath these three scores, the engine continuously measures eight proprietary composite factors: drift pressure, inventory load, hold stretch, damage rate, recovery weakness, spread friction, exposure imbalance, and hedge gap. Each captures a different dimension of episode deterioration. The highest-contributing factor gets named on screen as the main pressure reason - so you always know what's actually driving your risk, not just that the number changed.
The output of all this is one clear action state displayed at the bottom of the panel: five escalating warnings - WATCH, NO ADD, REDUCE, FREEZE, EXIT - and one baseline state when the episode is stable: HOLD.
🚀 What the Monitor Shows
🏅 Live Episode Health Dashboard
The panel stays on your chart at all times once loaded. When you have no open positions, it shows WAIT - monitoring scope, ready to activate the moment a position opens. When you enter a trade, the episode timer starts and the dashboard activates. Health, Risk, and Distance are displayed as large percentage values with color-coded progress bars - green when stable, amber when heating, red when the action state is escalating.
🏅 Position Inventory Tracking
The monitor scans every open position on XAUUSD (or across all symbols if configured) and computes your gross lots, net lots, buy/sell imbalance, average entry prices, oldest position age, and position count. This gives you a complete inventory view, not just a single floating number.
🏅 Floating P/L and Worst Drawdown
You see your real-time floating P/L and the worst floating level reached during the episode. The gap between these two tells you how much you've recovered from your deepest point - and whether that recovery is holding or reversing. This is one of the clearest early signals that a trade is moving in the wrong direction.
🏅 Spread Ratio Display
Instead of showing the raw spread in points, the monitor computes a real-time spread ratio against a smoothed historical baseline. If the current spread is 0.9× normal, you're fine. If it's 2.1× normal - which happens regularly during gold news events - the spread friction factor rises and feeds directly into your Risk score. Most traders don't notice spread spikes while managing a trade under pressure. This does.
🏅 Volatility and Pullback Regime
The panel reads the current volatility environment - Quiet, Normal, Expanding, or Unstable - and the pullback strength - Weak, Normal, or Strong - derived from ATR comparisons that adapt to the chart timeframe you're running. These two context signals help you interpret the action state correctly. A REDUCE warning in a Quiet volatility environment means something different than the same warning during Unstable volatility.
🏅 Adjustable Risk Profiles
The monitor ships with three built-in risk profiles - Conservative, Normal, and Hedge/Inventory - as well as a fully Custom profile where you set your own lot comfort thresholds, drawdown percentage triggers for warning/danger/critical states, and hold-time warning levels. There's also an Equity-Adjusted mode that scales the lot comfort thresholds to your actual account equity, so the scores reflect what's meaningful at your account size rather than a fixed absolute lot number.
One important note: while a hard stop loss is not required for the calculations to run, the monitor still relies on your configured drawdown thresholds to calibrate its risk scores accurately. Setting those inputs to reflect your actual risk tolerance is what makes the scores meaningful.
🏅 Smart Alerts
When the episode crosses a threshold you care about, the monitor can fire a popup alert, push notification, email alert, or custom sound file. You choose which action states trigger alerts and whether you want them only on state changes (the recommended setting) or on every cycle. There's also a risk jump alert - if your Risk % climbs above a configurable threshold in a short period, you get notified even if the action state hasn't formally changed yet.
🔎 What This Looks Like in Real Trading
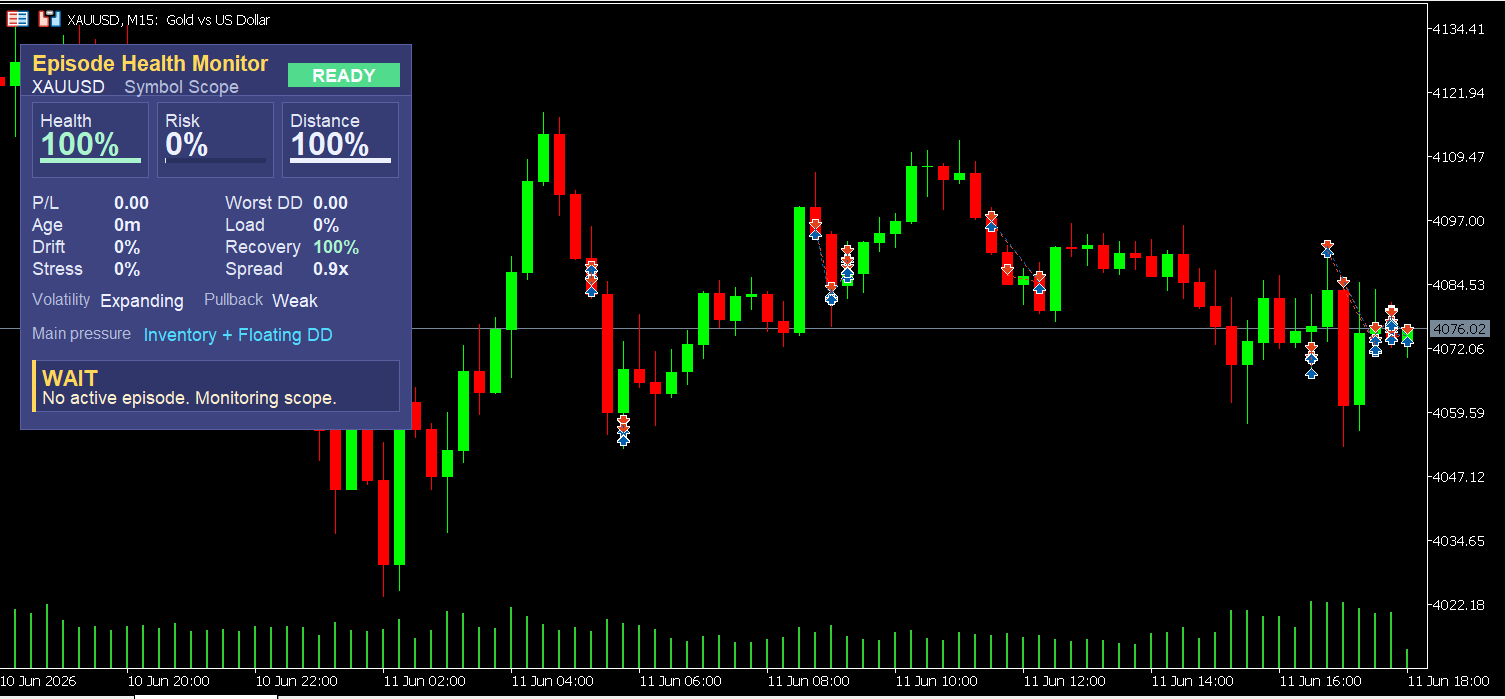
The screenshot above was taken on June 11, 2026 on the XAUUSD M15 chart, gold near the $4,076 level.
The monitor is showing WAIT - no active open positions, monitoring scope. Health is 100%, Risk is 0%, Distance is 100%. The historical trade arrows visible on the chart background are from completed cycles in earlier sessions. This is intentional behavior: the moment all positions in an episode are closed, the monitor cleanly resets to baseline and waits for the next episode to begin. It does not carry stale data from completed trades into a new episode.
Even in a flat state, the monitor has useful information on screen. Spread is running at a healthy 0.9× baseline. Volatility is in Expanding regime with a Weak pullback - context that's directly relevant to the timing and sizing decision for the next trade. The "Main pressure" line shows what pressure factor is most elevated in the background market environment at that moment. When you open a position, the episode model activates with that market context already loaded.
This is the kind of pre-trade situational awareness that most traders build mentally - often with incomplete information or under the time pressure of watching price move.
🌟 Practical Advantages Worth Noting
✅ Works with any trading style. Manual traders use it to monitor their own discretionary positions. EA users attach it alongside their bot to get a human-readable composite view of what the bot is doing to account exposure in real time.
Symbol scope flexibility. Run it on the current symbol only, or set it to monitor all open positions across charts. Filter by magic number to watch a specific EA's episode in isolation.
✅ No hard stop loss required. The monitor uses ATR baselines, spread sampling, position age, and lot load to estimate episode stress - not a fixed SL distance. This makes it usable for both SL-based and SL-free approaches, including hedging and inventory strategies where traditional SL placement doesn't apply cleanly.
✅ Compact panel, clean chart. The panel fits on any timeframe chart without obscuring price action. The blue utility theme is readable on standard dark MT5 backgrounds, with color-coded values that shift with episode state.
✅ Minimal performance impact. The indicator uses incremental update logic - it only recalculates when a new bar opens, when positions change, or when the timer fires. It doesn't reprocess the full history on every tick, which keeps CPU usage low even on lower-spec VPS environments.
🎁 Who This Is For
This tool is built for XAUUSD traders who are already trading and want an objective, real-time picture of what their open positions are doing to their account beyond the raw P/L number.
It's particularly useful for manual traders who tend to add to positions during drawdowns and need a structured signal for when to stop. For EA users who want a human-readable health layer on top of their bot's activity without having to read trade logs. For traders running hedge or inventory strategies where multiple simultaneous positions make net exposure non-obvious from the chart alone.
✨ This is NOT suited for traders who:
- Need an entry signal generator or directional bias tool
- Want automated trade execution or an integrated stop loss
- Are looking for backtesting or strategy evaluation functionality
- Expect the tool to manage risk for them - it provides information, the decisions remain yours
📢 What It Doesn't Do
It does not open, modify, or close trades. There is no automatic trading logic of any kind.
It does not predict where price is going. The action states are based on the current health of your episode, not on chart patterns or market direction forecasts.
It does not protect you from loss if you choose to ignore the EXIT signal. It displays what the model is reading. Acting on it remains your responsibility.
It does not replace position-level risk management. Knowing your lot sizing and account risk before you enter is still essential. This tool monitors the episode after entry - not before it.
It does not work on historical data. There is no backtest mode. It reads live positions only.
🎁 Get the Tool
👉 Episode Health Monitor on MQL5 Market: https://www.mql5.com/en/market/product/170646 🎁💯
If you've ever watched a trade deteriorate and wished you had a clearer, more objective picture of how the episode was actually developing before you decided to add, hold, or exit - this tool gives you that picture, live, on every tick.
🧰 Related Tools
👉 Equity Protector Pro MT5 - Episode Health Monitor gives you visibility into the state of your open episode. Equity Protector Pro enforces a hard account-level drawdown ceiling - if the episode moves beyond your preset limit, it closes everything. The two tools work at different layers: episode awareness versus account-level enforcement. Together they cover the full risk chain from real-time monitoring to hard protection.
👉 Gold Trade Manager PRO - When the Episode Health Monitor tells you to REDUCE or EXIT, Gold Trade Manager PRO gives you one-click execution for partials, full close, trailing stops, and breakeven directly from your chart. The monitor reads the diagnosis; the Trade Manager acts on it. Running both on the same chart makes the response loop as short as possible.
👉 Gold Bias Regime Filter - The volatility and pullback regime signals in Episode Health Monitor give you a surface-level read of market conditions during an open episode. Gold Bias Regime Filter classifies the market's directional bias and momentum regime before you enter, so you can filter which setups are worth opening an episode on in the first place. Use it as your pre-trade context layer.
❓ FAQ
✅ Does this work with EA bots or only manual trading? Both. The monitor reads all open positions matching your configured scope - symbol, magic number filter, or all trades including manual. EA users commonly run it on a separate chart to get a human-readable composite view of what their bot is doing to account exposure, without needing to parse raw position data or trade logs.
✅ Will it close my trades automatically when it shows EXIT? No. Episode Health Monitor is a read-only dashboard. It displays the EXIT state and fires an alert if configured to do so. The decision to close the trade is entirely yours. This is intentional - the tool is designed to inform, not override.
✅ What's the difference between Health % and Risk %? Health measures how well your episode is holding up relative to its age, lot load, and how the market has behaved since you entered. Risk measures your current exposure pressure - how much stress the episode is carrying if conditions continue in their current direction. They're related but not the same. A useful example: a lightly sized position held for several hours may show lower Health because the episode has stretched in time, while Risk stays moderate because the lot load is still small. Both scores matter; neither alone tells the full story.
✅ Can I use this on accounts smaller than $1,000? Yes. With the Equity-Adjusted Profile enabled, the lot comfort thresholds scale to your actual account equity. On a $500 account, 0.01 lots is a meaningful position. On a $50,000 account, the same lot is negligible. The monitor adjusts its calibration so the risk scores reflect what's relevant at your specific account size. On smaller accounts, it's also worth configuring your Custom profile thresholds carefully to match your actual risk tolerance.
✅ What timeframe should I attach this to? Any timeframe works. The ATR baseline and spread sampling pull data from the chart the indicator is attached to, so M15 or H1 typically gives the most stable baseline readings for intraday and swing approaches. Scalpers can attach it to M1 and the panel functions the same way. The key is that the chart timeframe should match the trading style the episode was built around.
✅ Can I run multiple instances for different EAs at the same time? Yes. Each instance runs independently on its own chart. You can filter one copy to Magic Number 1001 and another to Magic Number 2002. Each maintains its own episode state, pressure tracking, and alert history with no cross-contamination between instances.
✅ Do I need to set a stop loss on my positions for the tool to work? No. The monitor computes its scores from ATR baselines, spread sampling, position age, lot load, and your configured drawdown thresholds - not from a hard SL on the position. That said, setting your custom drawdown threshold inputs to reflect your actual risk tolerance is what calibrates the Risk and Distance scores accurately. The inputs are the reference point the model uses when your positions don't carry a hard SL.
🎁 New to Gold Algo Lab?
Start with the Gold Algo Lab Tool Map - a practical guide that organizes our MT5 tools into 6 connected stages: market context, setup selection, risk planning, trade execution, position management and account protection.
→ Gold Algo Lab Tool Map: Where to Actually Start With MT5 Tools for XAUUSD
https://www.mql5.com/en/blogs/post/771930
Do not choose a tool by its name alone. Start with the part of your trading process that needs the most control, then build your workflow one layer at a time.
Gold Algo Lab builds practical, risk-first MT5 tools for serious XAUUSD traders, shaped by 8 years of developing and trading real systems to help traders identify clearer setups, manage risk with greater confidence and execute with more discipline.




