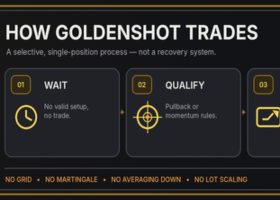
GLM 5.3 took this Swiss scientific ORB article and improved it

A Swiss research team took the opening range breakout, the most worn out day trading idea there is, and added one filter to it. The base version returned 29% over nine years. With the filter, the same entries returned 1,637%.
We put the paper into the knowledge hub and asked GLM 5.3 to work with it. What came back surprised us in a few ways. GLM used ADX instead of volume.The Swiss Discovery
The paper is Swiss Finance Institute Research Paper Series N°24-98, and its title says what it is after: A Profitable Day Trading Strategy for The U.S. Equity Market.
The opening range breakout is simple. Mark the high and the low of the first candles of the session, and trade the break of that range. Everybody knows it. On its own it barely works.
What the researchers added is one question asked before the entry: is today busier than usual? They measure the morning volume across a basket of stocks and compare it against what that stock normally does at that hour. If relative volume is up, the breakout is taken. If it is not, the day is skipped.
That is the whole modification. Here is what it did over nine years on US stocks, with a stop at 10% of ATR and the position closed at the end of the day.
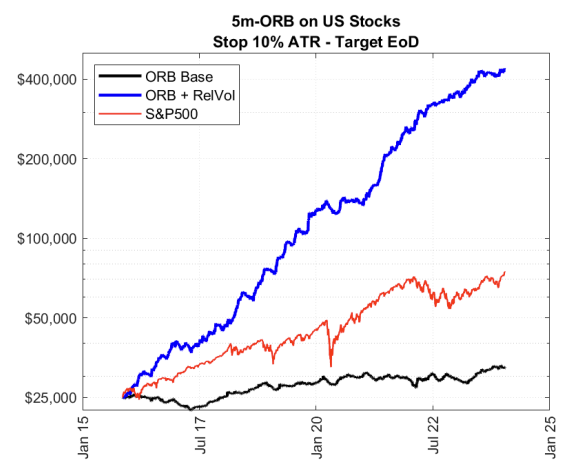
Black is the plain opening range breakout. Blue is the same thing with the relative volume filter. Red is the S&P 500 for scale.
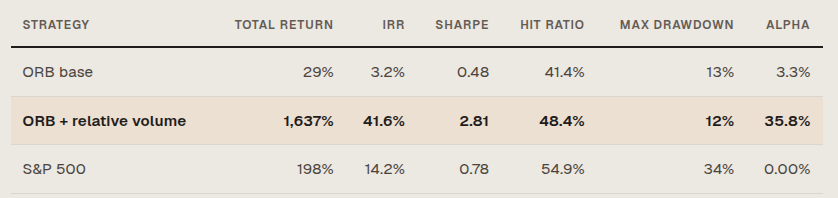
The results table from the paper. Note the hit ratio: the filtered version wins less often than simply holding the index.
What We Asked GLM 5.3
We put the paper in the knowledge hub and pointed the builder at a different market. Gold, not US stocks. And no real volume to measure, because forex and metals do not report it the way an equity exchange does.
So the model had to find another way to ask the same question: did this session actually move with force behind it?
The Entry Logic It Built
Two hours in the day matter, and both are parameters. An anchor hour and a signal hour.
- The close of the first bar at or after the anchor hour is stored. That opens the session.
- At the first bar at or after the signal hour, the two closes are compared. Signal above anchor means long, below means short, exactly equal means no trade that day.
- The anchor is forced to sit at least four hours before the signal. Set it later and the strategy pulls it back for you, so the window can never collapse or invert.
- The permission rule: right through the anchor session it counts every bar where ADX strength clears a threshold and the bar closes with a clear direction. At the signal it only enters if enough of those events point the same way as the bias.
- Entry is a market order at the close of the bar that clears the filter.
Read that against the paper and the shape is the same. A direction taken from the session that already happened, and a separate strength test that decides whether the direction is worth acting on. Relative volume became ADX events, because that is what the instrument offers.
The exits are unglamorous on purpose. A time exit after a set number of bars does most of the work, plus an ATR stop frozen at entry. There is no take profit at all.
The Results
$32,090.53 profit, a gain of 315.94%, against a maximum drawdown of $2,465.77, or 12.43%. Two years of Gold, 210 trades, traded at 9 lots.
The same table as above, with our run added to it.
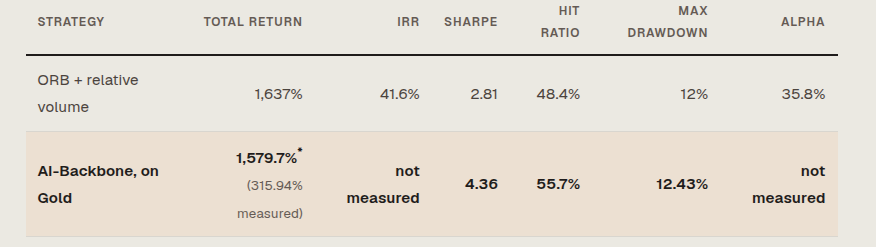
* Our backtest covers two years and returned 315.94%, which is $16,045 of profit a year. The strategy trades a constant lot size, so that profit does not compound: ten years of it is $160,453, or 1,579.7% of the starting account.
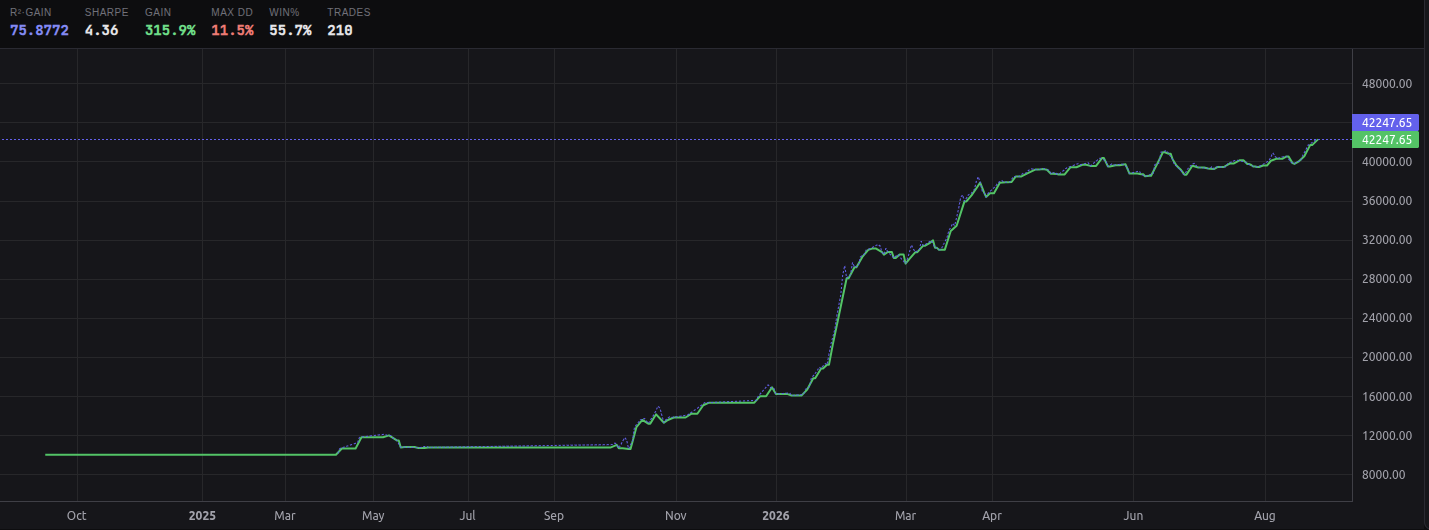
The equity curve.
The flat stretch through the first half is not a bug. The filter refuses most days without significant movements. The strategy seems to have focused on the recent few years of higher volatility. So we may expect the strategy to become quite in case the Gold market cools down.
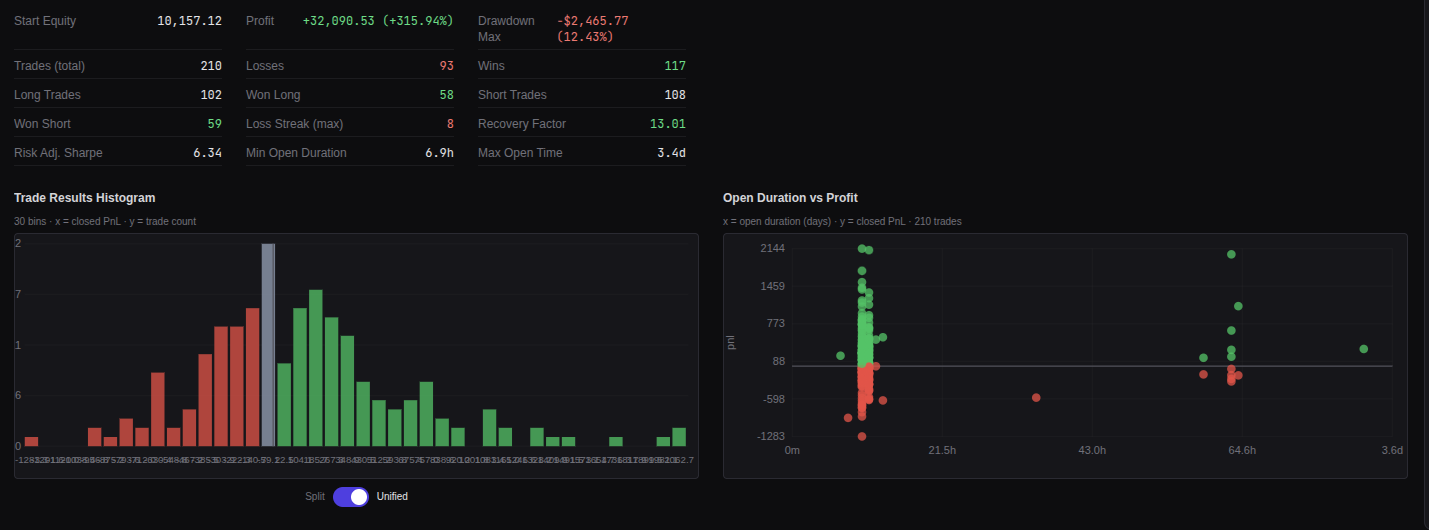
Recovery factor 13.01, risk adjusted Sharpe 6.34, longest losing streak 8.
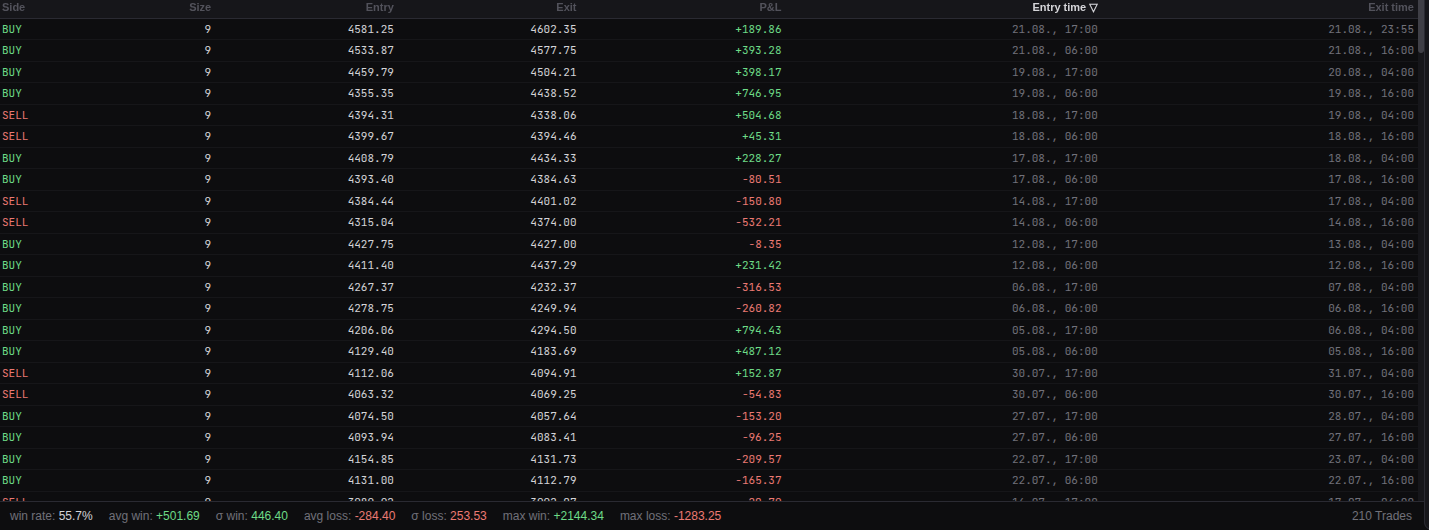
Average win $501.69 against an average loss of $284.40. Largest win $2,144.34, largest loss $1,283.25.
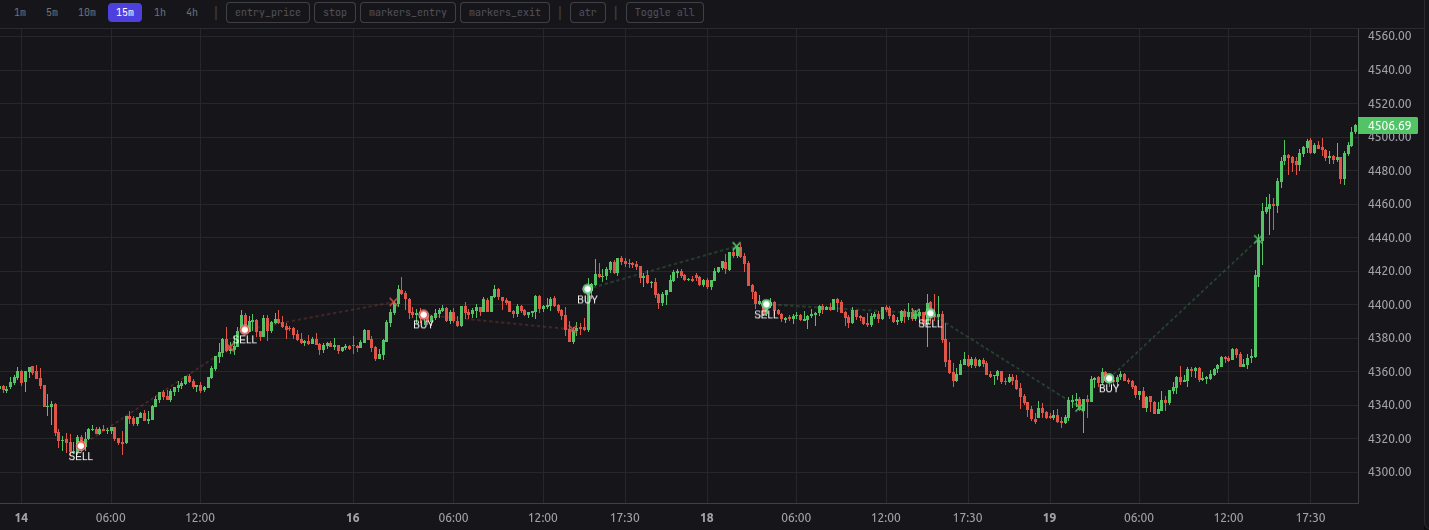
The trades on the chart. One decision per session.
A 55.7% win rate with wins nearly twice the size of the losses. That is the same profile the paper reports.
Held at a constant lot size for ten years, our run adds up to 1,579.7%. The paper measured 1,637% over nine.
Download the Source Code
This strategy is now part of the Starter Package, together with three others. Full source code, the exact parameters that produced the numbers above, and the documentation that walks you from the first backtest to a live account.